Vanguard Australian Shares Index ETF closed FY26 with a net return of 6.12%, and for Australia’s largest ETF by market capitalisation, the number itself is less interesting than what produced it. Dividends carried the majority of the year’s total return. Capital growth contributed less than half. That split tells you something specific about the kind of year Australian equities delivered and whether the result should change how you think about VAS as a core holding.
FY26 was a moderate year for the Australian sharemarket, landing below the long-run historical average of roughly 9-10% per annum. For the millions of Australian investors who hold VAS directly or through superannuation, the question is not simply whether 6% is good or bad. It is whether the fund did what it was designed to do, what the return cost to earn, and what it reveals about the structural role VAS plays in a portfolio.
Here is what the return breakdown, fee mechanics, sector concentration, and income profile actually tell you about VAS as a long-term portfolio building block, and where the gaps sit that a single domestic ETF cannot fill.
How VAS performed in FY26: the numbers behind the headline
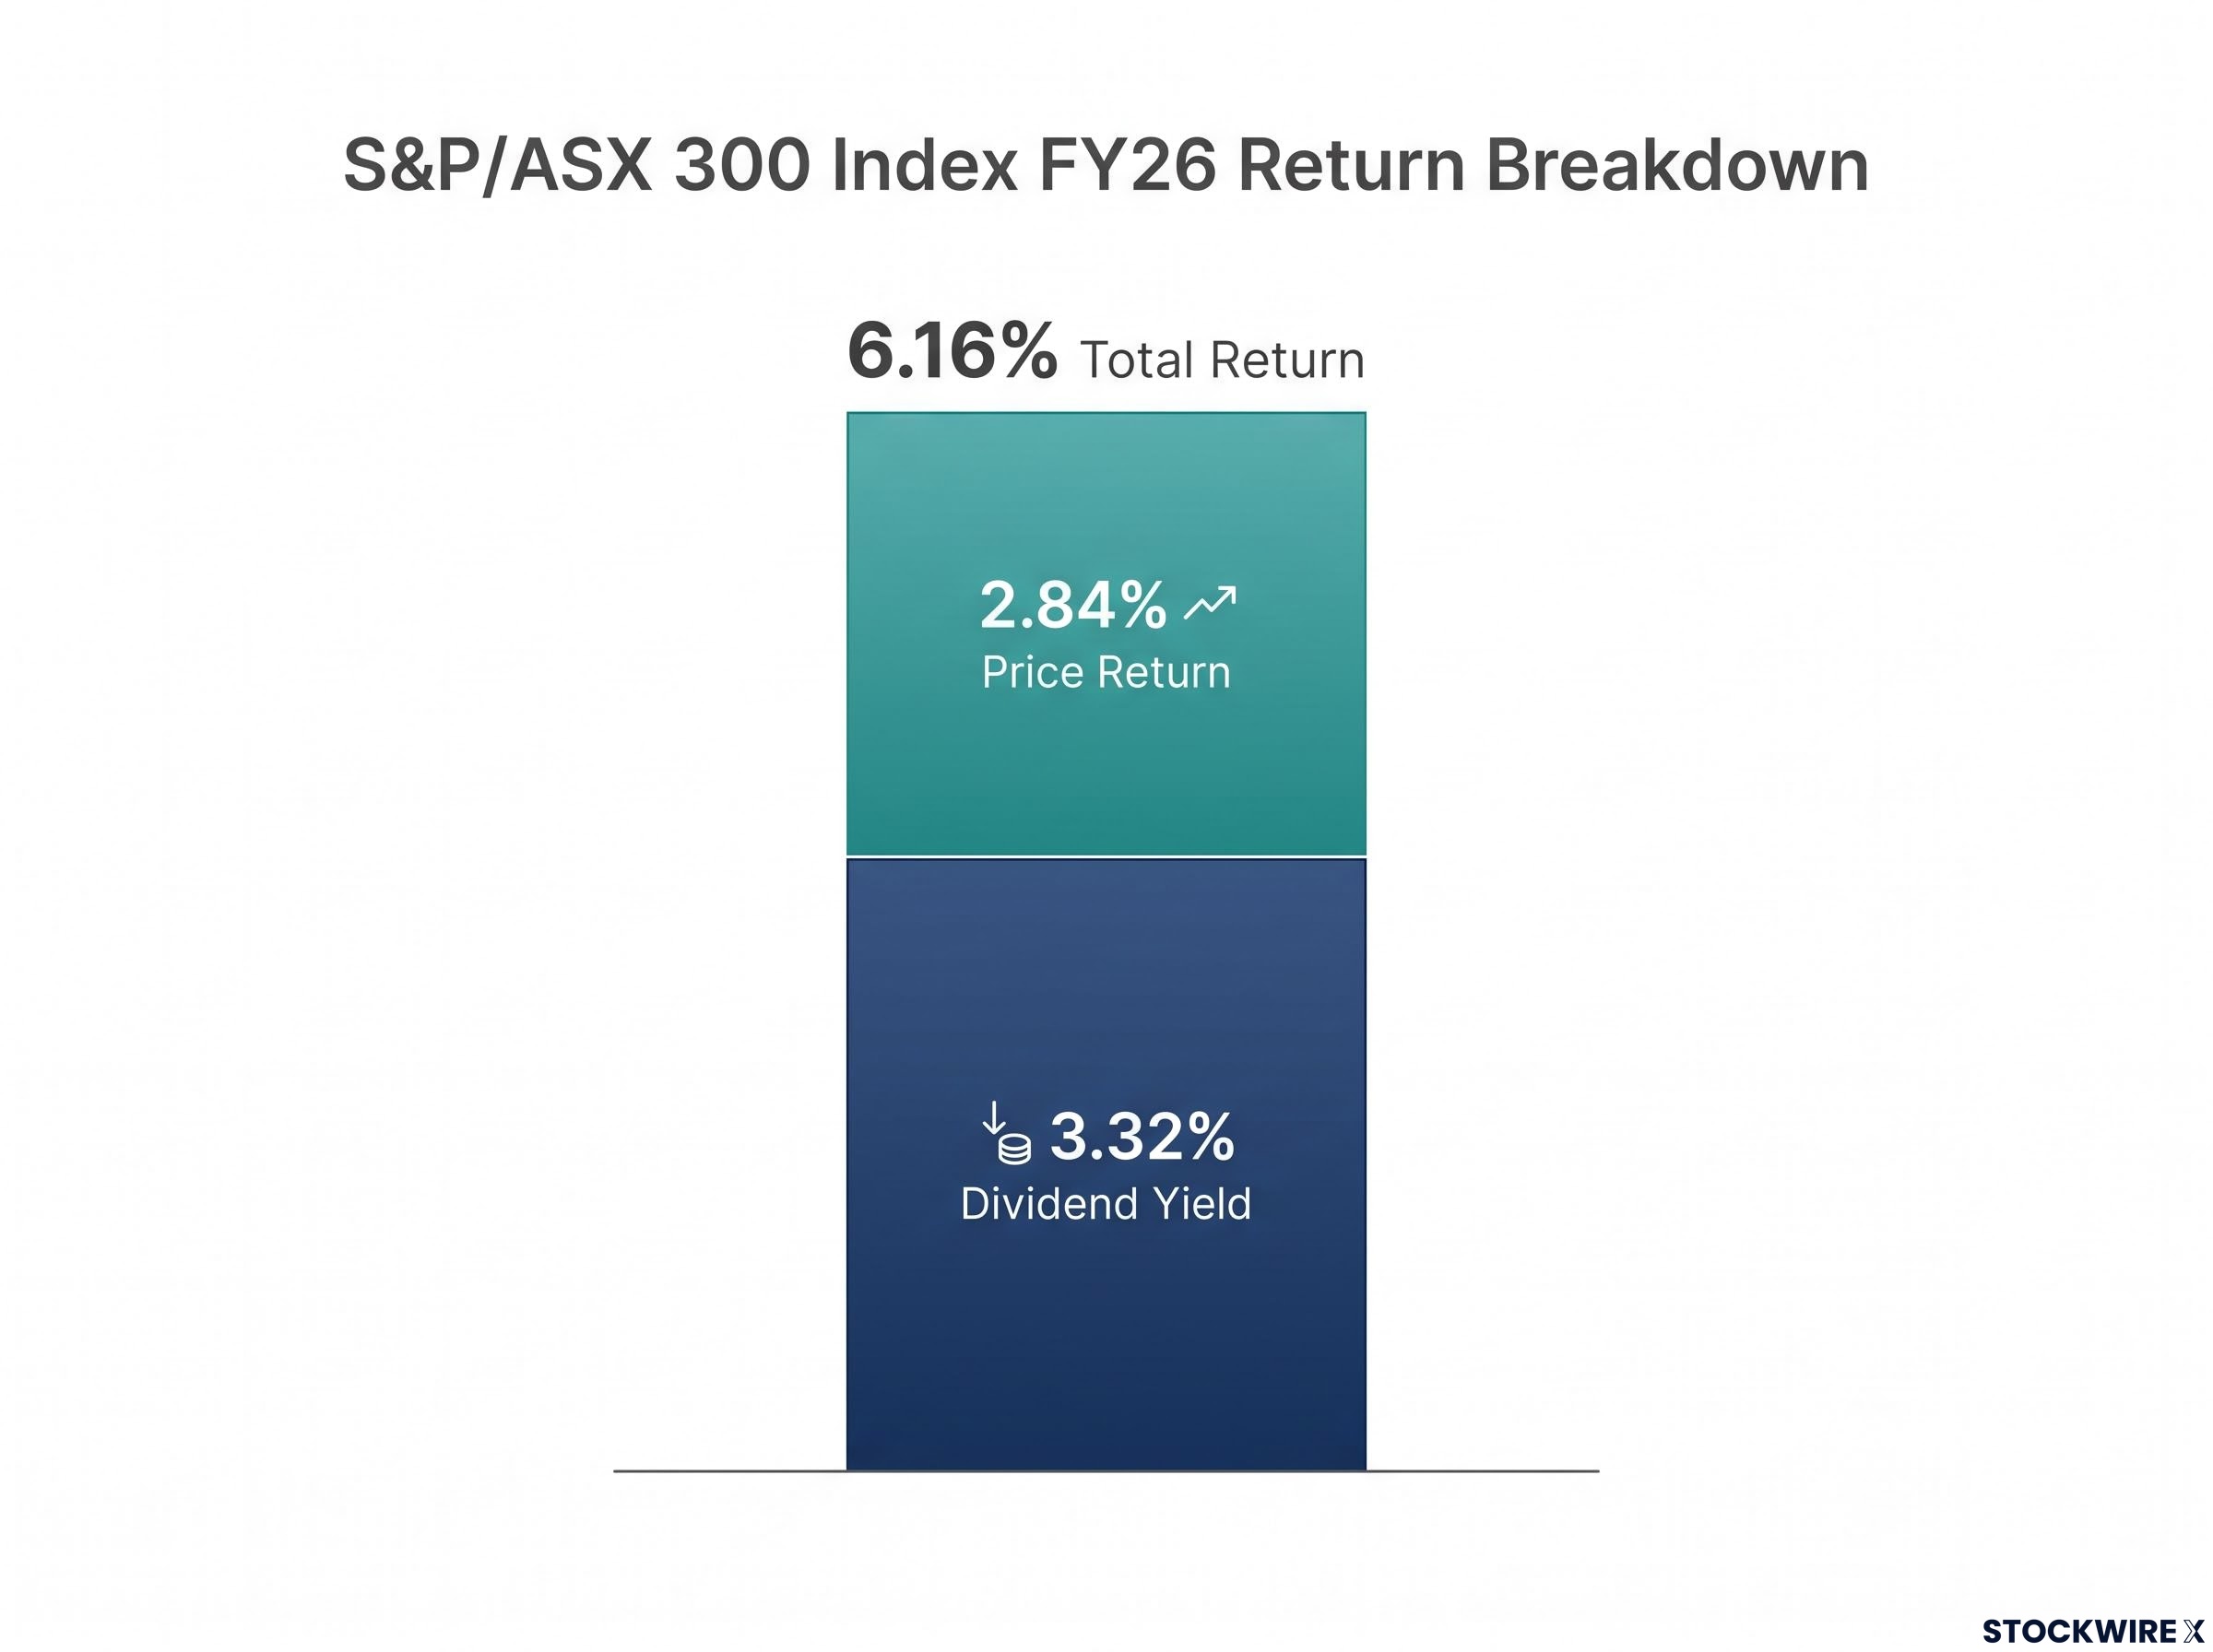
Start with the benchmark. The S&P/ASX 300 Index posted a total return of 6.16% for FY26, made up of a 2.84% price return and a 3.32% dividend yield, with income accounting for roughly 54% of the overall result. FY26 was not a capital appreciation story.
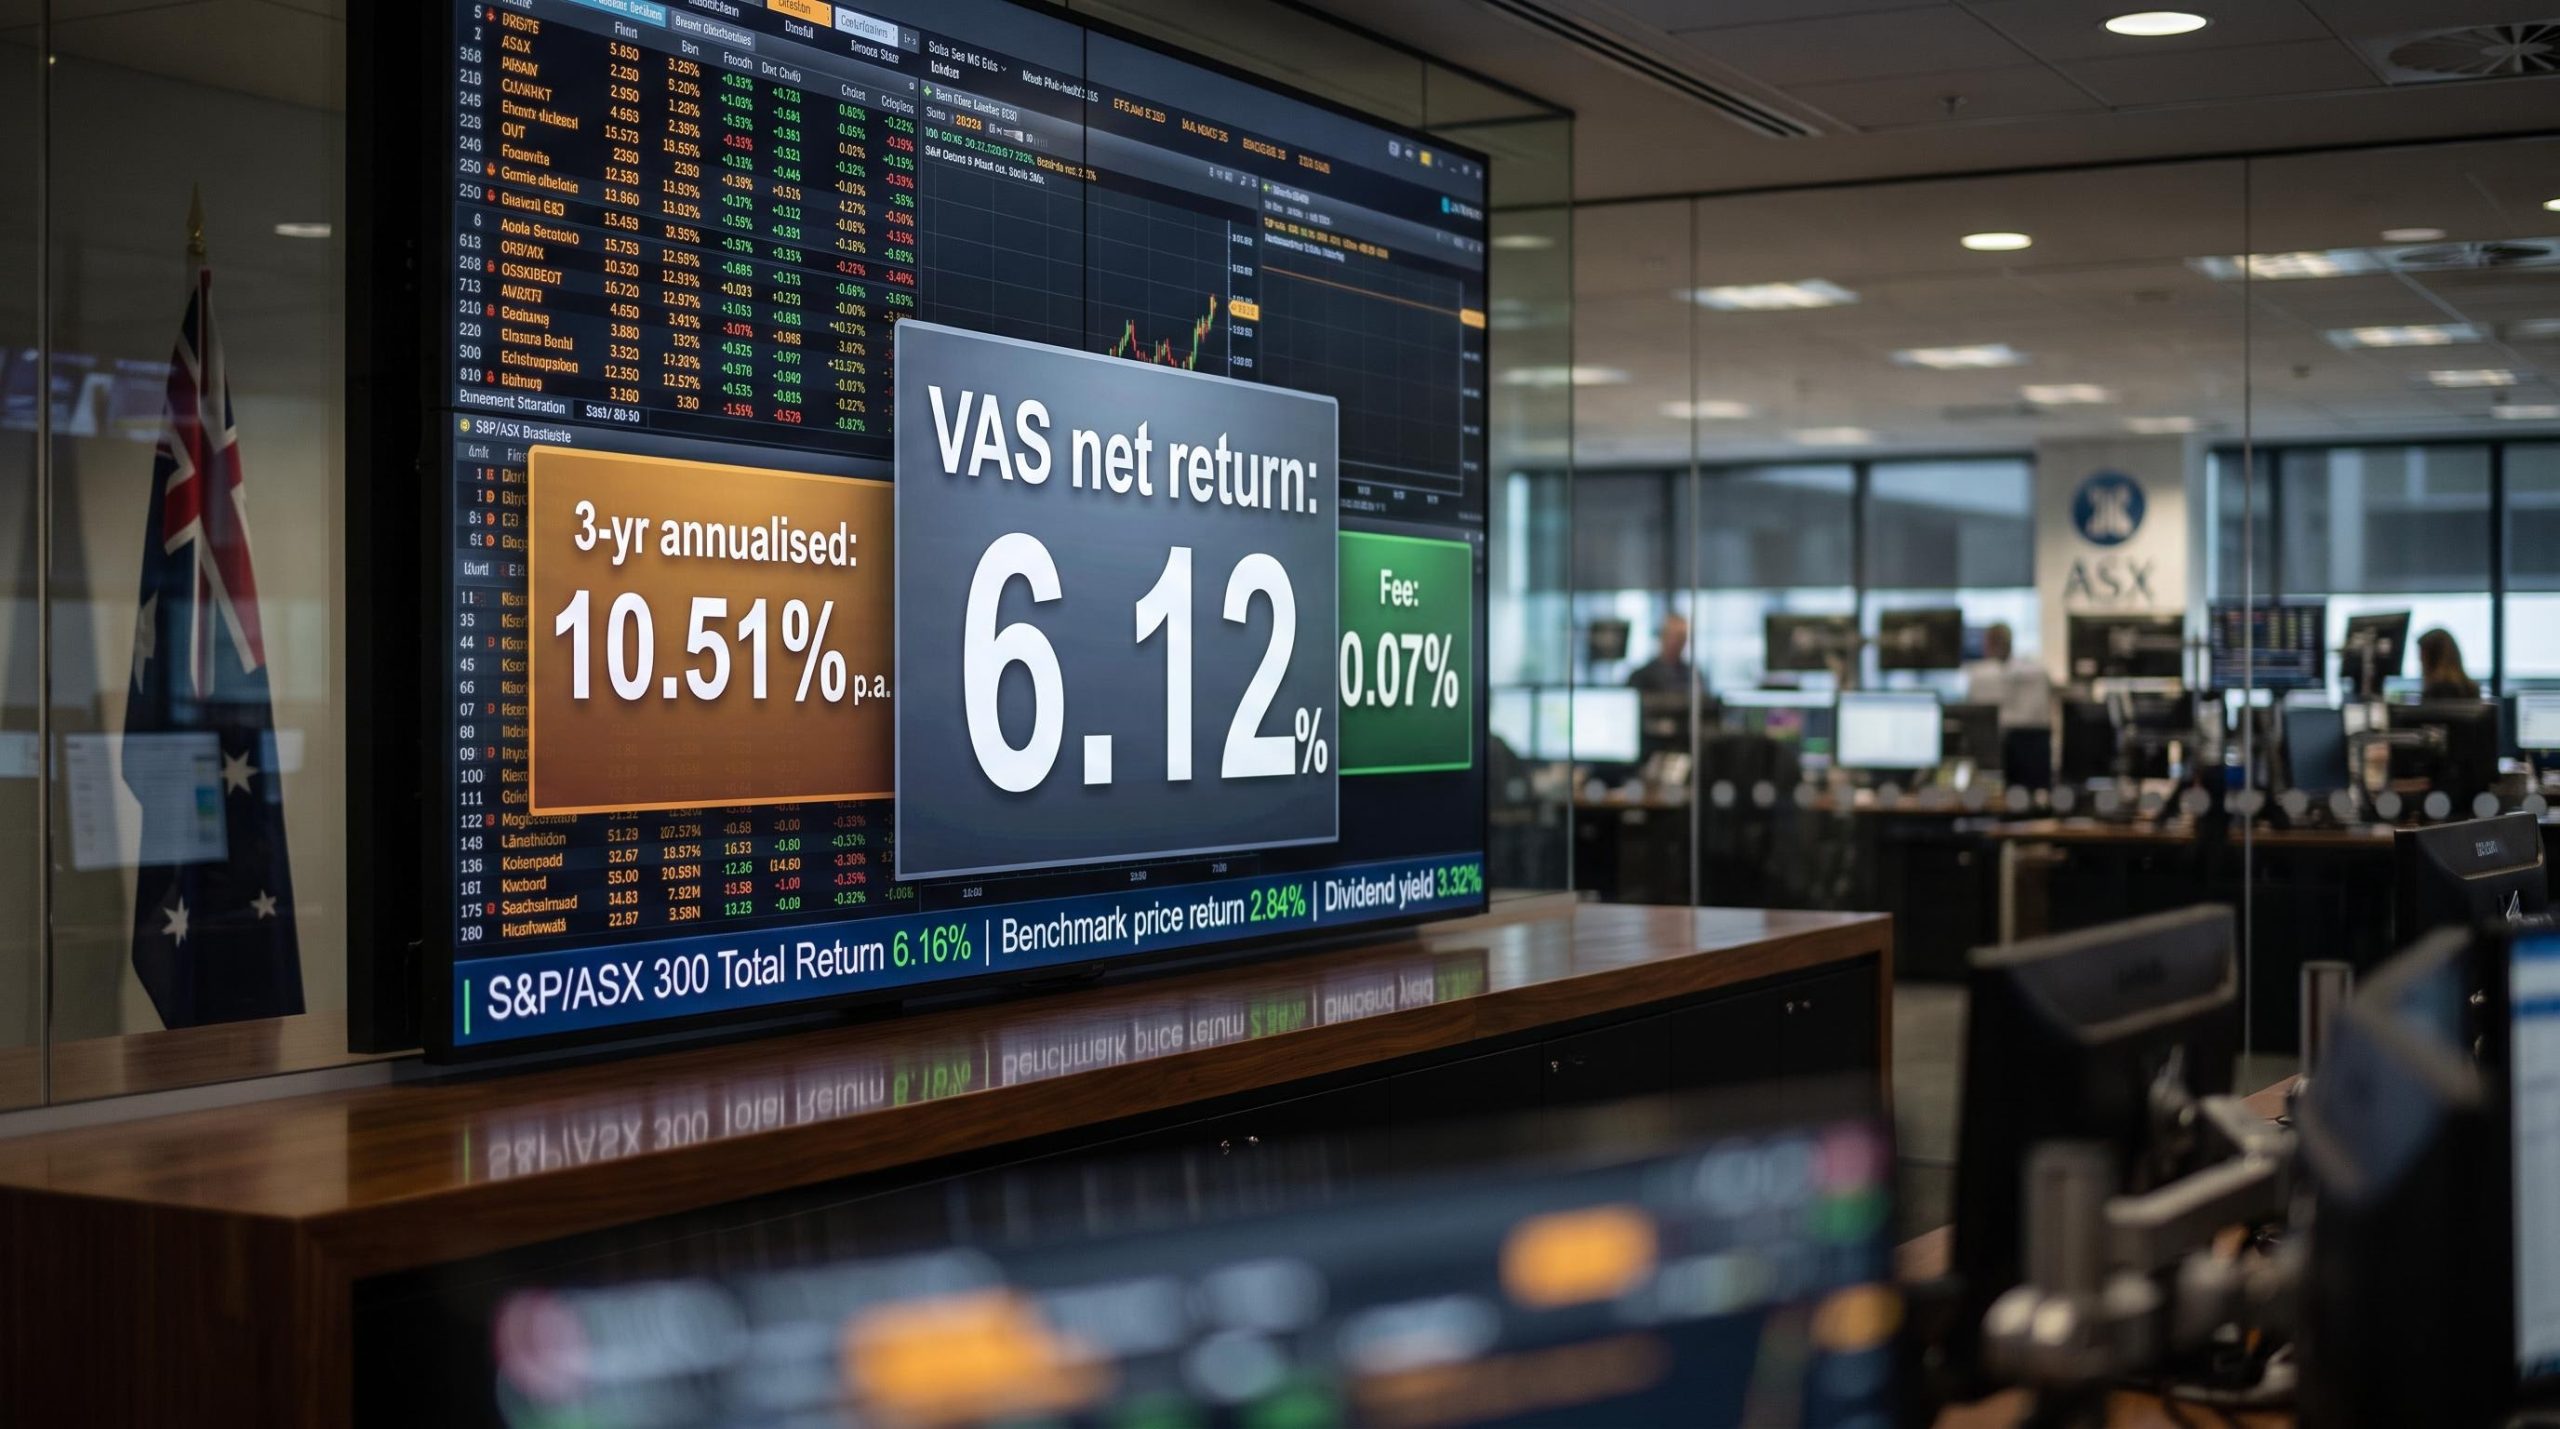
VAS itself delivered a gross return of 6.19%, marginally ahead of the benchmark. That slim outperformance reflects technical factors (securities lending income, cash flow timing) rather than any active stock selection. Once the 0.07% annual management fee is subtracted, the net return available to investors came to 6.12%.
Key figure: VAS delivered a net investor return of 6.12% against a benchmark total return of 6.16%, with the 0.07% fee explaining virtually the entire gap.
Independent data sources corroborate the result, reporting a one-year total return of approximately 6.05%, with the minor difference falling within the normal range of NAV-versus-market-price measurement variation.
The longer-term picture adds context. According to Vanguard’s fund report, VAS returned 10.51% per annum over three years and 7.57% per annum over five years to 30 June 2026. Units finished the year priced at $109.30, reaching their high of $114.25 during the session on 27 February 2026 before retreating into year-end.
| Return layer | FY26 figure |
|---|---|
| Benchmark price return | 2.84% |
| Benchmark dividend yield | 3.32% |
| Benchmark total return | 6.16% |
| VAS gross return | 6.19% |
| VAS net return | 6.12% |
The income-heavy split matters when you compare VAS against growth-oriented alternatives. A 6% return driven primarily by dividends lands very differently from a 6% return driven by capital gains, particularly once your tax situation enters the equation.
When big ASX news breaks, our subscribers know first
What the 0.07% management fee actually means in practice
A 0.07% management fee sounds impossibly small. In dollar terms, it means you pay $0.07 for every $100 invested per year. On a $10,000 holding, that is $7 annually.
The figure gains weight when you set it against the competition:
- VAS management fee: 0.07% per annum ($7 per year on $10,000)
- Typical actively managed Australian equity fund: 0.75-1.25% per annum ($75-$125 per year on $10,000)
- Annual fee gap: approximately 0.7-1.2 percentage points
On a $10,000 investment, you pay $7 per year in VAS fees. The same amount in a typical active fund costs $75-$125 per year. That gap compounds.
The fee differential is the single most predictable variable in fund performance. Even when gross returns between an active fund and VAS are similar in any given year, a sustained 1 percentage point annual advantage compounds into a material outcome gap over 20-plus years. That compounding effect is the core reason passive index funds have displaced much active management in Australian retail portfolios, and it is the one performance lever you can control before the market opens.
Understanding what VAS actually holds (and what it does not)
VAS tracks the S&P/ASX 300 Index by market capitalisation weighting. That means the portfolio’s shape is determined entirely by the size of Australian listed companies. No fund manager is choosing to overweight banks or underweight technology. The market’s structure makes those decisions automatically.
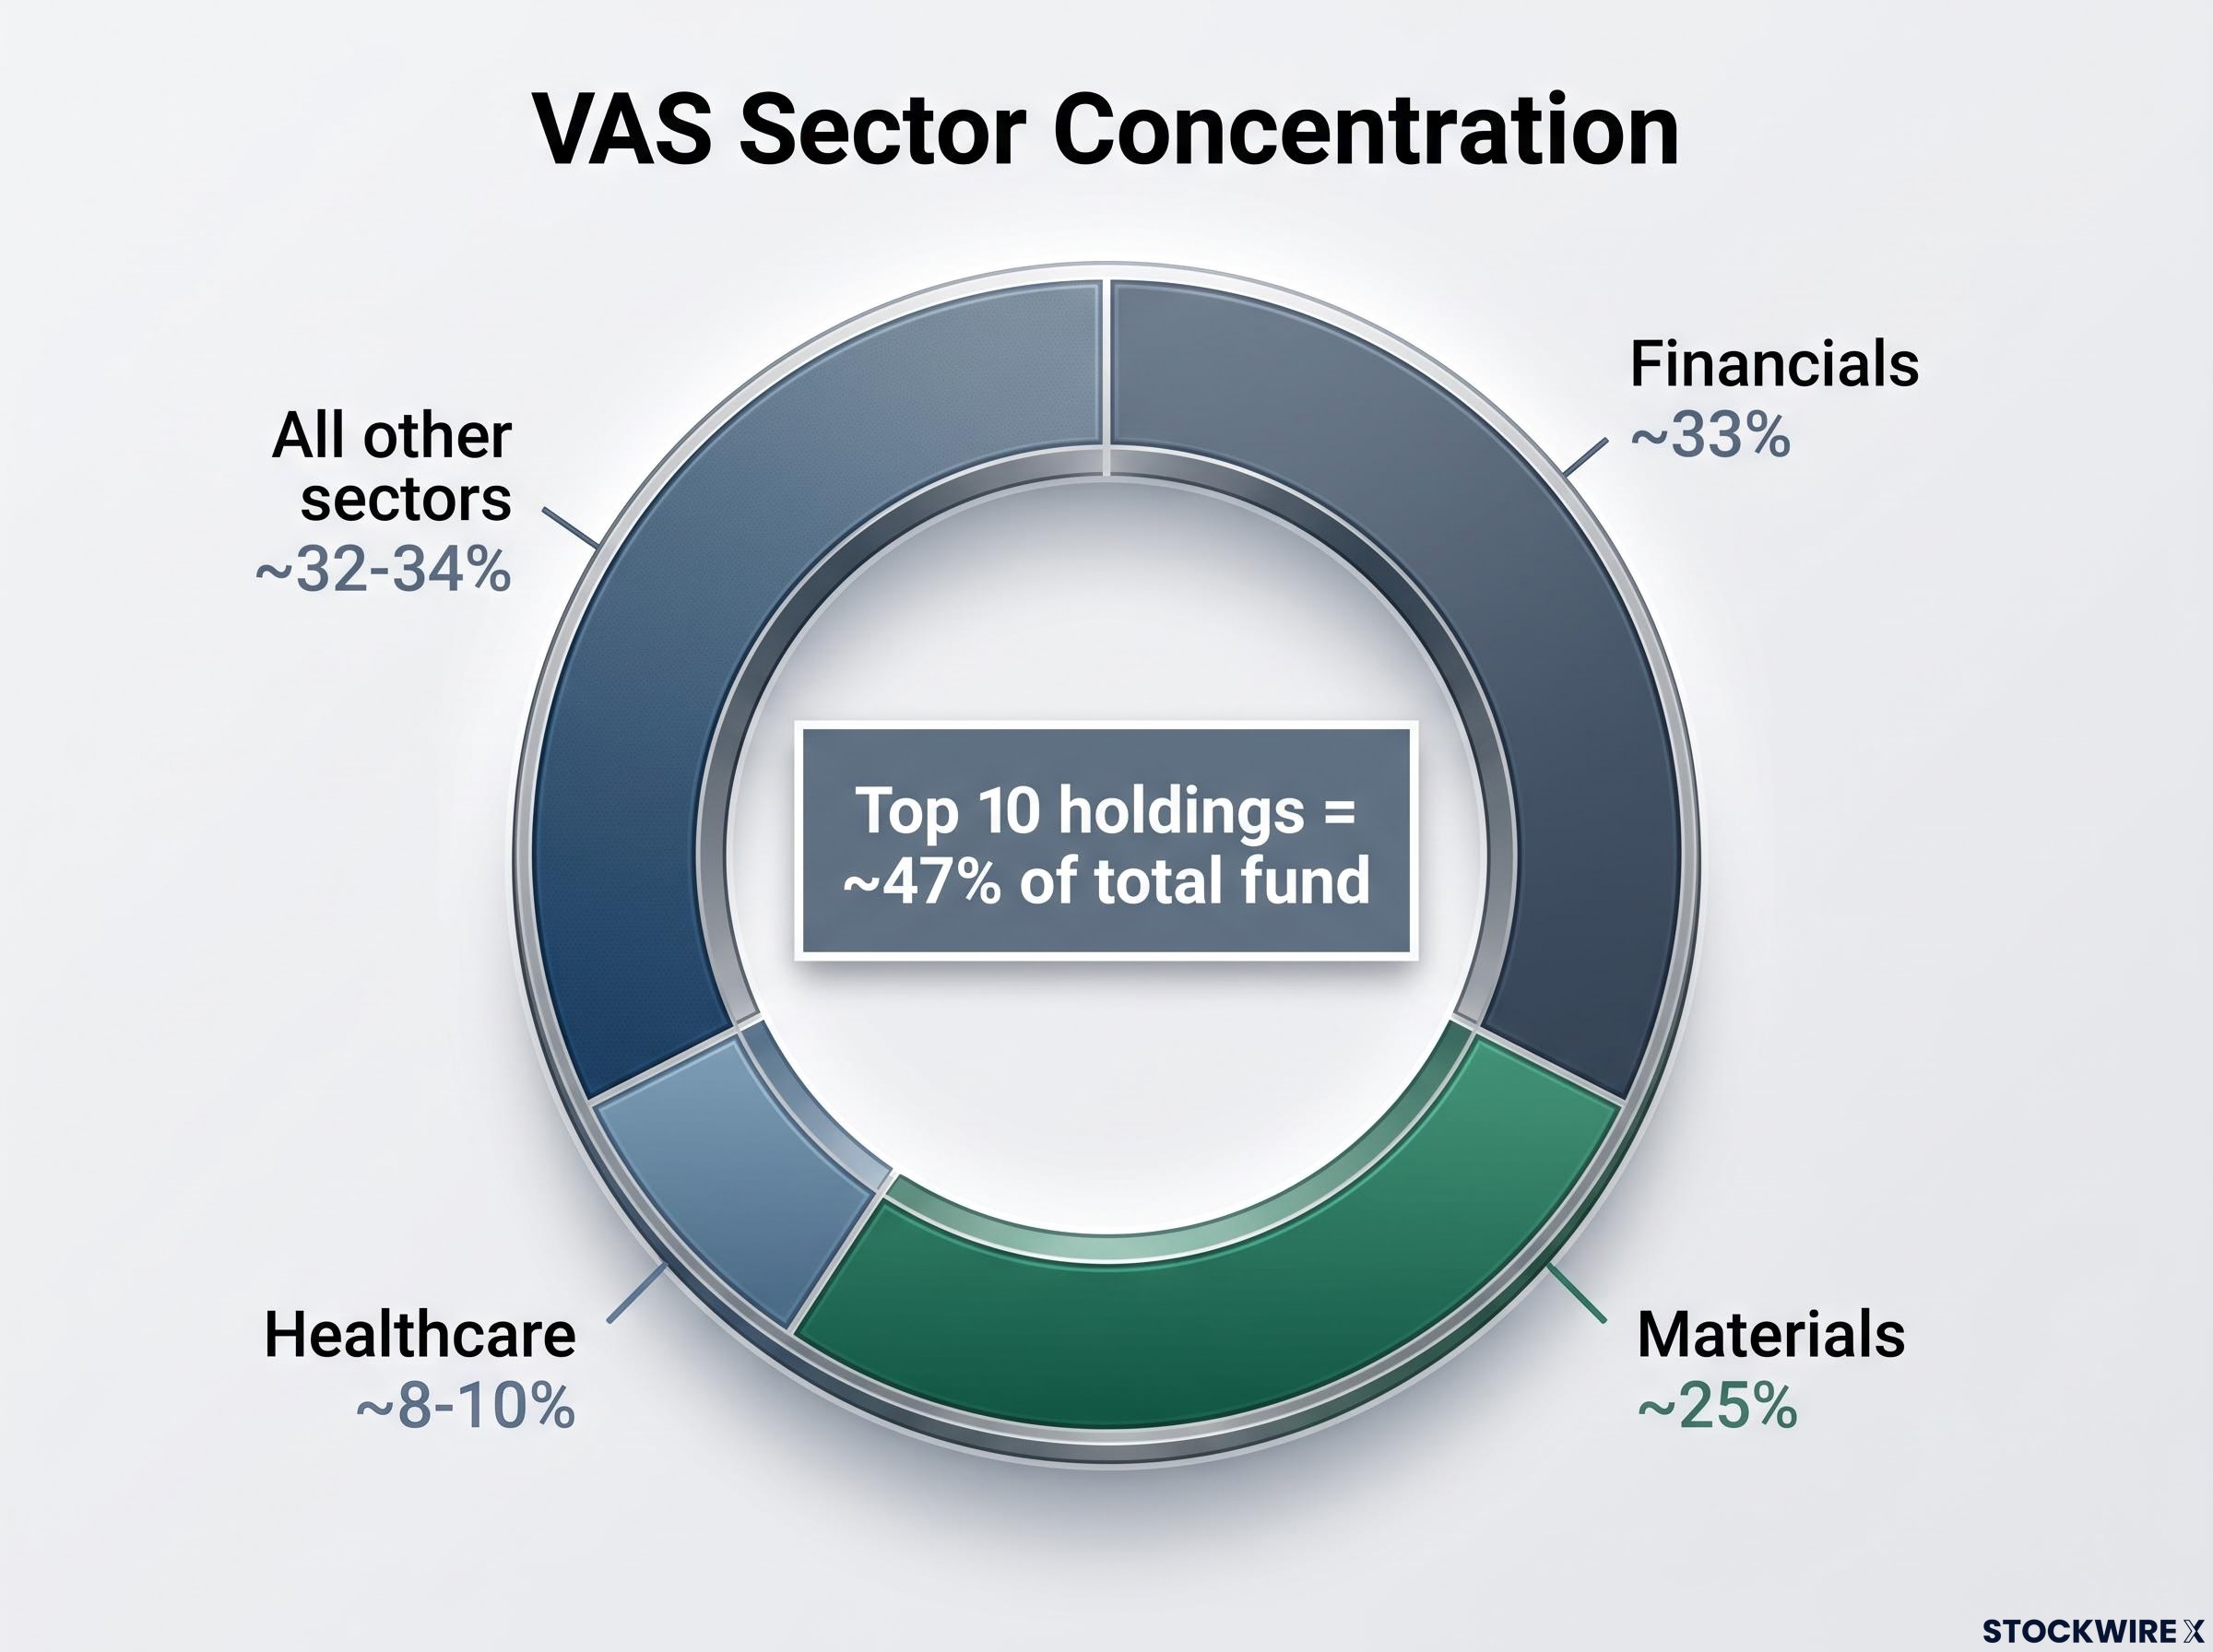
The result is a portfolio with pronounced sector concentration:
- Financials: approximately one-third of the portfolio (major banks dominate)
- Materials: approximately one-quarter (led by BHP and Rio Tinto)
- Healthcare: the third-largest sector exposure
- All other sectors: share the remaining weight
| Sector | Approximate portfolio weight |
|---|---|
| Financials | ~33% |
| Materials | ~25% |
| Healthcare | ~8-10% |
| All other sectors | ~32-34% |
VAS nominally holds more than 300 companies, reporting funds under management of $25.377 billion as at 30 June 2026. But the 300-stock count does not imply equal exposure.
Why the top 10 holdings matter more than the 300-stock count
Market-cap weighting means a small number of giant companies drive most of the return. The top 10 holdings represent approximately 47% of the total fund. A strong year from the major banks or BHP can flatter VAS’s overall result; weakness in those names creates outsized drag.
If you treat VAS as your only equity holding, you are implicitly making a large bet on Australian banks and global commodity prices. That may be the right bet for your circumstances, but it should be a conscious one rather than an accidental default.
The income dimension: dividends, franking credits, and who benefits most
Dividends contributed approximately 3.32% of the 6.16% benchmark total return in FY26. That made income the dominant return driver for the year, reflecting the Australian listed market’s structural bias toward distributing profits rather than retaining them for reinvestment.
FY26 income signal: Dividends delivered 3.32% of the year’s total return, more than the 2.84% contributed by price appreciation. VAS’s income profile carried the result.
VAS pays distributions on a quarterly schedule, and for Australian investors, the income story does not end at the headline yield. Australian company dividends frequently carry franking credits, which represent corporate tax already paid at the company level. Franking credits (also called imputation credits) can reduce or eliminate the personal income tax you owe on those dividends, depending on your individual tax circumstances.
The investor profiles who benefit most from this income structure:
- Australian tax residents in lower marginal tax brackets, where franking credits can reduce your effective tax on dividends to zero or generate a refund
- Retirees drawing on superannuation in pension phase, where franking credits may produce a direct cash refund from the Australian Taxation Office
- Long-term holders focused on income rather than capital growth, for whom VAS’s quarterly distributions provide a regular cash flow stream with tax-advantaged characteristics
For these investors, the franking credit component can lift the effective after-tax return meaningfully above the headline 6.12% figure, making VAS’s income profile more competitive than a gross return comparison alone would suggest.
VAS as a portfolio building block: where it fits and where it falls short
VAS’s core-portfolio credentials are strong. $25.377 billion in funds under management supports deep liquidity and tight bid-ask spreads. The 0.07% fee is among the lowest on the ASX. Tracking error against the benchmark is near zero. And FY26’s 6.12% net return confirmed the fund delivered almost exactly what the Australian market provided. These are the attributes of a reliable foundation.
The structural gap is equally clear. VAS is 100% Australian equities and listed property. That means zero exposure to global technology, international healthcare innovation, or the currency diversification that comes from holding assets denominated in currencies other than the Australian dollar. These have been significant performance drivers in global markets over recent cycles, and VAS’s mandate excludes all of them.
The standard construction approach addresses this directly:
- Use VAS as the Australian equity foundation, capturing domestic income, franking credits, and broad ASX exposure at minimal cost
- Pair with a global equities ETF tracking the MSCI World or All-World index to add international sector exposure and reduce concentration in financials and materials
- Consider your income needs and tax position when sizing the allocation, since VAS’s franking credit advantages apply specifically to the domestic component
Addressing home bias without abandoning domestic income advantages
The pairing strategy is not about replacing VAS. The income and franking advantages of the Australian allocation are preserved while global sector exposure is added through the international component.
The appropriate split between domestic and international equity depends on your individual circumstances, including income needs, tax position, and risk tolerance. This is a decision point where professional financial advice is directly relevant.
What FY26’s moderate result tells you about long-term passive indexing
A 6.12% net return in a below-average year is not a failure of the strategy. The long-run Australian equities average sits at approximately 9-10% per annum, making FY26 moderate but unremarkable. VAS’s 0.07% fee and near-zero tracking error mean the fund delivered almost exactly what the market provided. The strategy did precisely what it is designed to do.
The multi-year returns offer the more meaningful lens:
- 1-year net return: 6.12%
- 3-year annualised return: 10.51% per annum
- 5-year annualised return: 7.57% per annum
The long-horizon signal: VAS’s three-year annualised return of 10.51% per annum, well above the single-year FY26 figure, illustrates why evaluating a passive index strategy on any single year’s result misses the point.
The gross return of 6.19% against a benchmark of 6.16% confirms there was essentially zero active return in FY26, positive or negative. That is the deal. VAS does not promise to beat the market. It promises to deliver the market’s return at minimal cost, and the compounding effect of low fees applied consistently across full market cycles is what builds the outcome over time.
Leaning on a single year’s result to judge whether passive indexing through VAS is working is the wrong framework. The three-year and five-year figures tell you the strategy is compounding as intended. FY26’s moderate result is simply one data point within that longer sequence.
This article is for informational purposes only and should not be considered financial advice. Investors should conduct their own research and consult with financial professionals before making investment decisions. Past performance does not guarantee future results.