
Four major economies released data in the same week, and none of them delivered a clean story. The US services sector is still growing, but not quite as fast as markets hoped. Japan is lending at a healthy clip, but slightly below expectations. The eurozone matched forecasts exactly. And China posted a number that deserves more attention than the others combined.
The week of 6-10 July 2026 produced a pattern that investors encounter regularly but rarely have a clear framework for reading: a cluster of moderate, slightly underwhelming numbers that do not signal a downturn but do complicate the “steady expansion” narrative. The gap between what analysts expected and what actually printed matters, even when both figures sit on the positive side of the ledger.
Here is the practical context for each economy’s data, the framework for interpreting beats and misses, and a concrete watchlist for the releases that will either confirm or reframe this week’s picture.
How to read a beat, a miss, and an in-line print
Economic data releases are judged on two dimensions: their absolute level and how they compare to what analysts expected. A reading can sit comfortably in expansion territory and still disappoint markets if it falls short of consensus. That distinction is what moves prices.
Consensus forecast deviations drive price action more reliably than absolute data levels, a principle that applied directly to the June 2026 ISM and payroll releases, where the benchmark expectations embedded in analyst models proved as consequential as the prints themselves for bond yields and currency positioning.
The PMI-50 rule: A Purchasing Managers’ Index (PMI) reading above 50 signals expansion. Below 50 signals contraction. The further from 50 in either direction, the stronger the signal.
Here is how markets classify each outcome:
- Beat: The actual reading exceeds consensus. This tends to lift the relevant currency and equity markets because conditions are stronger than priced in.
- Miss: The actual falls short of consensus. This weighs on sentiment even when the reading remains in expansion territory, because momentum is softer than expected.
- In-line: The actual matches consensus exactly. This typically produces muted market impact and reduces uncertainty.
This week’s US and Japan data both fell into the “miss” category despite positive headline numbers. If you only read the headline, you see expansion. If you read the consensus gap, you see softening conviction. That second reading is the one that moves positioning.
When big ASX news breaks, our subscribers know first
US services sector still expanding, just not quite enough
June 2026 US Services PMI: 51.2, a four-month high, but fractionally below the 51.3 consensus forecast.
The headline looks reassuring. A four-month high in the largest sector of the world’s largest economy is, on its face, a positive development. Services activity is expanding. Businesses are hiring. Orders are coming in.
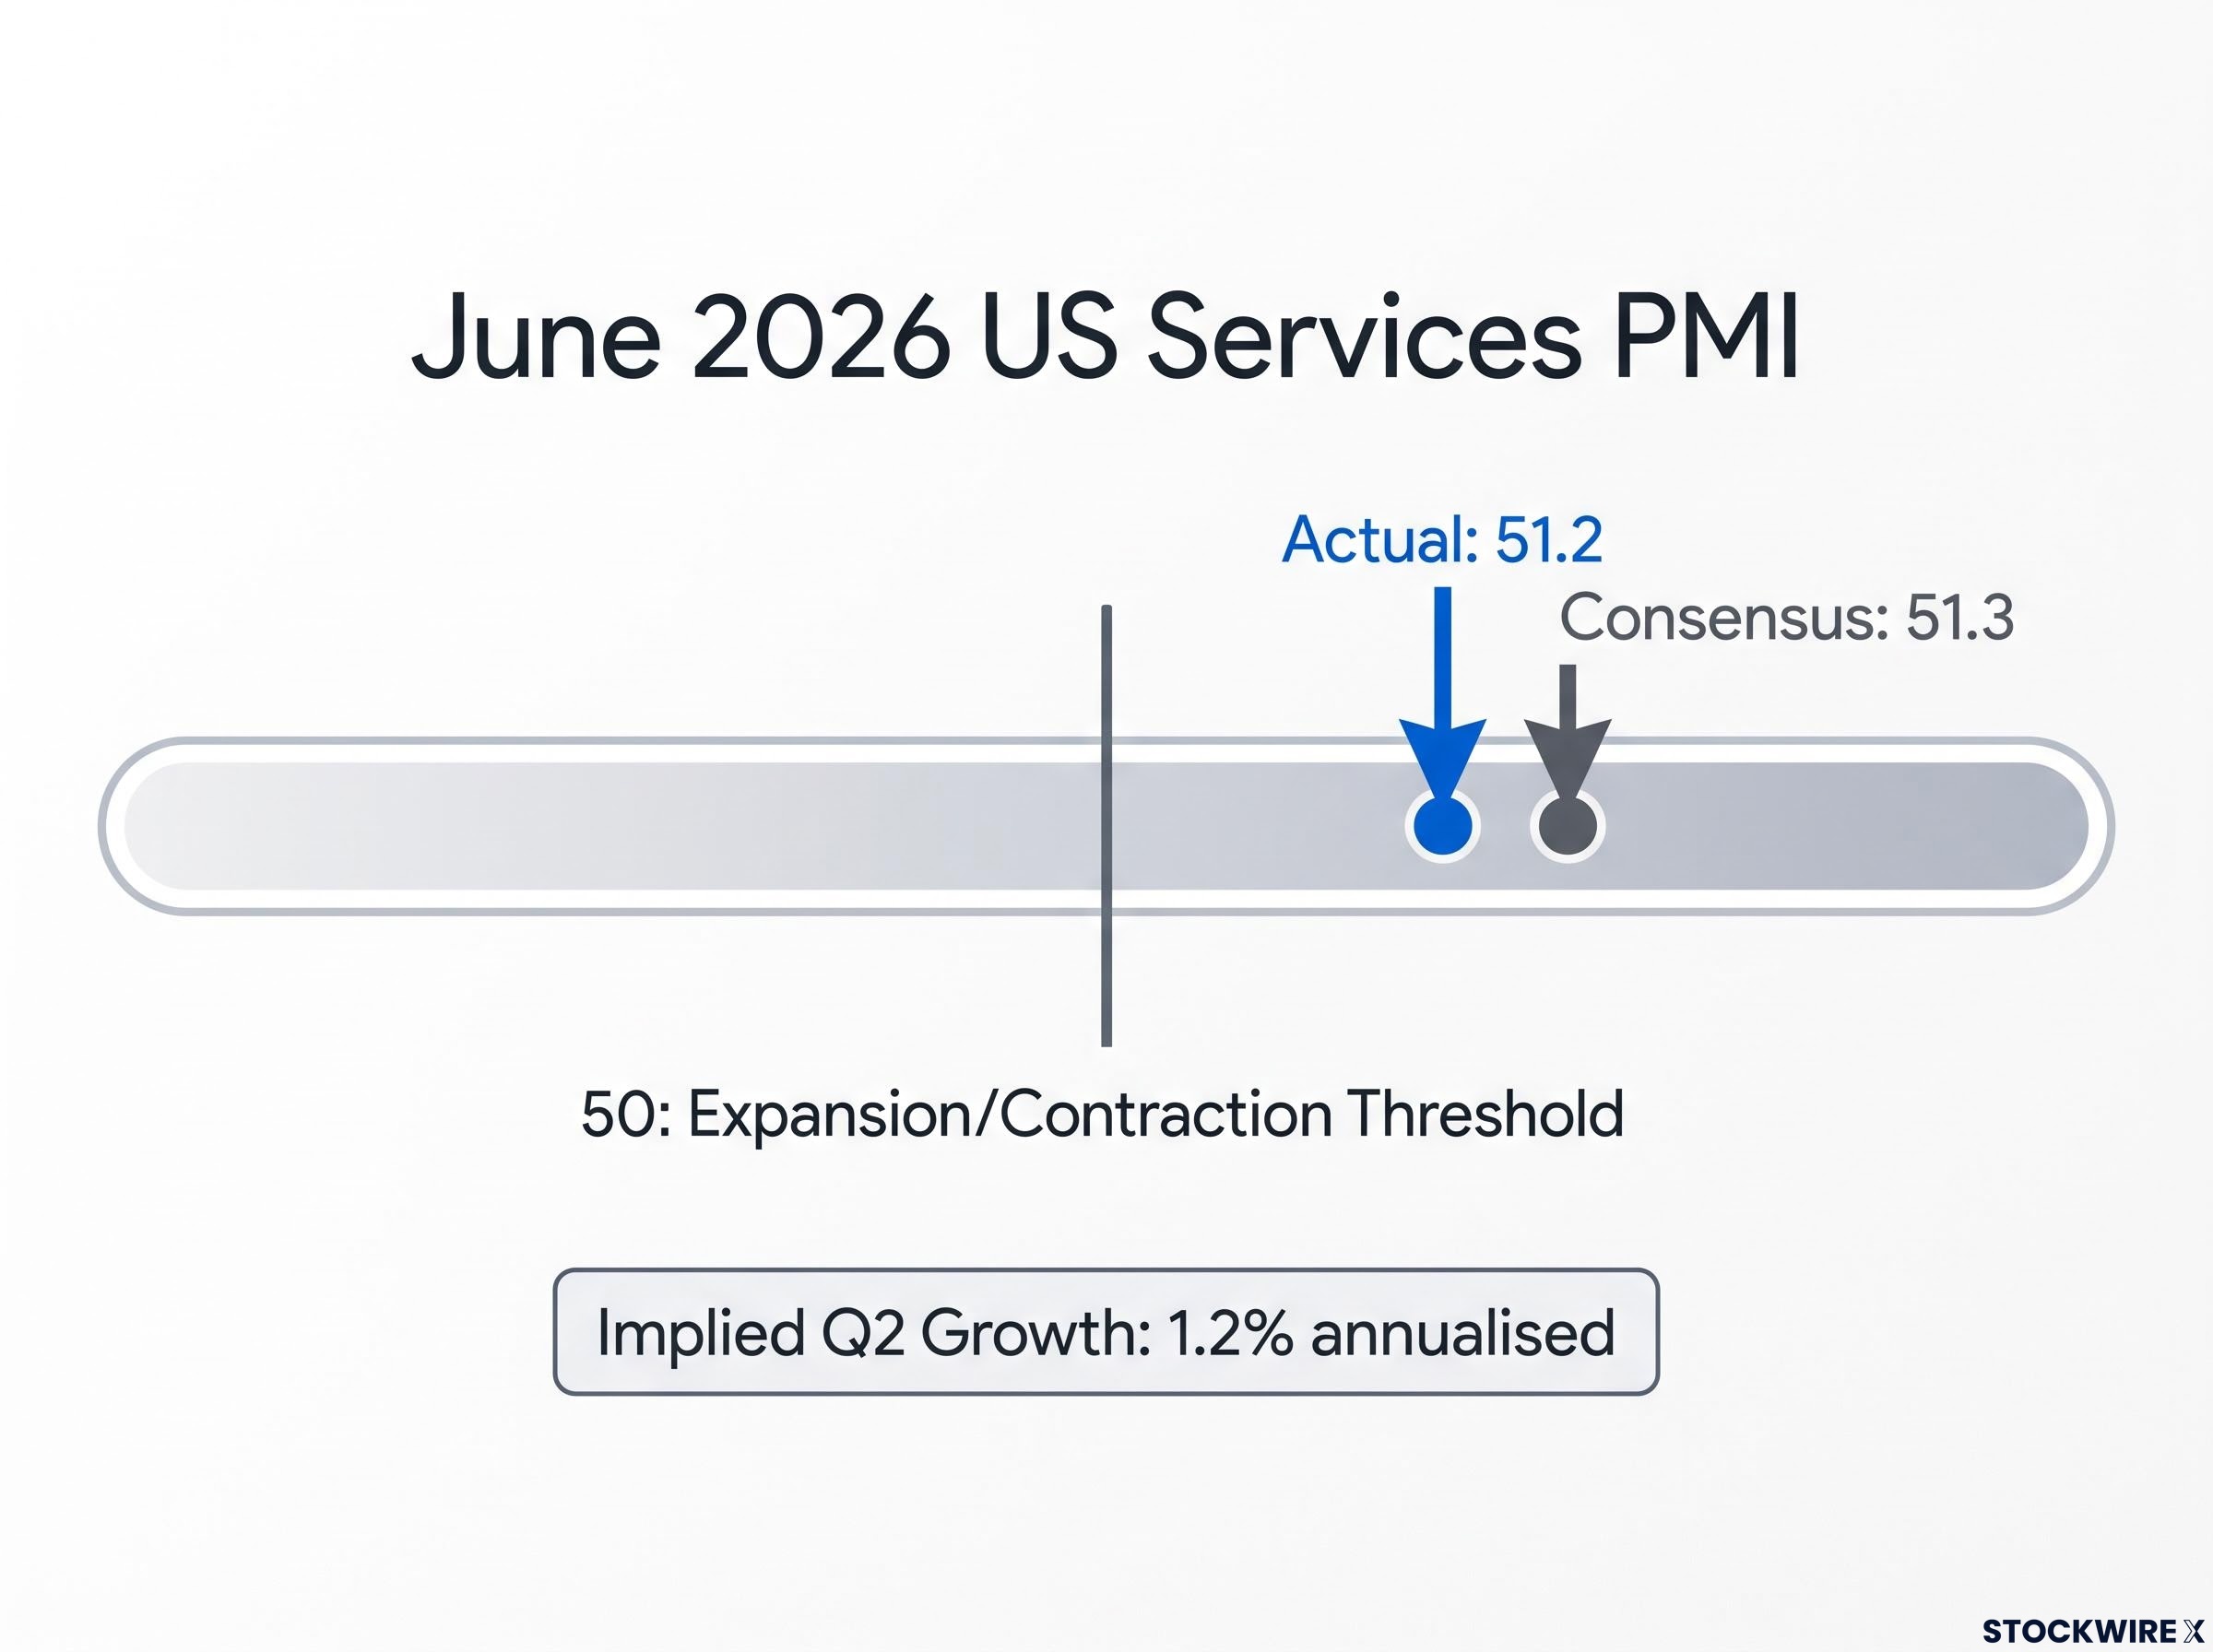
Then the detail tightens the picture. The 0.1-point miss versus consensus is small in isolation, but it extends a pattern of readings that land just below where markets need them to land to sustain bullish momentum. According to S&P Global, the June PMI pace is consistent with the US economy growing at roughly 1.2% annualised in the second quarter, a subdued rate by historical standards.
Elevated price pressures within the services sector, combined with evidence of customer pushback on high prices, suggest that inflation-sensitive consumers are constraining the growth rate from below. For investors watching the Federal Reserve, a 1.2% growth pace is not strong enough to push the Fed toward tightening, which means this print lends modest support to expectations that rates stay on hold rather than moving in either direction.
Inflation signals across US services and eurozone retail data sit in a context established by the June 2026 US CPI release, where a 1.3 percentage-point gap between headline and core CPI indicated an energy-driven uptick rather than a demand-fuelled spiral, a distinction that shapes how the Federal Reserve is likely to weight this week’s services PMI miss.
Eurozone retail sales land exactly on target
In a week of slight disappointments elsewhere, the eurozone delivered something different: stability.
- May 2026 eurozone retail sales: 0.2% month-over-month growth.
- Year-over-year: 1.6% gain.
Both figures matched consensus estimates exactly, according to Eurostat data. No surprise in either direction.
An in-line result generates no headline, but it carries genuine informational value. Household spending across the eurozone has held up despite the energy and inflation shocks of recent years. That is not a given; it is an outcome worth recognising.
For investors holding European equities or tracking the euro, this print removes a downside risk without adding new upside. It tells you that eurozone consumer demand is neither recovering sharply nor rolling over, which keeps the European Central Bank’s (ECB) options open ahead of the inflation data due this week. Stability at this stage of the eurozone’s cycle is itself a form of positive news.
Japan’s credit growth signals normalisation, not overheating
Japan’s June 2026 bank lending grew 5.7% year-over-year, a historically healthy rate for an economy long defined by near-zero credit demand.
For context, Japan spent decades in a monetary regime where borrowing was essentially free and credit growth was anaemic. A 5.7% lending rate signals genuine confidence among businesses and households in future income and investment. That is a meaningful shift.
The slight miss against the expected 5.8% is not alarming in isolation. It is a yellow flag, not a red one. But it introduces a question worth monitoring: as the Bank of Japan (BoJ) continues its gradual policy normalisation, at what point do tighter conditions begin to constrain the very credit growth that signals the normalisation is working?
Japan’s shift away from ultra-loose monetary policy is one of the most significant structural changes in global fixed income markets right now. If you have exposure to Japanese equities or bonds, lending data is an early indicator of whether that transition is proceeding smoothly or generating unexpected friction. This print says “proceeding,” but the margin for error narrowed by a tenth of a percentage point.
China’s CPI is the week’s most important data point
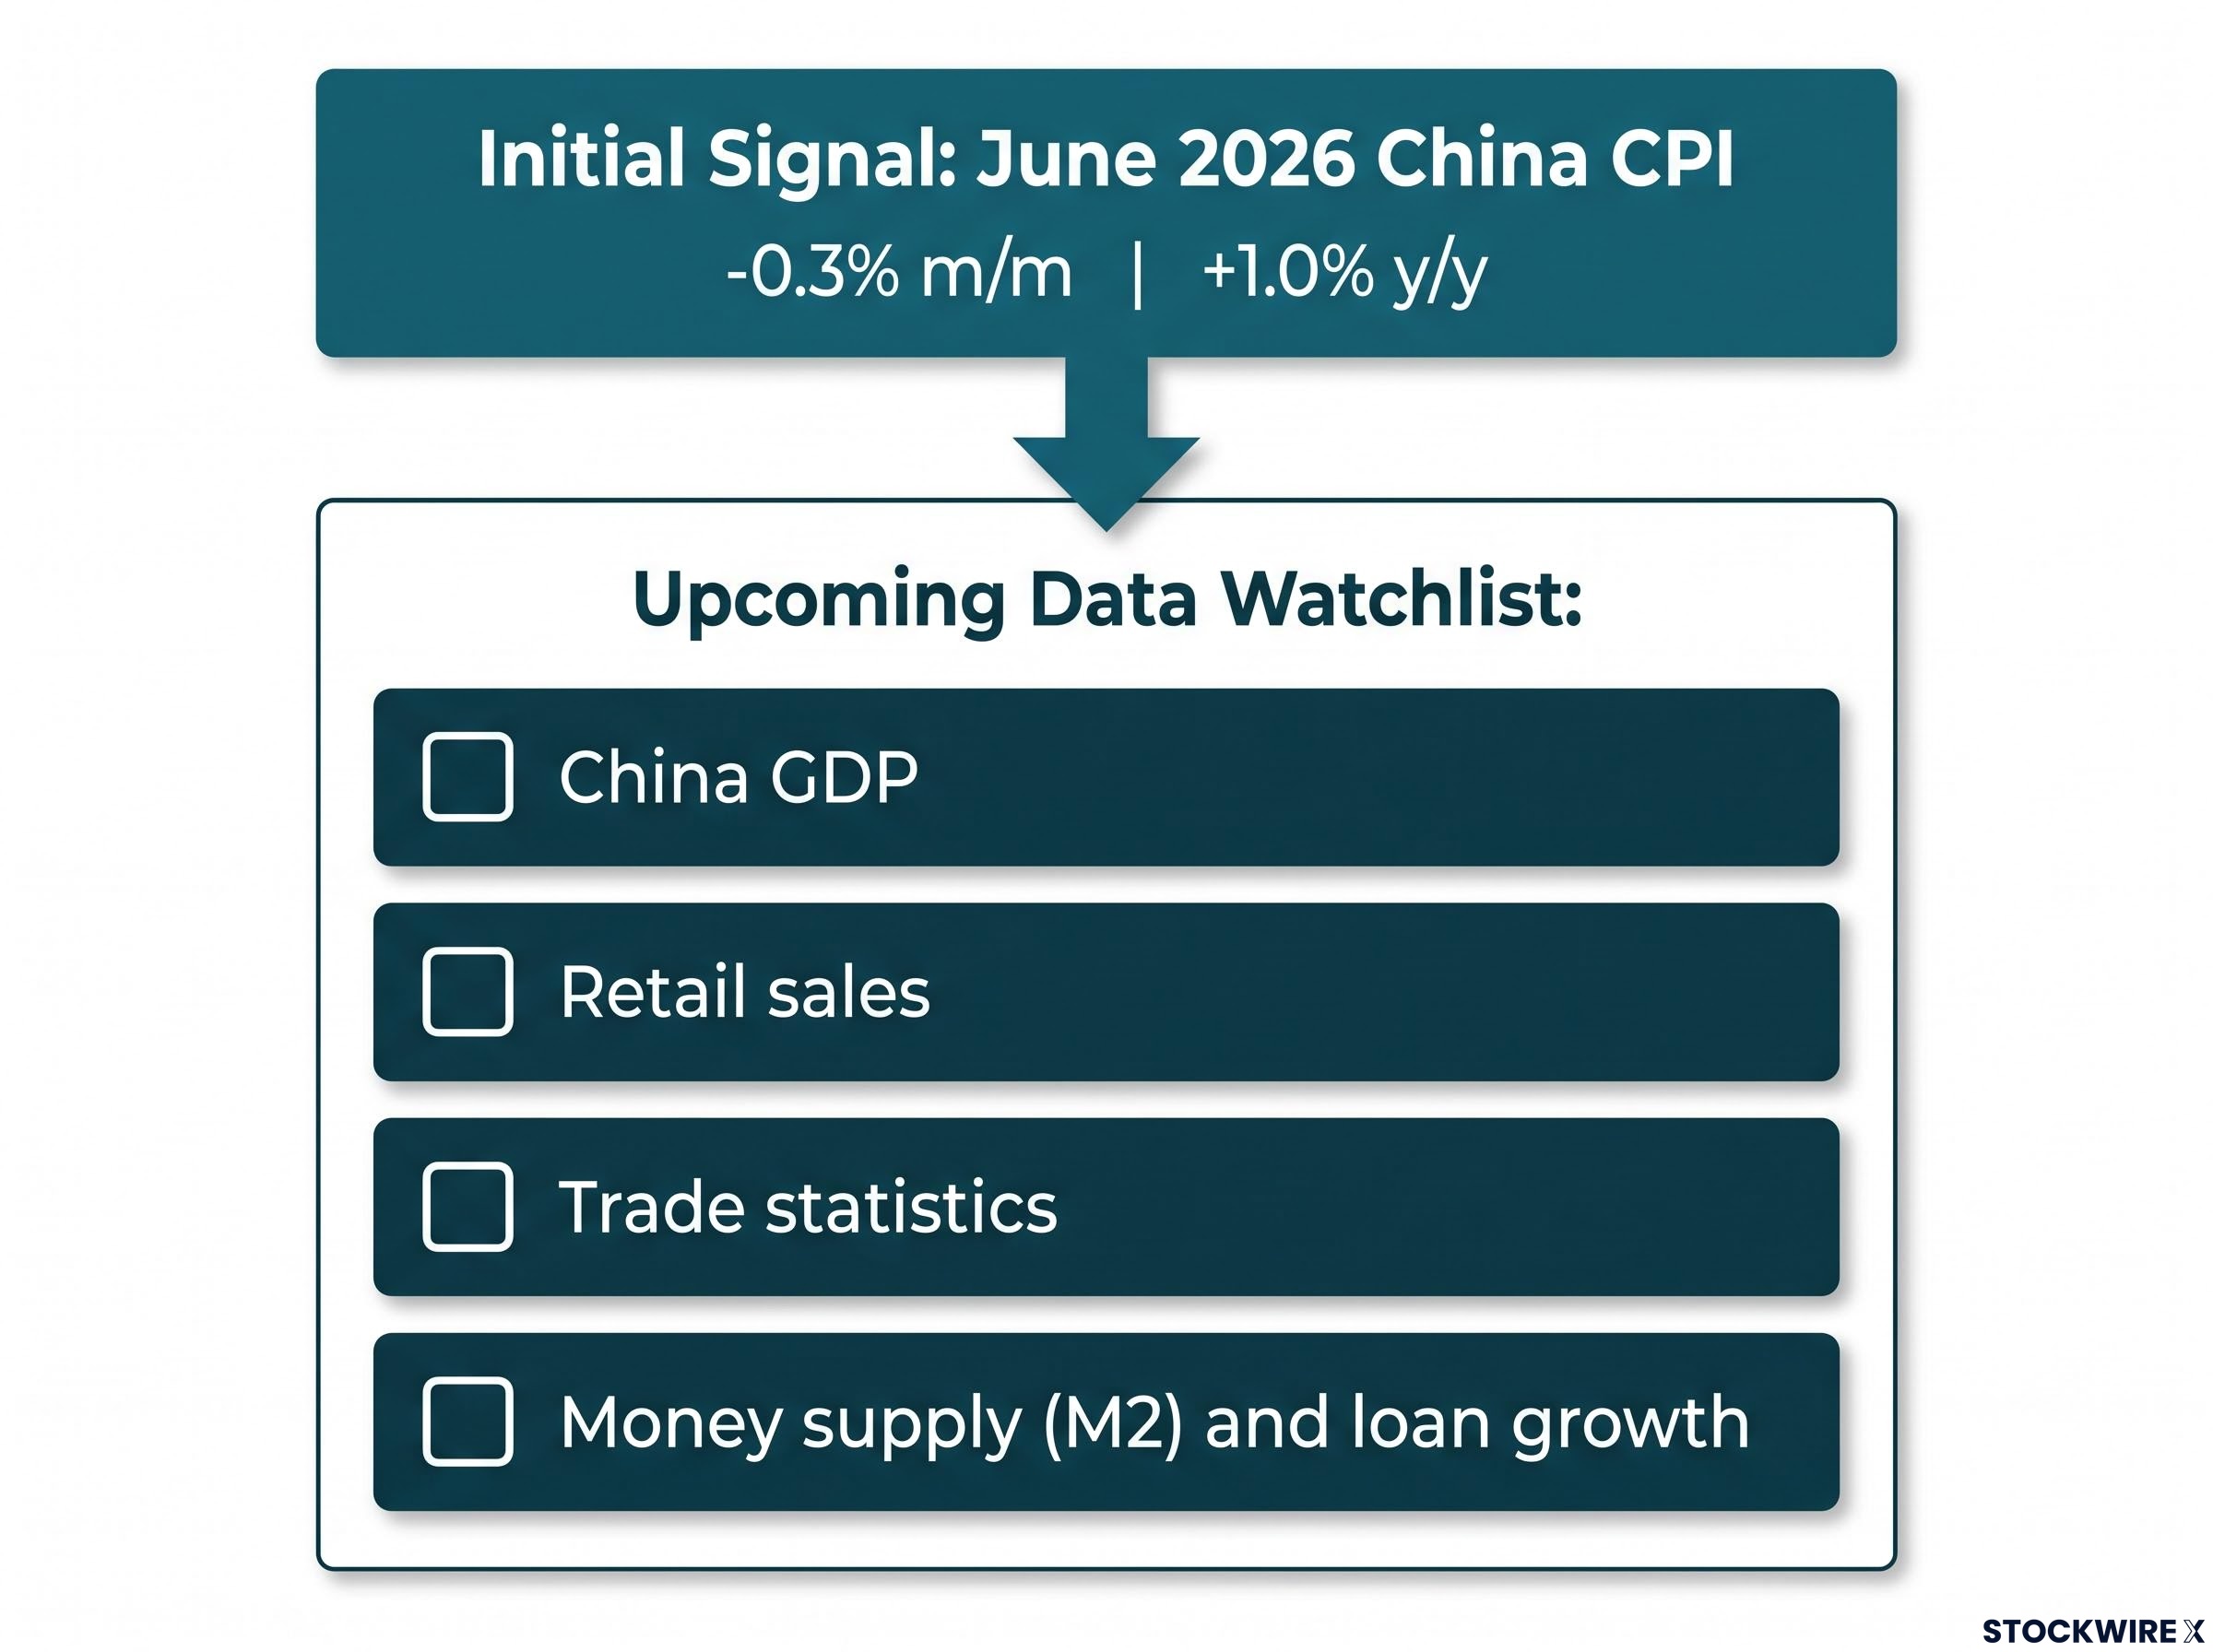
China’s June 2026 consumer price index (CPI), which measures the change in prices consumers pay for goods and services, told a more complicated story than the other three economies:
- Month-over-month: -0.3%, a small but notable price decline.
- Year-over-year: +1.0%, positive but low by any standard.
The monthly decline matters more than the annual figure here. In China’s current context, falling prices are driven by soft consumer demand rather than benign supply-side improvements like cheaper inputs or greater efficiency. That distinction is the difference between healthy deflation and a warning sign.
The -0.3% monthly CPI is not a headline catastrophe, but for investors with exposure to China, broader Asian equities, or commodities, it is an early signal that the demand recovery many policy scenarios are banking on may be stalling.
The following data releases, all due this week and next, will confirm or contradict that signal:
- China GDP: The broadest measure of whether growth is stabilising or decelerating.
- Retail sales: A direct read on whether consumers are spending.
- Trade statistics: Shows external demand and export competitiveness.
- Money supply (M2) and loan growth: Reveals whether financial channels are expanding enough to counter deflationary pressure.
China’s demand trajectory affects commodity prices, supply chains, and Asian growth broadly. This is the single data point from last week most likely to have cross-asset implications if confirmed by the GDP and retail figures landing now.
The week’s data at a glance: what the pattern says
| Economy | Release | Actual | Classification |
|---|---|---|---|
| US | Services PMI (June) | 51.2 vs. 51.3 forecast | Mild miss |
| Eurozone | Retail Sales (May) | 0.2% m/m, 1.6% y/y | In-line |
| Japan | Bank Lending (June) | 5.7% y/y vs. ~5.8% expected | Mild miss |
| China | CPI (June) | -0.3% m/m, +1.0% y/y | Underlying softness |
Three of four economies posted readings that were either fractionally below expectations or exactly in line. China stands apart as a qualitatively different concern. The collective signal is slightly moderating momentum, not a decisive break. Expansion continues, but it is losing some of its margin.
Central bank policy divergence adds a second layer to the week’s mild misses: the Fed holding at 3.50-3.75%, the ECB navigating near-stagnant growth with elevated inflation, and the Bank of Japan tightening faster than anticipated each translate the same modest data shortfall into distinct rate and currency outcomes across the three economies.
That means portfolio decisions should be driven by the GDP and inflation data arriving this week rather than last week’s readings alone. The pattern tells you where to look next; it does not tell you to act now.
The next major ASX story will hit our subscribers first
What the coming week’s data will settle
Last week’s mild misses set the stage. This week’s releases will determine whether that softness is a trend or a blip. Here is what to watch, grouped by the question each cluster answers:
- Growth figures for the UK and China: Is growth stabilising or reflecting a broader demand slowdown? China’s GDP print is the single highest-stakes release of the week given last week’s CPI signal.
- June price data across the US and eurozone: Where do the Fed and ECB sit on rates? These prints directly affect bond yields and equity valuations across both regions.
- Factory output across the US, UK, eurozone, Japan, and China: A rare simultaneous global manufacturing snapshot. Manufacturing has lagged services for months; investors will look for signs of bottoming.
- Consumer spending figures from the US, Japan, and China: Are consumers holding up? Each economy faces distinct pressures, and this data tests whether household spending is absorbing or buckling under them.
- China’s external trade figures, broad money supply, and credit growth: Together, these show whether China’s financial and trade channels are expanding enough to counter the deflationary pressure flagged by last week’s CPI.
For investors, this is where last week’s mild misses either get confirmed as a trend or get revised away by stronger prints. The direction of these releases will do more to shape positioning than anything that landed in the 6-10 July window.
The story this data is still writing
The global economic picture coming out of the first full week of July is moderate expansion with pockets of softening, not a crisis. The US and Japan are growing, just a fraction below expectations. The eurozone is stable. None of that warrants alarm.
China is the exception. The -0.3% monthly CPI print is the week’s clearest risk signal, and the GDP and retail sales data arriving now will determine whether that softness deepens into something that reprices commodity and Asian equity exposure more broadly.
The appropriate stance is proportional: hold last week’s information as context, weight the GDP and inflation releases heavily, and resist overreacting to week-to-week noise. The data is still accumulating. The story is still being written.
For readers wanting to stress-test the moderate expansion narrative against a more adverse scenario, our full explainer on global recession risk buffers examines the seven structural factors BCA Research identified as containing recession probability, and when those buffers begin to expire.
This article is for informational purposes only and should not be considered financial advice. Investors should conduct their own research and consult with financial professionals before making investment decisions.
—