Three headlines landed within hours of each other on 16 July 2026, and all three pointed in the same direction: tighter financial conditions ahead. US military strikes against Iran triggered retaliatory threats around the Strait of Hormuz. Dallas Fed President Lorie Logan called for a rate increase despite softer inflation data. Copper slid while crude climbed. These were not coincidences. They were a single macro chain reaction.
Markets sold off across all three major indices on Thursday, with the NASDAQ bearing the sharpest losses at 1.5%. But the pattern of who fell, how much, and what moved in the other direction tells a more specific story than the headline numbers suggest. The gap between the Dow’s 0.2% decline and the NASDAQ’s 1.5% drop is not noise. It is a map of where rate sensitivity and geopolitical risk concentrate in equity portfolios.
Here is the framework for reading the next round of oil, Fed, and yield curve headlines so you are not caught off-guard when the same variables move again. This is contextual intelligence, not prediction.
How oil became a monetary policy problem overnight
The chain starts at a single physical chokepoint.
Approximately 20% of global seaborne oil passes through the Strait of Hormuz, making any disruption structurally significant rather than speculative.
The Strait of Hormuz supply gap created by the effective closure of Hormuz transit cannot be bridged by existing bypass pipeline infrastructure, including Saudi Arabia’s East-West Pipeline and the UAE’s ADCOP system, which together fall well short of replacing the nearly 11 million barrels per day removed from global markets during peak disruption.
Ongoing US strikes against Iran brought retaliatory action from Tehran, and the resulting threat to Hormuz transit pushed crude prices sharply higher on 16 July:
- WTI Crude Oil futures: $79.69, up +0.94%
- Brent Oil futures: $84.89, up +0.78%
- Natural Gas futures: $2.872, down -0.76% (a divergence worth noting: gas is not tied to Hormuz transit the same way crude is)
The distinction matters enormously. This is not oil rising because the global economy is consuming more. It is oil rising because physical supply is at risk, and that is a fundamentally different policy problem. Supply-driven oil inflation is the worst kind for equity investors because the Fed cannot fix a physical disruption by raising rates, yet it still feeds headline CPI numbers that give hawkish officials political cover to tighten anyway.
That dynamic is exactly what played out in the Fed’s messaging on the same day.
When big ASX news breaks, our subscribers know first
What Lorie Logan’s rate call actually signals about Fed thinking
June 2026 CPI came in softer than expected, and markets initially interpreted that print as evidence that rate cuts were the likely next move. For a few days, the dovish narrative had momentum.
Then Dallas Fed President Lorie Logan put forward the case for lifting rates somewhat, framing it as necessary to achieve a better balance across the central bank’s economic objectives and risk profile. Her specific concern centred on the threat of inflation overshooting due to energy prices she expected to remain elevated in the months ahead. In effect, she told markets: one good CPI print does not remove forward-looking inflation risk.
The Fed’s frozen rate policy through five consecutive holds at 3.50%-3.75% set the stage for exactly the interpretive tension Logan’s call introduced: markets had built dovish expectations into valuations, and any hawkish signal now carries disproportionate repricing force relative to the signal’s actual policy weight.
That is a direct contradiction of the market’s dovish CPI interpretation, and it reshapes how you should weigh upcoming Fed communications.
What this means for the rate cut timeline
Logan is one official, not the committee. Whether other Fed voices echo or contradict her call is the critical watchpoint. But her signal tells you something important about the Fed’s reaction function: if officials are looking through softer current CPI toward forward energy inflation risk, one good print will not be enough to unlock rate cuts. For anyone building positions around a dovish pivot, the timing risk just widened.
Reading the yield curve’s mixed message
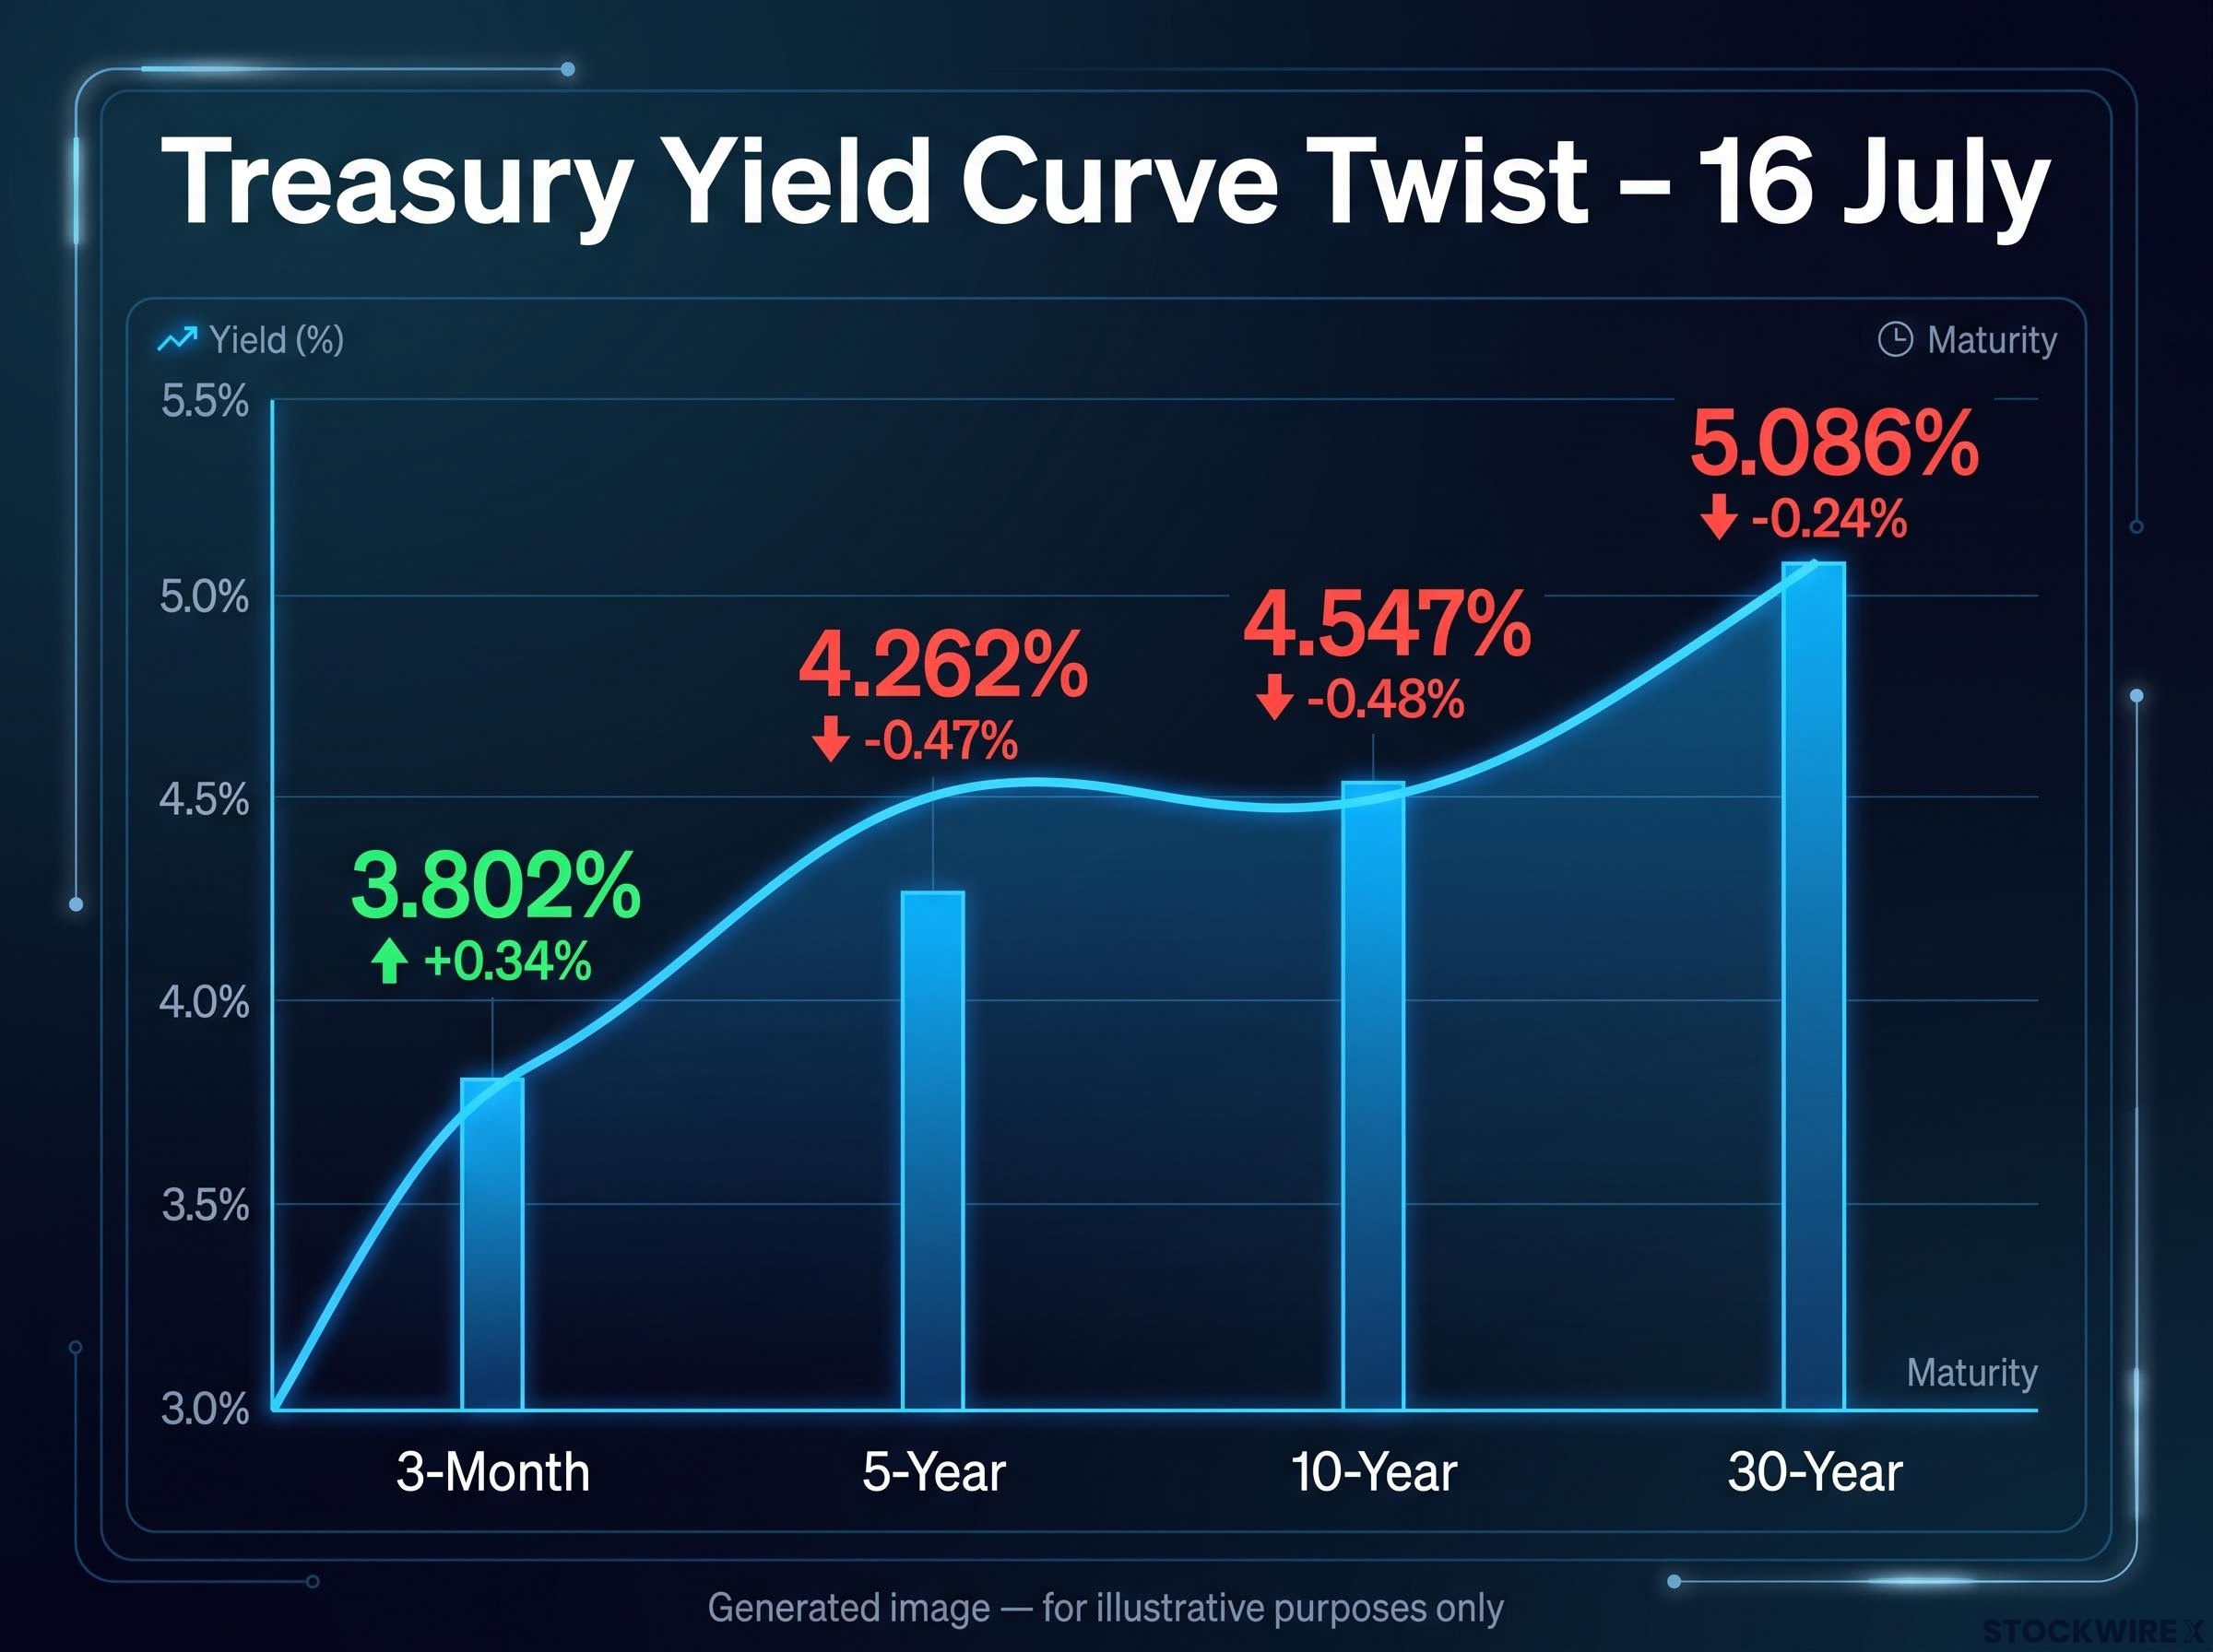
The Treasury market on 16 July sent a signal that is uncomfortable to sit with but important to understand.
| Treasury maturity | Yield level | Daily change |
|---|---|---|
| 3-Month | 3.802% | +0.34% |
| 5-Year | 4.262% | -0.47% |
| 10-Year | 4.547% | -0.48% |
| 30-Year | 5.086% | -0.24% |
The pattern is a curve twist. Longer yields fell, reflecting slower-growth expectations as bond investors priced in the economic drag from a potential supply shock. The short end rose, reflecting residual probability that the Fed tightens near-term despite that growth headwind.
Yield curve mechanics explain why the short end and long end respond to different forces simultaneously: the short end prices near-term central bank action while the long end encodes growth and inflation expectations over a multi-year horizon, which is precisely why a curve twist, short yields rising while long yields fall, signals a policy-error pricing rather than a simple risk-off move.
Two forward scenarios flow from here, and each carries different equity implications. If short rates keep rising while long yields fall, markets are doubling down on a policy-error narrative: the Fed tightens into weakness. If both rise together, persistent inflation expectations are becoming entrenched, which is more broadly negative for equities and credit. Professional bond investors are not buying the soft-landing narrative. They are pricing the possibility that the Fed tightens into economic weakness, the scenario that tends to do the most damage to equity valuations.
Why the commodity complex is flashing a stagflationary warning
Stagflation is a combination of slowing economic growth and persistent or rising inflation. It puts central banks in an impossible position because the tools to fight one, raising rates to cool inflation, typically worsen the other by further suppressing growth. It is rare, and it is the macro regime equity valuations handle worst.
The 16 July commodity data collectively builds that picture:
| Commodity | Price | Daily change |
|---|---|---|
| Gold | $3,993.25 | +0.03% |
| Silver | $55.55 | -1.13% |
| Copper | $6.251 | -0.50% |
| WTI Crude Oil | $79.69 | +0.94% |
VIX rose 6.76% to 16.73, confirming broad macro repricing rather than stock-specific selling.
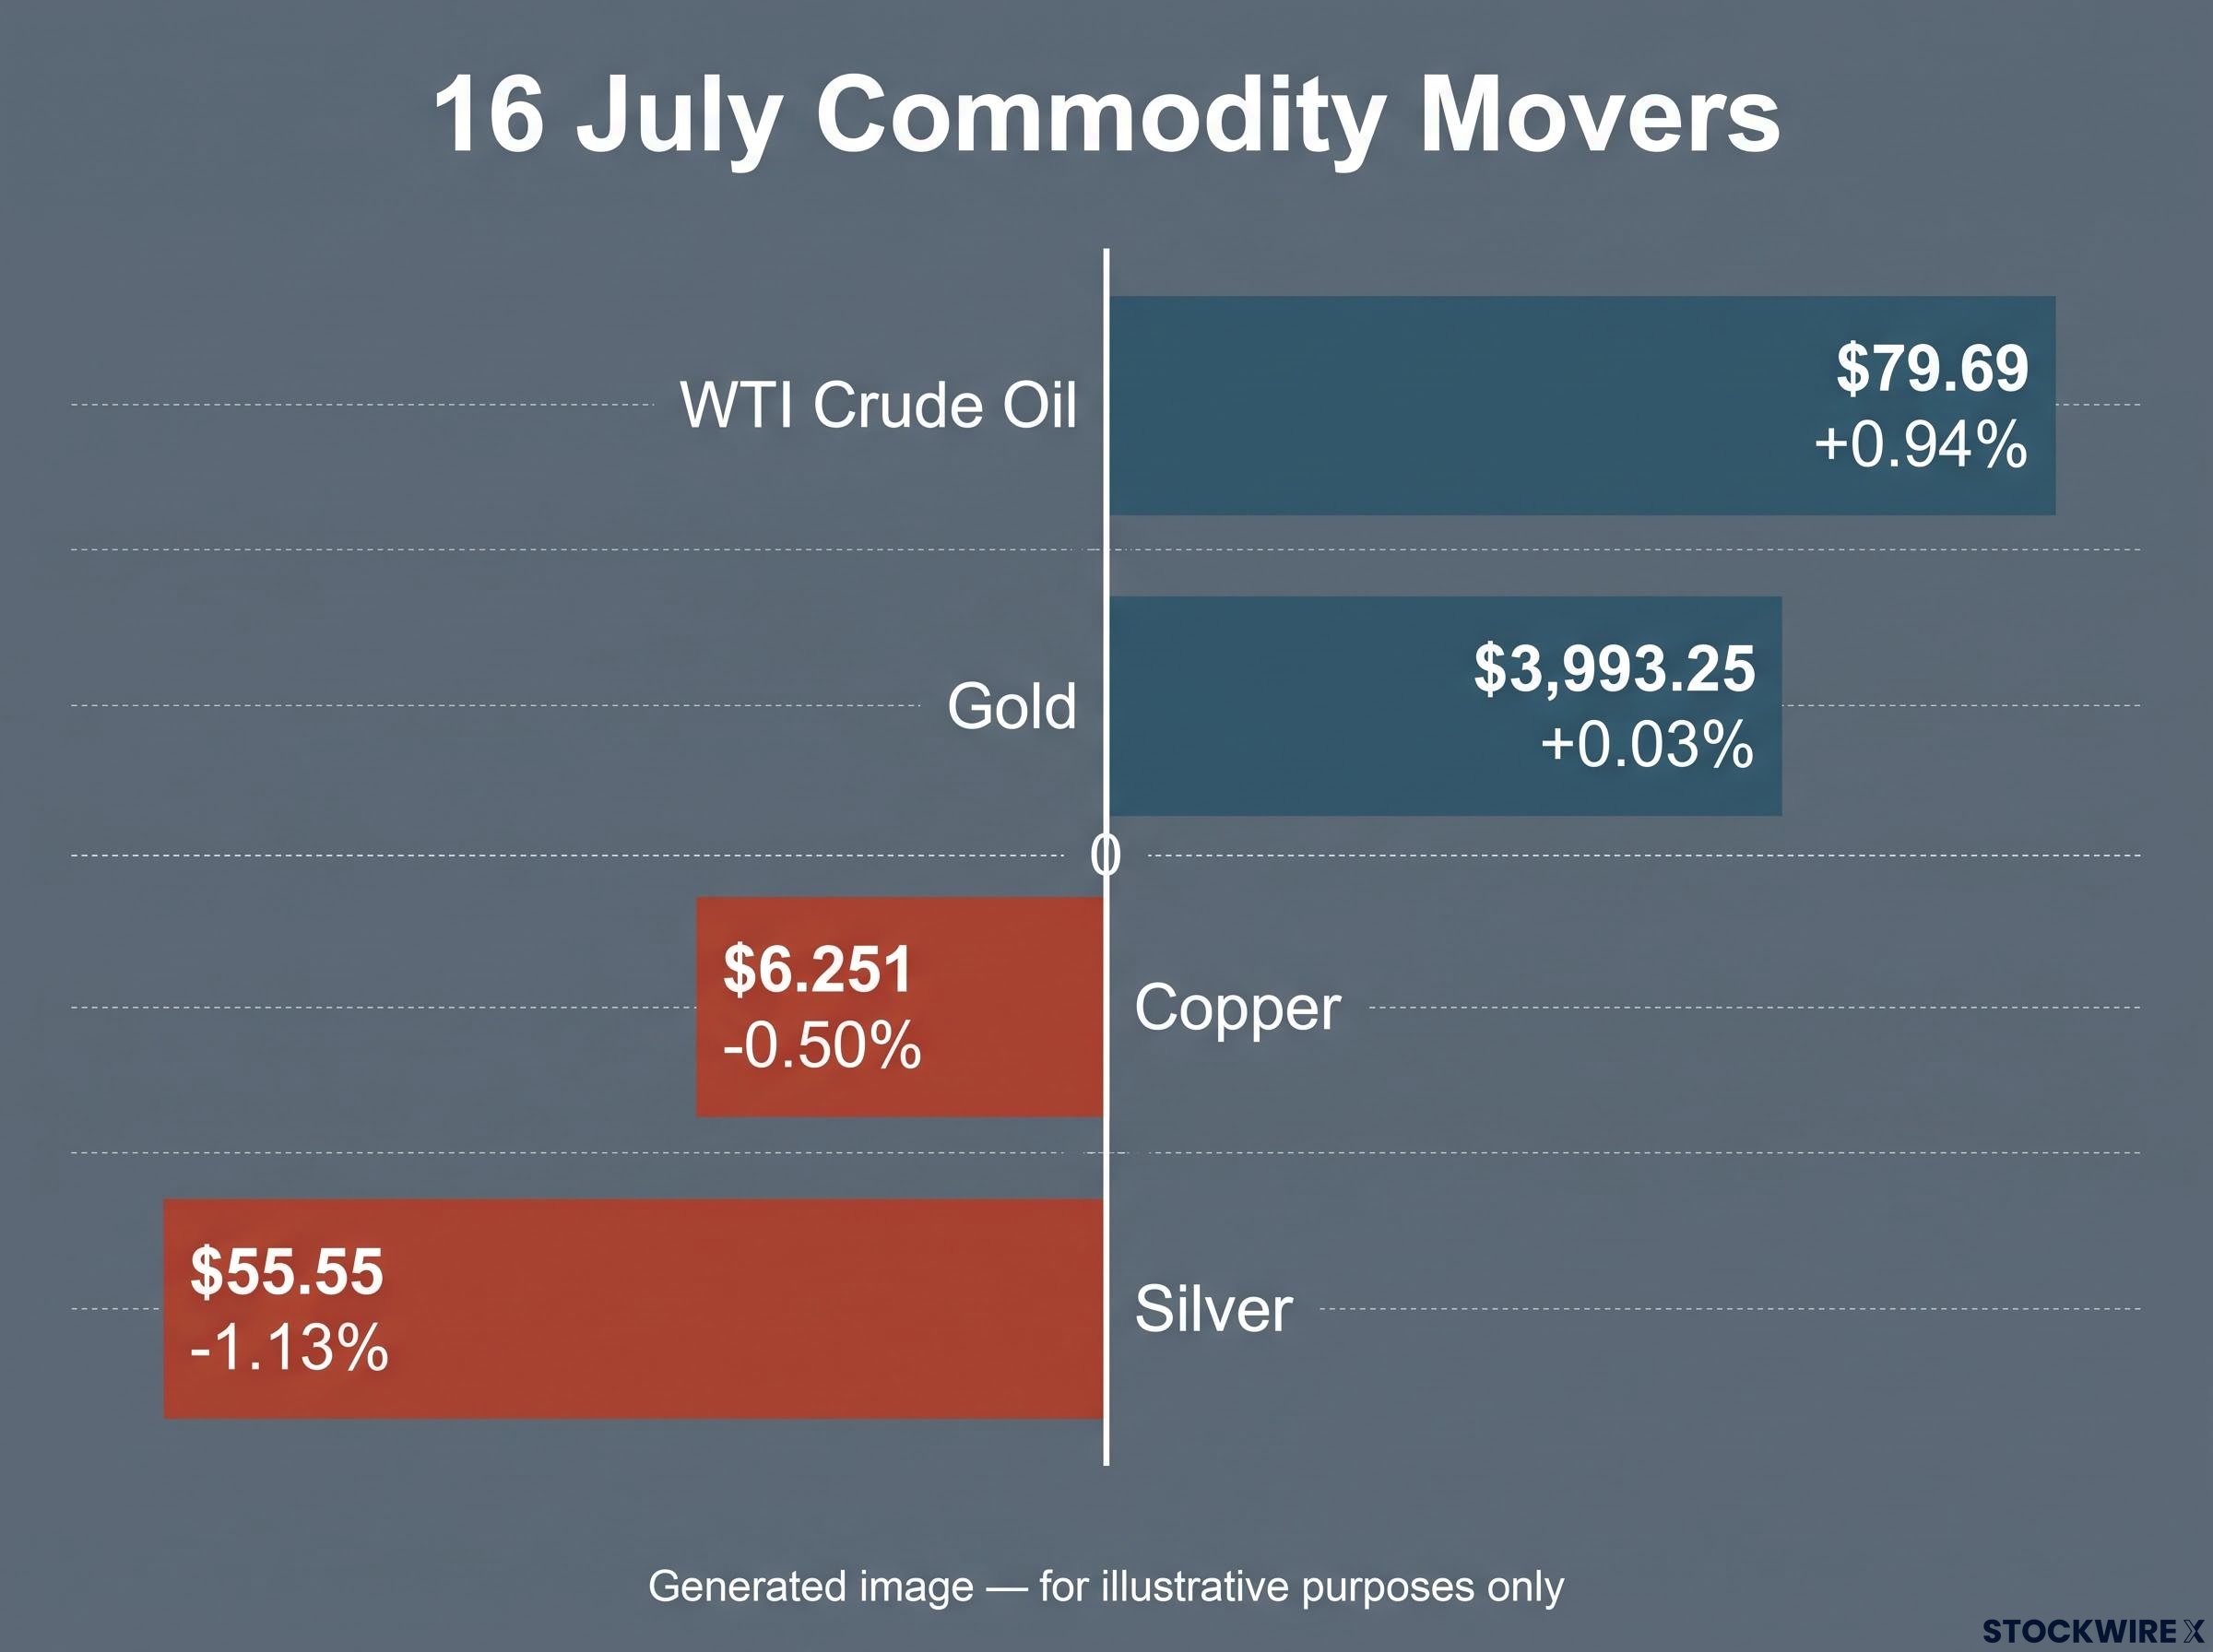
Copper down and oil up on the same day, for different reasons, is one of the clearest real-time diagnostic signals that the macro regime is shifting toward stagflationary conditions. Oil is rising on supply disruption. Copper is falling on weaker demand expectations. Gold’s near-flatness at $3,993 suggests geopolitical risk was already priced into the safe-haven bid, meaning there was no fresh panic premium being added on Thursday.
What stagflation means for the Fed’s options
Monetary policy tightening can suppress demand-driven inflation but cannot resolve a physical supply disruption. If the Fed tightens in this environment, it risks slowing growth without meaningfully reducing energy prices. That is the policy mistake scenario the yield curve was already pricing on 16 July.
Where equities absorbed the blow and why the pattern matters
The index-level numbers from Thursday’s regular session tell part of the story. The after-hours futures session completes it.
| Index | Regular session move | Futures move (as of 21:51 ET) |
|---|---|---|
| NASDAQ Composite / Nasdaq 100 Futures | -1.5% | -0.9% (28,961.25 pts) |
| S&P 500 / S&P 500 Futures | -0.5% | -0.5% (7,537.0 pts) |
| Dow Jones / Dow Jones Futures | -0.2% | -0.5% (52,518.0 pts) |
The NASDAQ’s 1.5% decline versus the Dow’s 0.2% reflects sector composition, not sentiment noise. Tech is more sensitive to both higher discount rates and geopolitical export-control risk. The Nasdaq 100 Futures underperformance at -0.9% in the evening session confirmed the macro thesis was not resolved by the close, and that investors were specifically identifying tech as the risk transmission channel.
That after-hours pressure had an additional catalyst. President Trump claimed that China had collected sensitive American voter information and had been working to influence US elections, layering a fresh geopolitical concern on top of the pressures that had already weighed on the regular session. For tech and semiconductor stocks, which depend on cross-border supply chains and sit in the crosshairs of export controls, that accusation intensified sector-specific anxiety. The gap between NASDAQ performance and Dow performance on a day like this is a direct read on how much of the current macro risk is concentrated in rate-sensitive, geopolitically-exposed growth assets.
The next major ASX story will hit our subscribers first
Three variables that will determine whether 16 July was a floor or a warning
The answer will not come from daily index levels. It will come from three specific signals:
- Strait of Hormuz headline flow. Any further disruption or attacks that materially constrict shipping would validate Logan’s inflation concern and push the macro pressure further. Even tentative diplomatic progress could relieve crude prices and ease risk sentiment broadly. This is the most direct near-term swing variable.
- Fed communication cadence. Whether other Federal Reserve officials echo or contradict Logan’s hawkish stance in the days ahead is the most direct test of whether markets should price in renewed tightening risk or lean on the June CPI dovish signal. A hawkish chorus would pressure valuations across long-duration growth names.
- Yield curve direction. Watch whether the curve twist resolves. If short rates keep rising while long rates fall, markets are doubling down on the policy-error scenario. If both rise together, persistent inflation expectations are becoming entrenched, a different and broader problem. Tech earnings and guidance also represent a fourth-order risk, particularly any guidance cuts tied to geopolitical uncertainty or China exposure, but the macro variables above will set the tone.
What the macro picture demands from investors right now
The three forces that drove Thursday’s selloff, a geopolitical oil shock, a hawkish Fed signal, and a stagflationary commodity pattern, are not three unrelated pieces of bad news. They are a single coherent macro regime shift. The supply-shock oil spike gave Logan’s forward inflation concern credibility. Logan’s call undermined the dovish CPI interpretation. The yield curve confirmed that professional bond investors see the policy-error risk building.
The tension for investors is specific: the June CPI print suggested conditions for a dovish pivot, but the macro environment assembling around it argues that pivot may be further away than markets priced before 16 July.
The VIX at 16.73 is elevated enough to confirm genuine macro repricing, but low enough to indicate markets have not yet moved to a defensive posture. Repricing, not panic, is the characterisation that fits.
A repricing phase rewards investors who correctly identify the regime before the consensus does. The NASDAQ’s underperformance is the clearest signal of where rate and geopolitical risk is concentrated right now. The variables identified above, Hormuz headlines, Fed communication, yield curve behaviour, are the specific inputs that will determine whether valuations in rate-sensitive sectors need to adjust further.
For investors exploring what a sustained repricing of rate-sensitive growth assets would mean for portfolio positioning beyond the near-term, our full explainer on market leadership rotation examines the valuation spreads between US Tech and international developed markets that institutional managers at BlackRock, JPMorgan, and Goldman Sachs are already repositioning around.
This article is for informational purposes only and should not be considered financial advice. Investors should conduct their own research and consult with financial professionals before making investment decisions. Past performance does not guarantee future results. These forward-looking observations are subject to change based on market developments and evolving geopolitical conditions.