
Professional investors are running record underweight positions against ASX bank shares at the exact moment those shares are trading near record highs. That is not a typo. It is the single most important tension in Australian equities right now.
This is not a straightforward case of some investors being wrong and others being right. Two market forces operating on completely different logic have collided: active fund managers pricing Big 4 shares on fundamentals, and passive flows, from superannuation contributions and global ETFs, that buy mechanically regardless of price. The result is an investment environment where the professional consensus and share prices are saying opposite things simultaneously, with real consequences for anyone holding Commonwealth Bank of Australia, Westpac, NAB, or ANZ for franked dividends.
Here is what both sides of the argument look like when you lay the evidence out, and the specific signals that will tell you which force wins over the next 12 months. Not a recommendation. A framework for seeing through the noise yourself.
A record professional bet against banks that share prices are ignoring
According to Morgan Stanley’s proprietary survey of approximately 60 domestic active fund managers, the ASX Financials sector was carrying an average active underweight of minus 8.0 percentage points as of mid-July 2026, a figure the firm described as the largest collective sector underweight it had recorded.
The scale becomes clearer when you look at the breadth. Around 87% of the active domestic funds included in the survey held an underweight position in ASX Financials as of mid-July 2026. CBA alone was responsible for an underweight four times the size of the next largest individual underweight recorded across the surveyed managers.
According to Morgan Stanley’s survey of approximately 60 active domestic fund managers, 87% were underweight ASX Financials as of mid-July 2026, representing the largest collective sector underweight the firm had on record.
The broker ratings landscape reinforces the picture:
- Morgan Stanley: ANZ rated Overweight; CBA, NAB, and WBC rated Underweight
- Macquarie: Sector-level Underweight; ANZ the sole Neutral-rated preference among the Big 4
- ANZ is the only major bank where a majority of surveyed active fund managers held an overweight position
Morgan Stanley characterised the environment as one where too much “soft-landing” optimism has been priced into bank valuations. When 87% of the professional investors with the most direct financial incentive to be right about valuations over a 12-24 month horizon are positioned the same way, and that positioning represents a record extreme, this is not normal divergence of opinion. It is a near-consensus professional signal that share prices are running ahead of what fundamentals can support.
When big ASX news breaks, our subscribers know first
What record short interest is telling you about near-term conviction
ASIC data compiled by Market Index showed aggregate short interest across the Big 4 banks at 5.5% of combined outstanding shares in July 2026.
That figure was roughly double the level observed one year earlier. The combined position had reached a peak of 6.5% in May 2026, a level not previously seen in ASIC’s short-position records going back to when the regulator began publishing this data in 2010. The trajectory matters: this is not a static bearish position but one that has been building consistently.
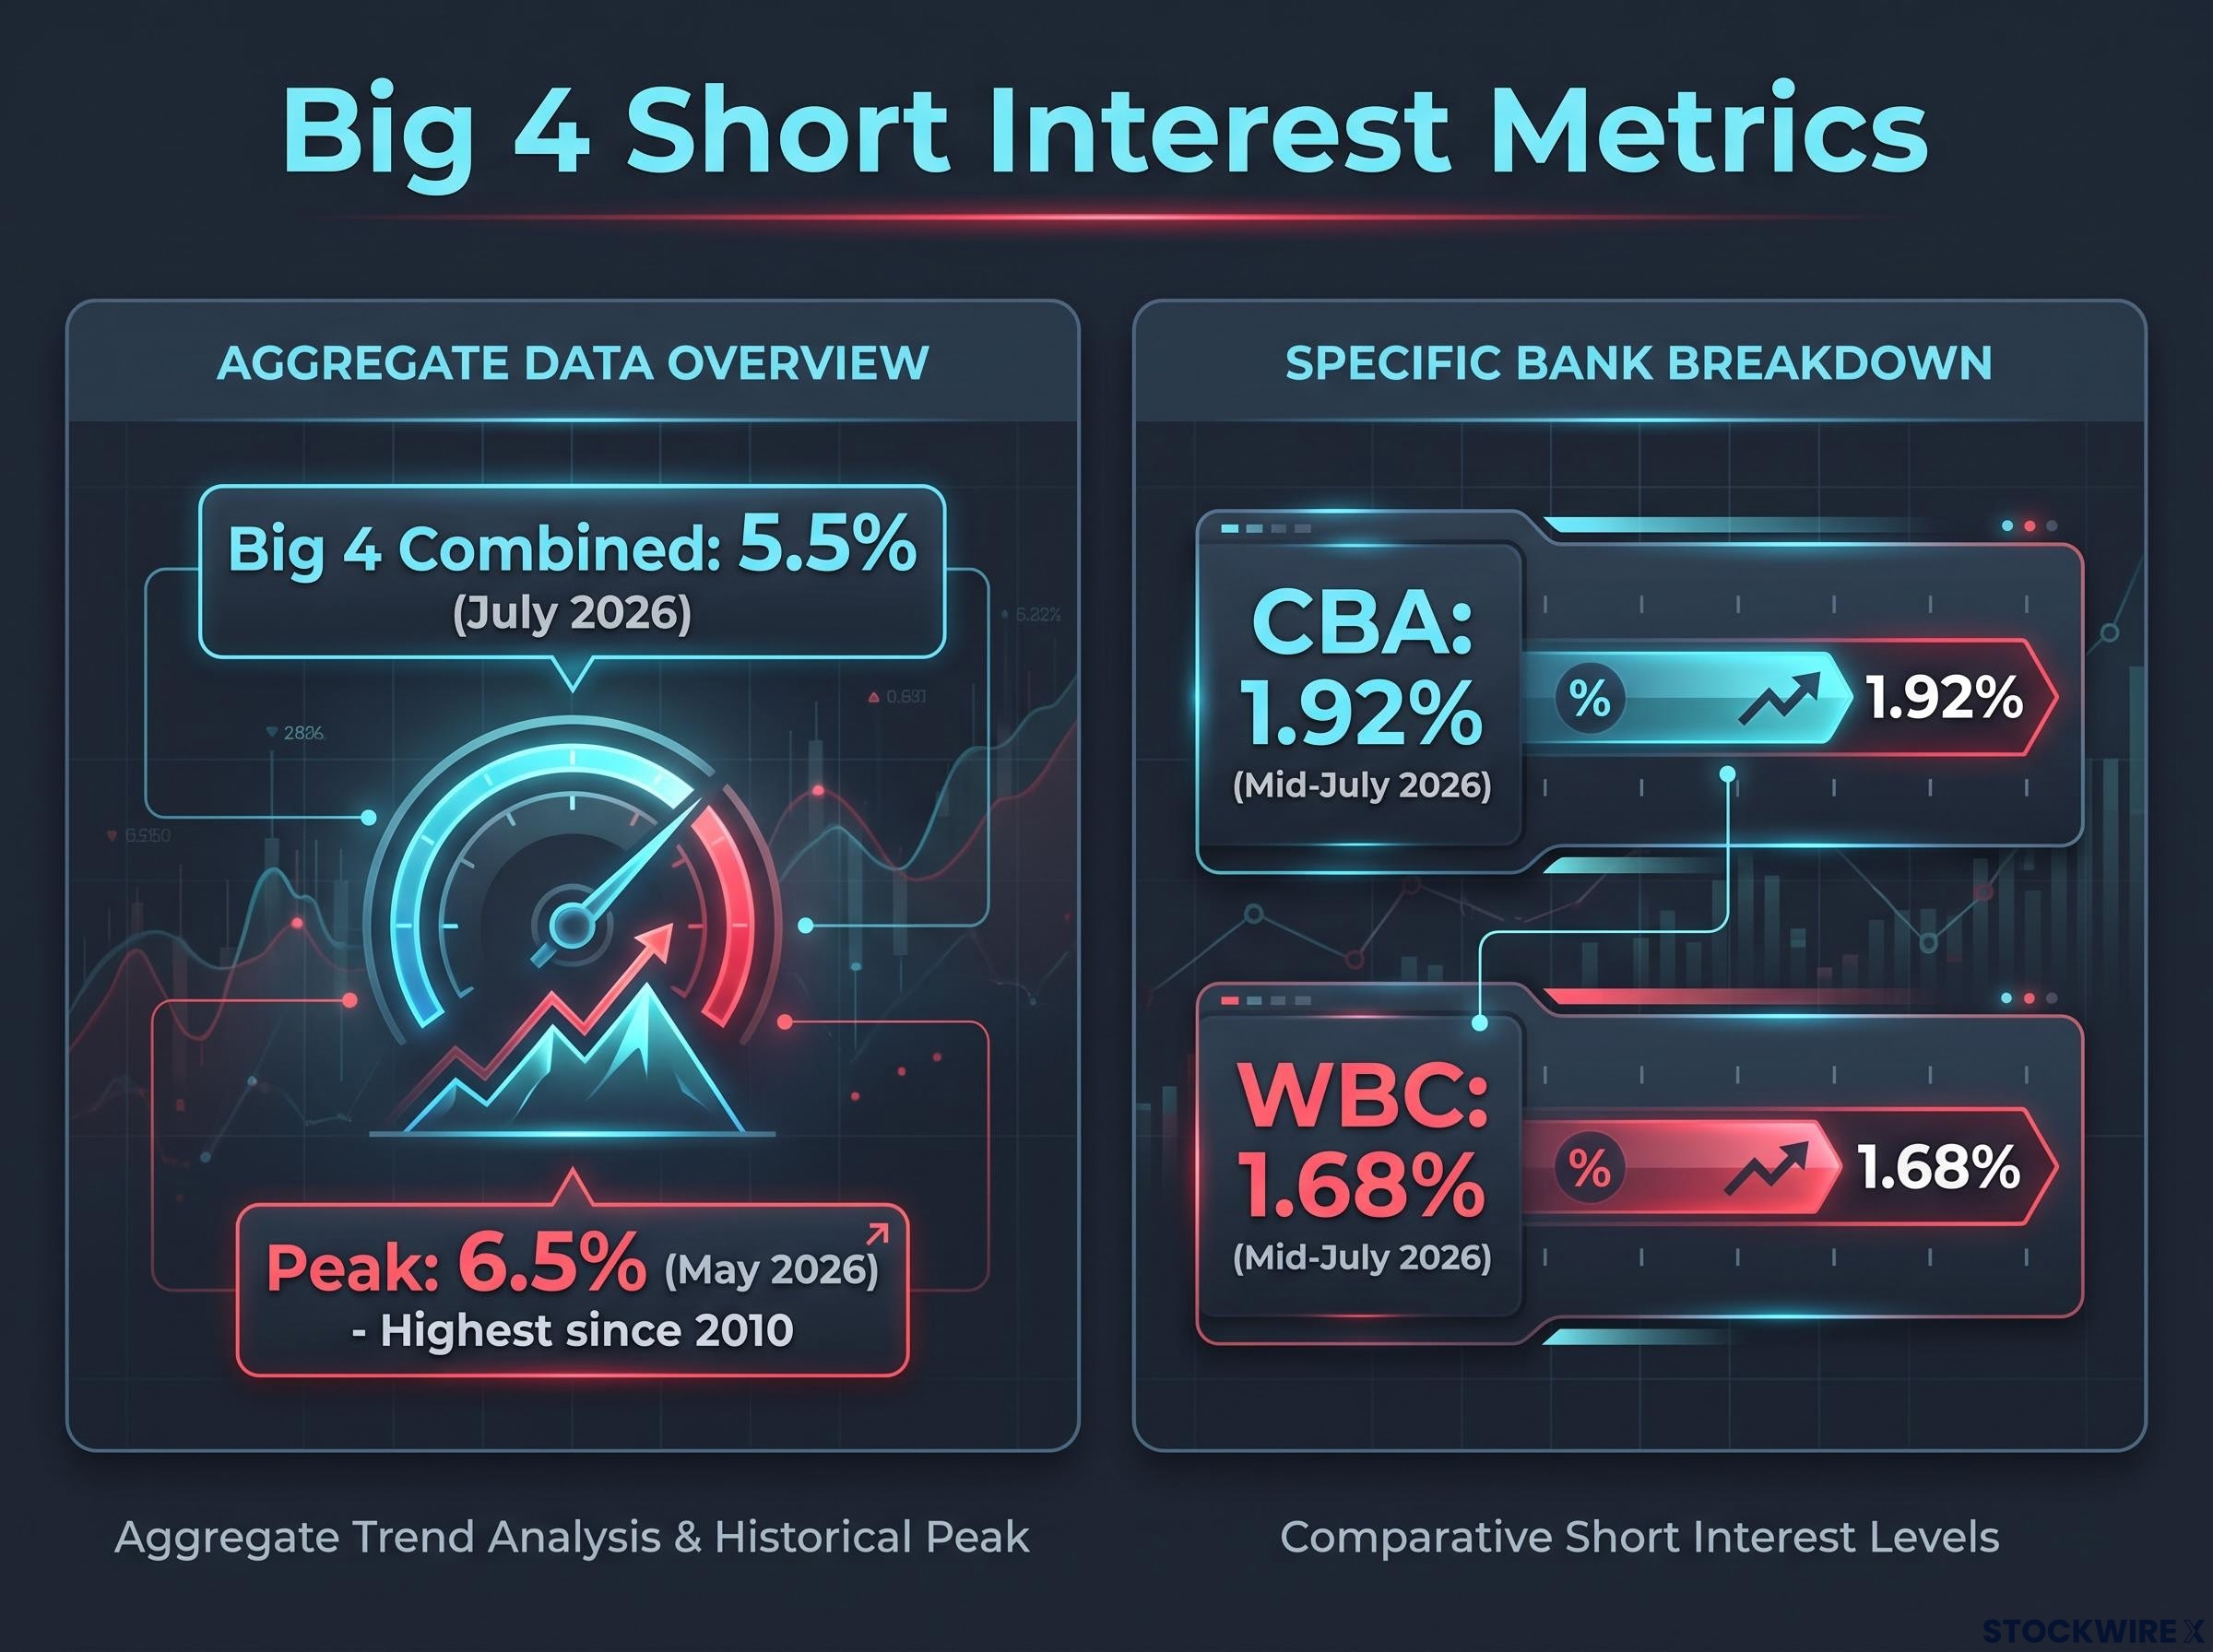
| Bank | Short interest (% of float) | Period |
|---|---|---|
| CBA | 1.92% | Mid-July 2026 |
| WBC | 1.68% | Mid-July 2026 |
| Big 4 combined | 5.5% | July 2026 |
| Big 4 combined (peak) | 6.5% | May 2026 |
CBA and WBC attract the most short interest among the four, which aligns with their comparatively higher concentration in residential mortgage lending, a vulnerability explored in the next section.
Short selling is not an opinion survey. It costs money every day a position is held. A doubling of short positions in 12 months reflects professional investors committing real capital to a bearish view, not merely expressing a preference. ASIC short interest data is one of the few public signals that reveals where sophisticated capital is actually positioned, and its trajectory here reinforces the active manager underweight picture.
ASIC short position reports publish aggregate and individual stock short interest data on a regular basis, providing one of the few publicly accessible windows into where sophisticated capital is actually placed rather than merely expressed as a view.
The earnings picture: why mortgage volumes and margin pressure are the key risks
The deterioration in mortgage lending flows across the Big 4 is broad-based, not confined to a single bank.
Macquarie estimated new mortgage lending flows were tracking 20-30% below prior year levels as of mid-2026, with owner-occupier lending down 10-20% and new investor lending down as much as 50%. Westpac reported an approximate 20% decline in mortgage application volumes. NAB flagged roughly a 15% quarter-on-quarter reduction in application values.
These are not marginal movements. CBA and NAB had already reduced mortgage rates by 0.10-0.15 percentage points to attract new borrowers, with further discounting anticipated, a dynamic that compresses net interest margins (the gap between what banks earn on loans and what they pay on deposits) at the same time volumes are falling.
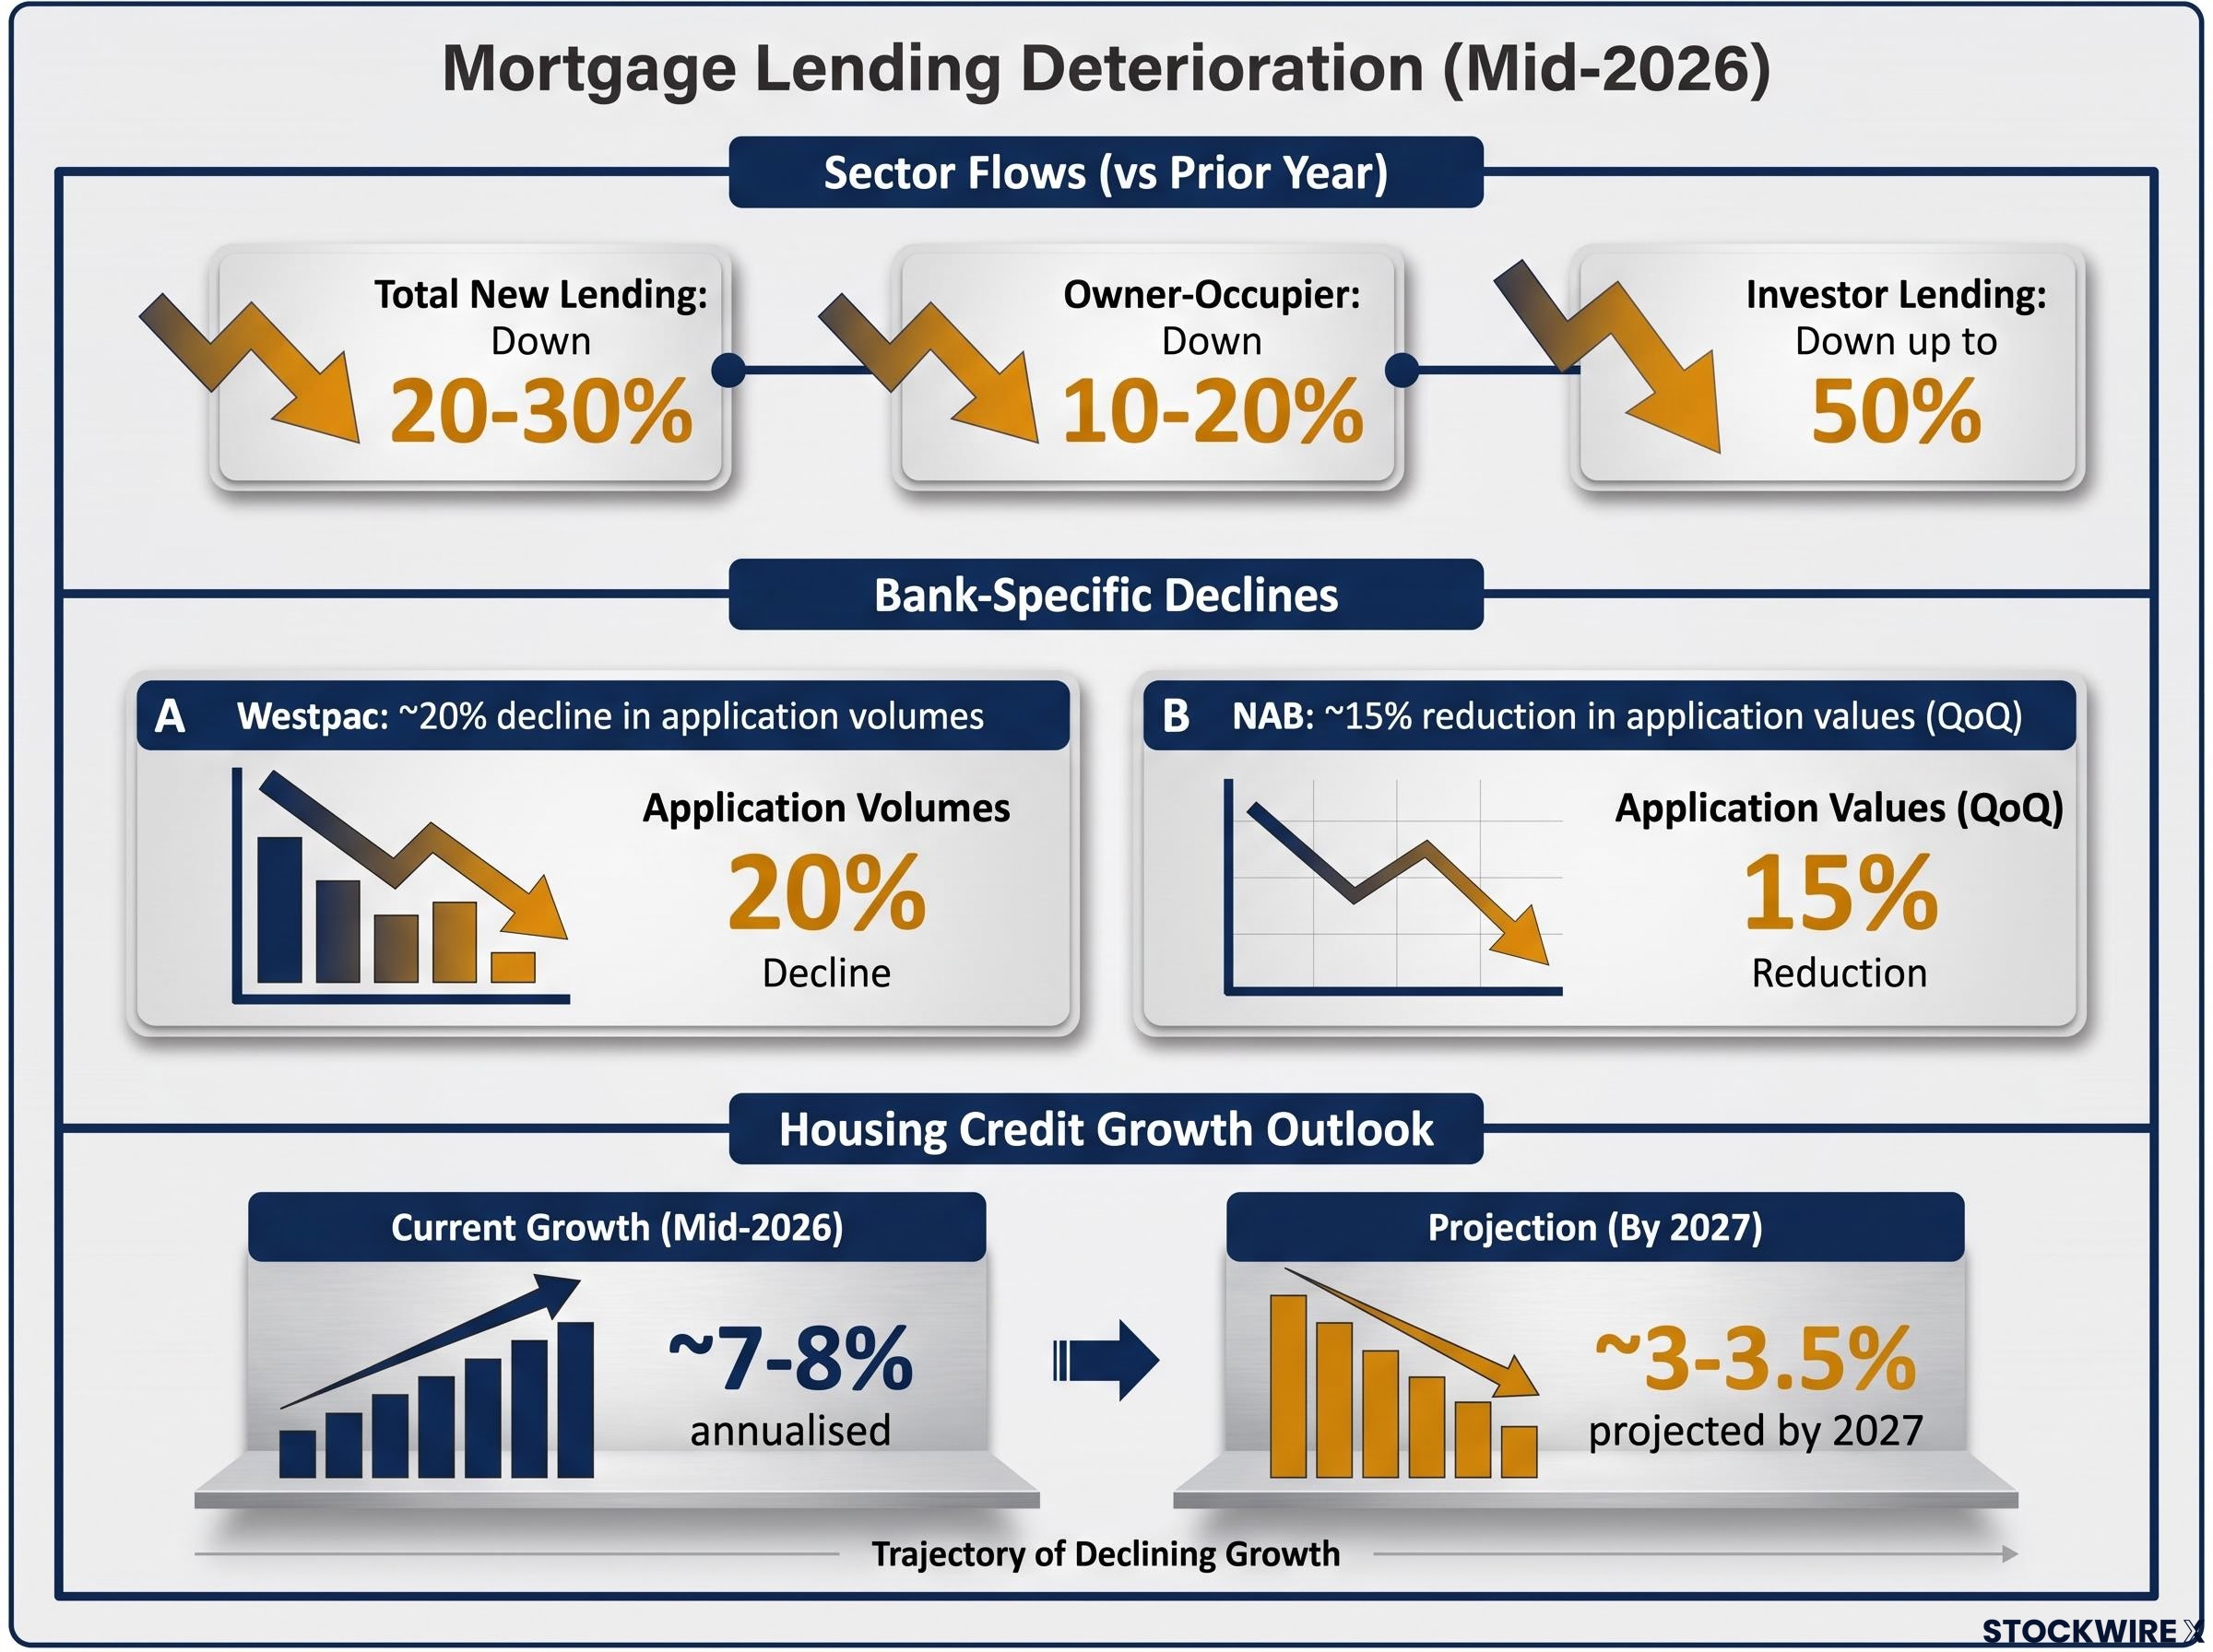
The slowdown is structural, not cyclical. Housing credit growth, currently running at approximately 7-8% annualised, is projected to decelerate to around 3.5% by 2027 according to Macquarie. Morgan Stanley projects system-wide mortgage growth slowing to approximately 3% in FY27.
Morgan Stanley’s preference order ranking ANZ first and CBA last reflects a direct assessment of differential housing cycle exposure, with CBA’s dominant mortgage market share making it the most sensitive of the four majors to any correction in residential property values.
| Metric | Current trend | 2027 projection |
|---|---|---|
| New mortgage lending flows (sector) | 20-30% below prior year | Further declines expected |
| Westpac application volumes | ~20% decline | — |
| NAB application values (QoQ) | ~15% reduction | — |
| Housing credit growth (annualised) | ~7-8% | ~3-3.5% |
Morgan Stanley noted as of mid-July 2026 that analyst consensus earnings forecasts had not yet caught up with the weakening outlook across the sector.
What the EPS revisions actually mean for near-term results
Macquarie trimmed FY27 earnings-per-share (EPS) forecasts for each of the Big 4 by 1-2%, with FY28 projections cut by a further 2-4%. Those percentage reductions sound modest in isolation. They are not modest when applied to stocks trading at elevated price-to-earnings multiples, because a small earnings miss compresses both the earnings number and the premium investors are willing to pay for it.
Morgan Stanley expects further estimate adjustments as FY26-27 results become visible. The combination of lending volume declines already in bank reporting, a projected halving of housing credit growth by 2027, and EPS cuts that analysts themselves describe as incomplete tells you the earnings revision cycle is not over. That matters directly for how much of the current dividend yield is being earned on a shrinking base.
Understanding the passive flow support holding prices up
If the professional consensus is this bearish, why are share prices near record highs? The answer is mechanical.
The Big 4 banks together make up roughly one-quarter of the S&P/ASX 200 by market capitalisation. Australia’s Your Future, Your Super performance-test framework has made superannuation funds increasingly cautious about straying far from index weights, since the test penalises funds that trail their benchmark and encourages behaviour that tracks it closely. The practical result is that compulsory super contributions, which flow in each pay cycle regardless of market conditions, are distributed broadly in line with ASX 200 index weights. Banks represent roughly a quarter of that index, so approximately a quarter of each new contribution dollar is directed to bank shares.
The Your Future, Your Super performance test, administered by APRA, benchmarks MySuper products against a composite index and imposes mandatory member notification requirements on funds that underperform, creating direct structural pressure on fund managers to track index weights closely rather than adopt large active positions.
This buying is structurally indifferent to price. Passive capital flows deploy according to mandate, not valuation. When inflows arrive, funds must purchase securities in proportion to index weight regardless of whether those securities are cheap or expensive.
The mechanic extends globally. The Big 4 are large enough to be automatically included in ETFs tracking global financial sector indices. The iShares Global Financials ETF (NYSE: IXG) illustrates the scale:
- CBA: 15th largest holding at 1.27% of fund weight
- WBC: approximately 0.56%
- NAB: approximately 0.54%
- ANZ: approximately 0.49%
- Combined Big 4 weight: approximately 2.3% of IXG
That means roughly 2.3 cents of every dollar flowing into IXG is mechanically directed to the four Australian majors. Global ETF assets reached a record US$23.1 trillion in June 2026, with 2026 year-to-date inflows already exceeding US$1 trillion. A study by Li and Winn from the US SEC’s Division of Economic and Risk Analysis (February 2026) found that funds operating under a passive mandate account for more than 90% of total global ETF assets.
Macquarie explicitly linked recent bank share momentum to large offshore buying and warned those flows could reverse as relative returns change.
The practical implication is that current price support is not a vote of confidence in the banks’ earnings trajectory. It is a mechanical consequence of index construction and compulsory super contributions that will continue until it does not. That is a fundamentally different kind of support than one built on improving fundamentals, and understanding the distinction helps you assess the durability of the current share price level.
Valuation context: how expensive are the Big 4 relative to history?
Morgan Stanley data showed the Big 4 trading at an average price-to-earnings ratio of approximately 18.5 times as of mid-2026, compared with a pre-COVID five-year average of approximately 12.6 times. That is a 47% premium to the historical norm.
| Benchmark | Current P/E (mid-2026) | Pre-COVID 5yr average P/E |
|---|---|---|
| Big 4 average | ~18.5x | ~12.6x |
| CBA | ~25.2x (forward); ~27.3x (trailing) | Included in sector average |
CBA is the outlier that makes the sector average look moderate. At approximately 25.2 times forward earnings, it is one of the most expensive large banks globally. The trailing multiple of approximately 27.3 times is a valuation typically reserved for high-growth technology companies, not a mature mortgage lender in a decelerating credit market.
The gap between CBA’s approximately 25x forward multiple and the sector’s pre-COVID average of roughly 12.6x is most clearly interpreted through bank stock valuation methods that combine PE analysis with a dividend discount model, since the DDM surface makes explicit how much earnings and payout stability the current price has already assumed.
At these multiples, current prices have already discounted a favourable earnings outcome. Any disappointment relative to those optimistic expectations creates what is known as double compression: earnings fall and the multiple investors are willing to pay contracts at the same time. That is how large-cap positions lose value quickly despite appearing to be stable, dividend-paying businesses. For an investor weighing whether to hold or trim ASX bank exposure, the valuation gap tells you the margin for error is exceptionally thin.
What dividend investors holding Big 4 shares need to weigh right now
Collecting franked income at elevated valuations is a defensible strategy. But it carries implicit assumptions about earnings stability that the evidence in this piece does not support cleanly. The question is not whether the Big 4 will collapse. It is whether the current price level adequately compensates for the specific combination of valuation stretch, flow-dependent support, and earnings revision risk that the data describes.
For most new capital entering the sector today, the honest read from the institutional data is that it probably does not.
There are four specific variables worth monitoring over the next 12 months:
- Consensus earnings revisions. If EPS downgrades accelerate through FY26-27 results beyond the 1-4% cuts already announced, that increases the probability of a de-rating.
- Credit quality and policy changes. The national unemployment rate climbed to 4.5% in April 2026, a level not seen since 2021. Negative gearing reform and potential NDIS spending reductions represent additional headwinds to housing credit and bank earnings.
- Flow dynamics. Monitor the IXG price trend and global financials rotation. If offshore flows slow or reverse, the passive bid underpinning current prices weakens.
- Provisioning releases. UBS noted banks entered this period with provisioning stronger than prior downturns. Provision releases could partially offset earnings pressure, though UBS estimated that ANZ’s provisioning buffer would fall approximately $5 billion short under a severe downside scenario.
Morgan Stanley described negative gearing reform as a potential end to Australia’s three-decade housing super-cycle, and suggested the knock-on effects for the broader economy could prove more significant than the RBA’s rate tightening programme.
Around 80% of existing borrowers held their repayment levels steady across the 2025 rate reduction cycle, which provides some near-term cushion. And institutional analysts acknowledged that long-term holders are likely to continue collecting franked dividends regardless of analyst views. The risk sits in capital value, not income cessation.
Dividend investors tend to anchor on yield and franking credits while discounting capital risk. At current valuations, capital risk is where the asymmetry sits: limited upside if everything goes right, meaningful downside if earnings disappoint against already-optimistic expectations priced into the shares.
Dividend investors who anchor on yield frequently understate capital risk because franking credit mechanics make the grossed-up income appear more attractive than the face cash yield, particularly for SMSFs in pension phase where the full credit is refunded as cash, reinforcing the tendency to hold positions that the institutional data suggests are exposed to de-rating.
The evidence investors need to make a clear-eyed call on Big 4 exposure
The tension at the centre of the ASX banks outlook is structural, not temporary. Professional capital is positioned bearishly for well-documented reasons: record-high valuations on decelerating earnings, mortgage volume declines across all four majors, and EPS forecast cuts that analysts themselves describe as incomplete. Structural flows are providing price support for reasons entirely unrelated to those fundamentals: index construction, compulsory superannuation, and global ETF mechanics.
Morgan Stanley characterised this as an “unstable equilibrium.” The premium can persist, but it is unlikely to be permanent. The Big 4 are not in crisis. They are trading at a price sustained more by flows and sentiment than by sustainably improving fundamentals.
The four watchpoints, consensus EPS revisions, credit quality and policy shifts, flow dynamics, and provisioning buffers, give you a practical monitoring framework. Not a signal to act today, but a set of specific variables that will tell you over the next two quarters whether the bear case is materialising or whether the passive bid continues to hold.
APRA stress test findings from May 2026 confirmed that Australian banks can absorb severe multi-variable shocks with capital buffers intact, but the regulator simultaneously flagged geopolitical transmission channels and offshore private credit exposures as growing risks that domestic capital ratios alone cannot neutralise.
This article is for informational purposes only and should not be considered financial advice. Investors should conduct their own research and consult with financial professionals before making investment decisions. Past performance does not guarantee future results. Financial projections are subject to market conditions and various risk factors.