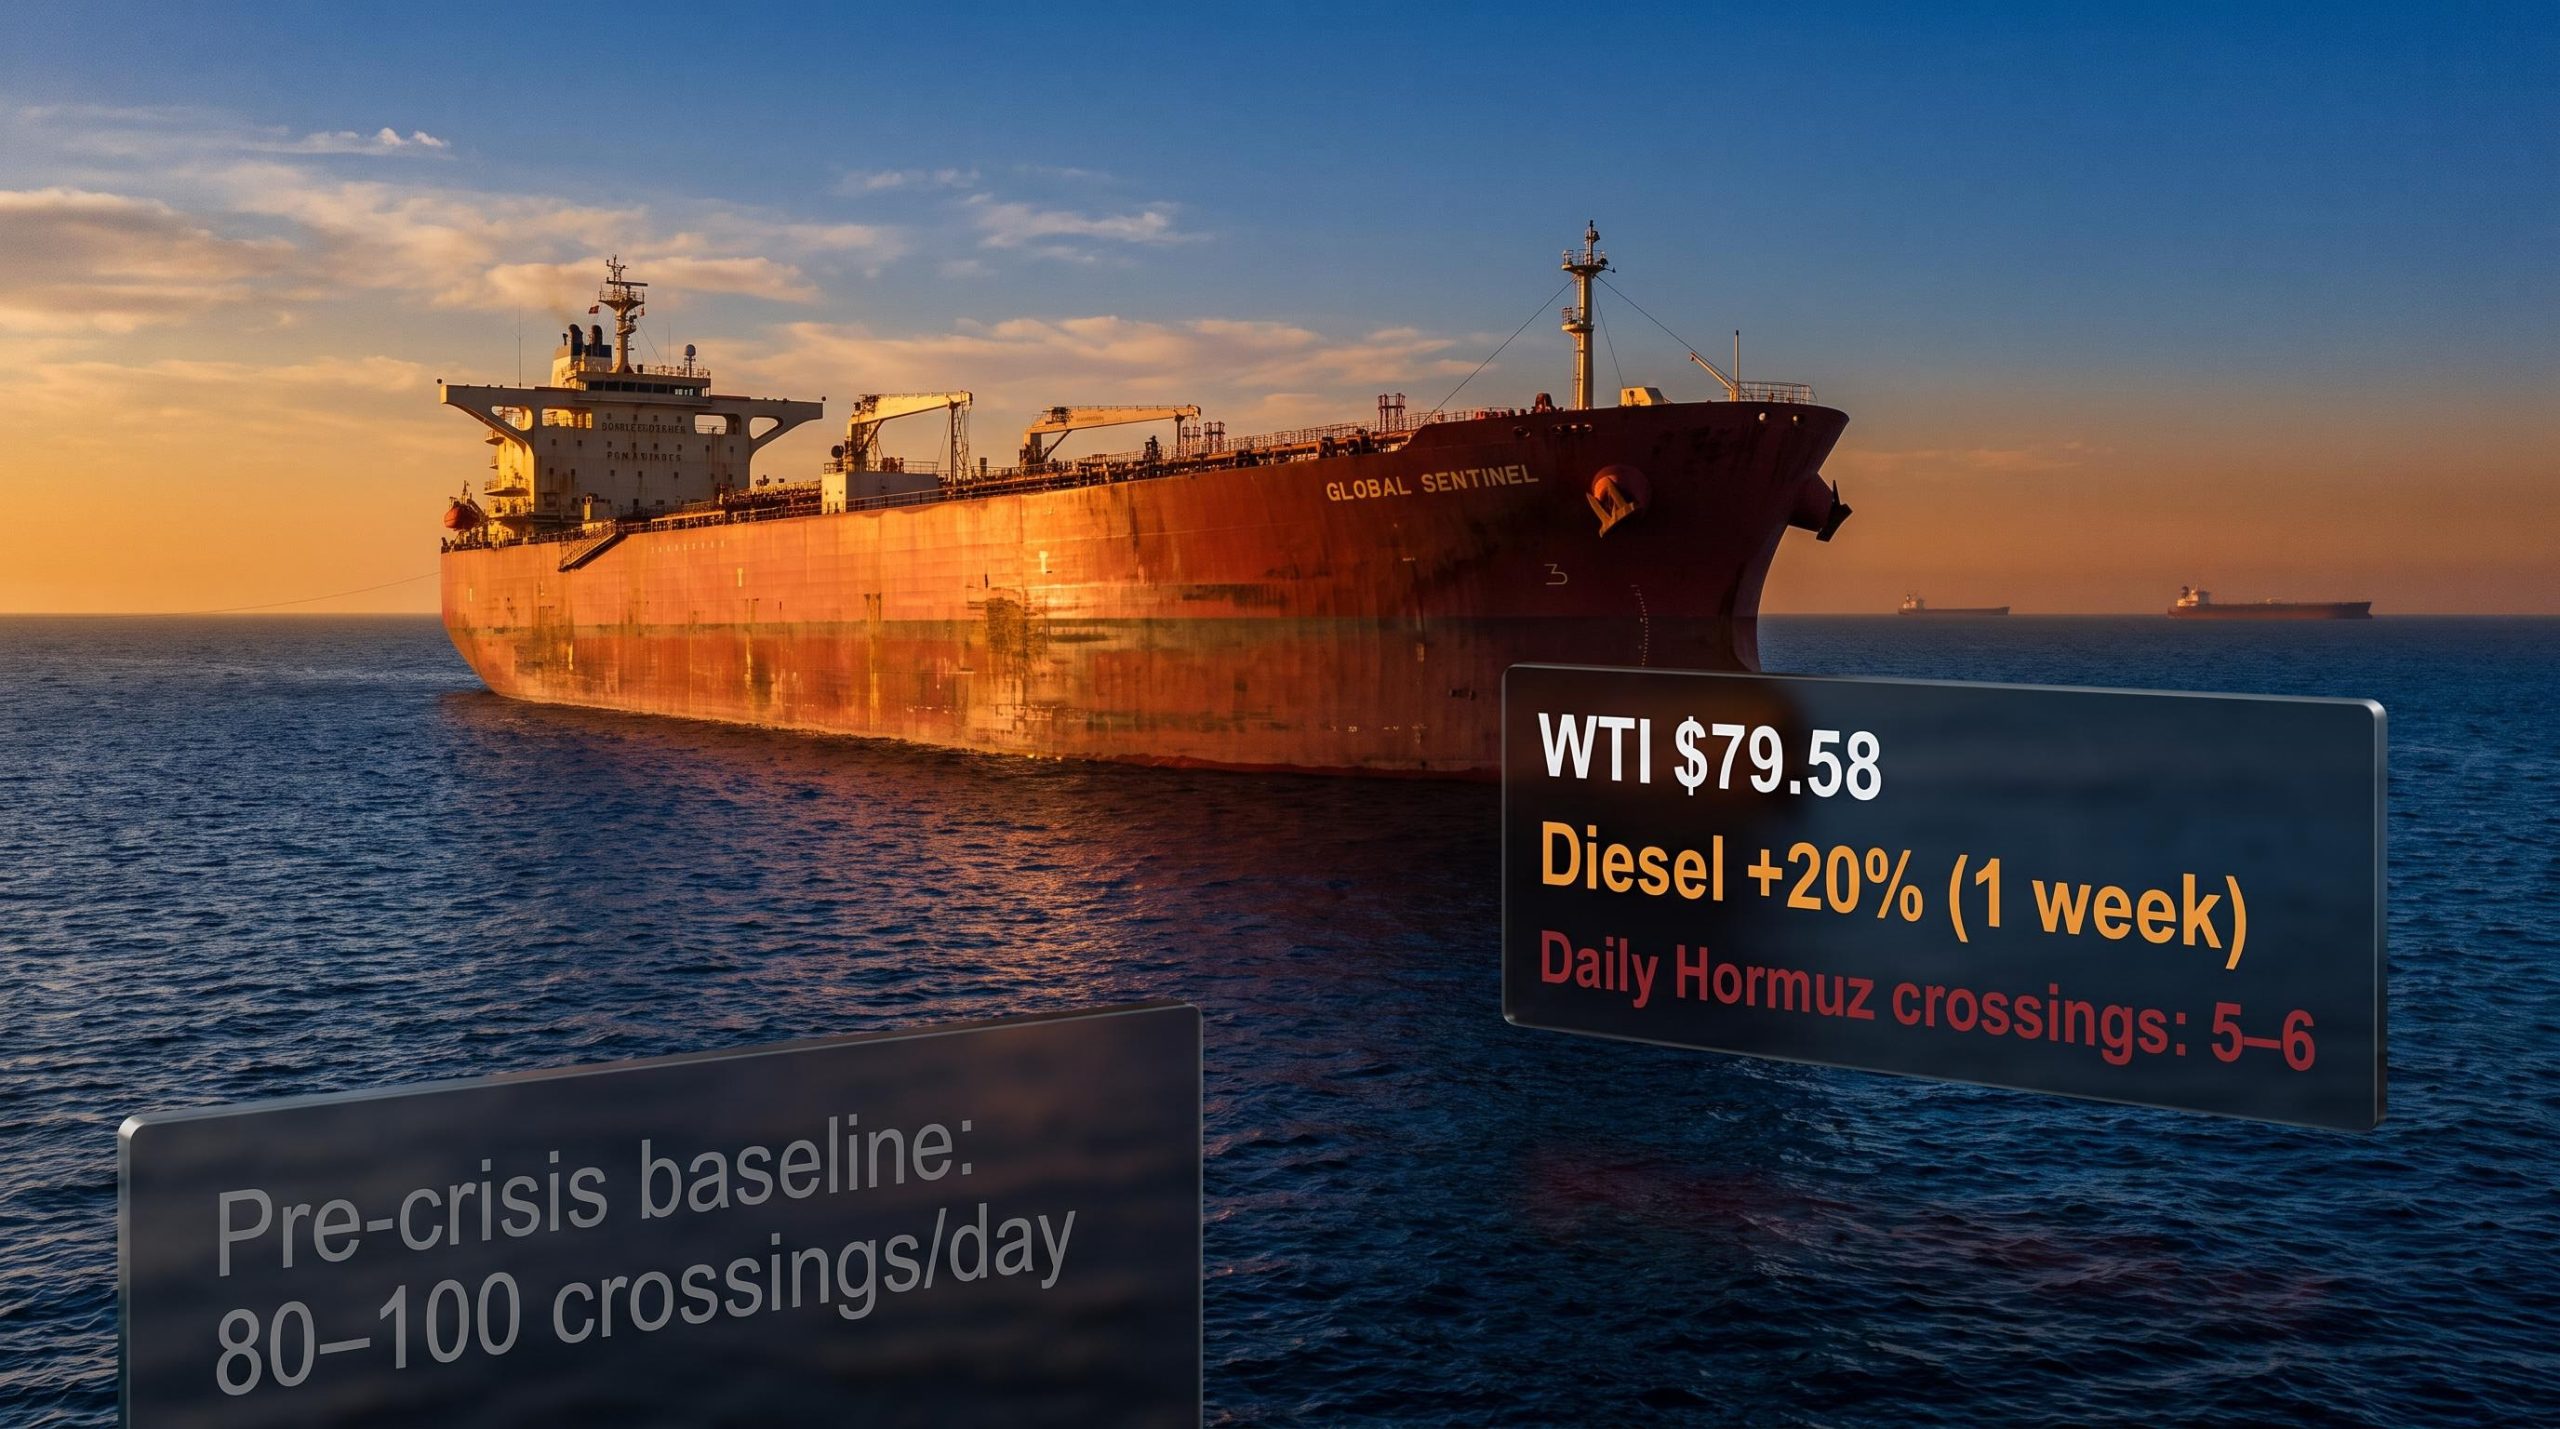
Five nights of US military strikes against Iran. Tanker traffic through the world’s most important oil chokepoint falling to single digits on some days. And WTI crude sitting near $79, barely flinching.
That apparent calm is not indifference. It is a specific market bet, and understanding the mechanics behind it matters as much as the headline price. The divergence between flat crude and diesel futures that have surged approximately 20% in a single week is the real signal, and it points to where the stress in this conflict is actually landing.
Here is the logic behind the crude price, why diesel tells a different story, and a concrete framework for tracking how this conflict escalates or de-escalates from here.
Why crude is near $79 when a chokepoint is under threat
The starting point is a principle that applies to every geopolitical supply shock:
Markets price the probability and expected duration of disruption, not the worst-case scenario.
Applied to this conflict, that principle explains why WTI can sit at US$79.58, down just 0.03% on 17 July 2026, while a military conflict rages across the Gulf. Four reinforcing factors hold the price in range:
Geopolitical risk premiums embedded in oil futures can mask contradictory directional trends simultaneously, with Brent swinging nearly 7% across a single week in May 2026 even as intraday sessions moved in the opposite direction on competing diplomatic signals.
- Probability of full, prolonged closure is still seen as low. Even at the worst moments in July, traffic through Hormuz has not gone to zero for more than brief periods. Ceasefire talks in June briefly reopened the strait and immediately pulled prices down.
- OPEC+ spare capacity provides a buffer. The late-June production increase was a direct market-calming signal, and strategic reserves offer short-term cushion against panic bidding.
- Demand uncertainty offsets supply-risk fear. Traders are balancing supply disruption headlines against a macro environment where industrial and transport demand is not uniformly strong.
- Gradual price escalation anchors expectations. Brent moving from the mid-70s to the low-80s rather than spiking above $120 reinforces the existing range as a reference band.
The June ceasefire precedent sharpens the point. When brief diplomatic progress reopened Hormuz, Brent fell approximately 3% in a single session. On 17 July, the US energy sector advanced 1.00% even as crude was flat, a signal that equity investors see contained upside rather than imminent crisis.
The $79 price is not complacency. It is a specific bet that disruption remains temporary or partial. The moment that bet looks wrong, the repricing will be fast.
When big ASX news breaks, our subscribers know first
What the Strait of Hormuz data actually shows right now
The traffic picture through Hormuz is genuinely contested, and the ambiguity itself is part of the story the market is pricing.
Some trackers have marked the strait “CLOSED.” Others show low but non-zero transits. US sources report vessels still passing through. The divergence is not a data failure. It reflects intermittent closures, partial reopenings, and ships sailing dark or using narrow corridors that evade standard monitoring.
| Time Period | Daily Tanker Crossings | Strait Status | Data Source |
|---|---|---|---|
| Pre-crisis baseline | 80-100 | Open, normal operations | Lloyd’s List Intelligence |
| Early July 2026 (low point) | 5-6 | Near-halt on key lanes | Kpler, Windward |
| Mid-July 2026 | Single digits (variable) | Contested; partial reopening | Multiple AIS trackers |
Lloyd’s List Intelligence and Windward data showed crossings via the main AIS-visible lanes dropping from 45 per day to only five on some days earlier in July, with traffic described as having “effectively ground to a halt.” Dozens of tankers have gone dark on AIS in the Gulf region, well above normal levels.
A senior Iranian military figure has stated publicly that Hormuz represents an absolute limit Tehran will defend, warning that Iran will not permit US interference in the waterway.
The triple lock on Hormuz, combining US naval operations, Iranian toll enforcement, and near-total withdrawal of commercial war-risk insurance, created a supply constraint in May 2026 that no single government policy response could bridge, demonstrating how layered closure mechanisms compound well beyond any individual military or diplomatic action.
Iran has reportedly directed Houthi forces to block Red Sea oil routes if the US strikes Iranian power infrastructure, adding a second chokepoint to the risk calculus.
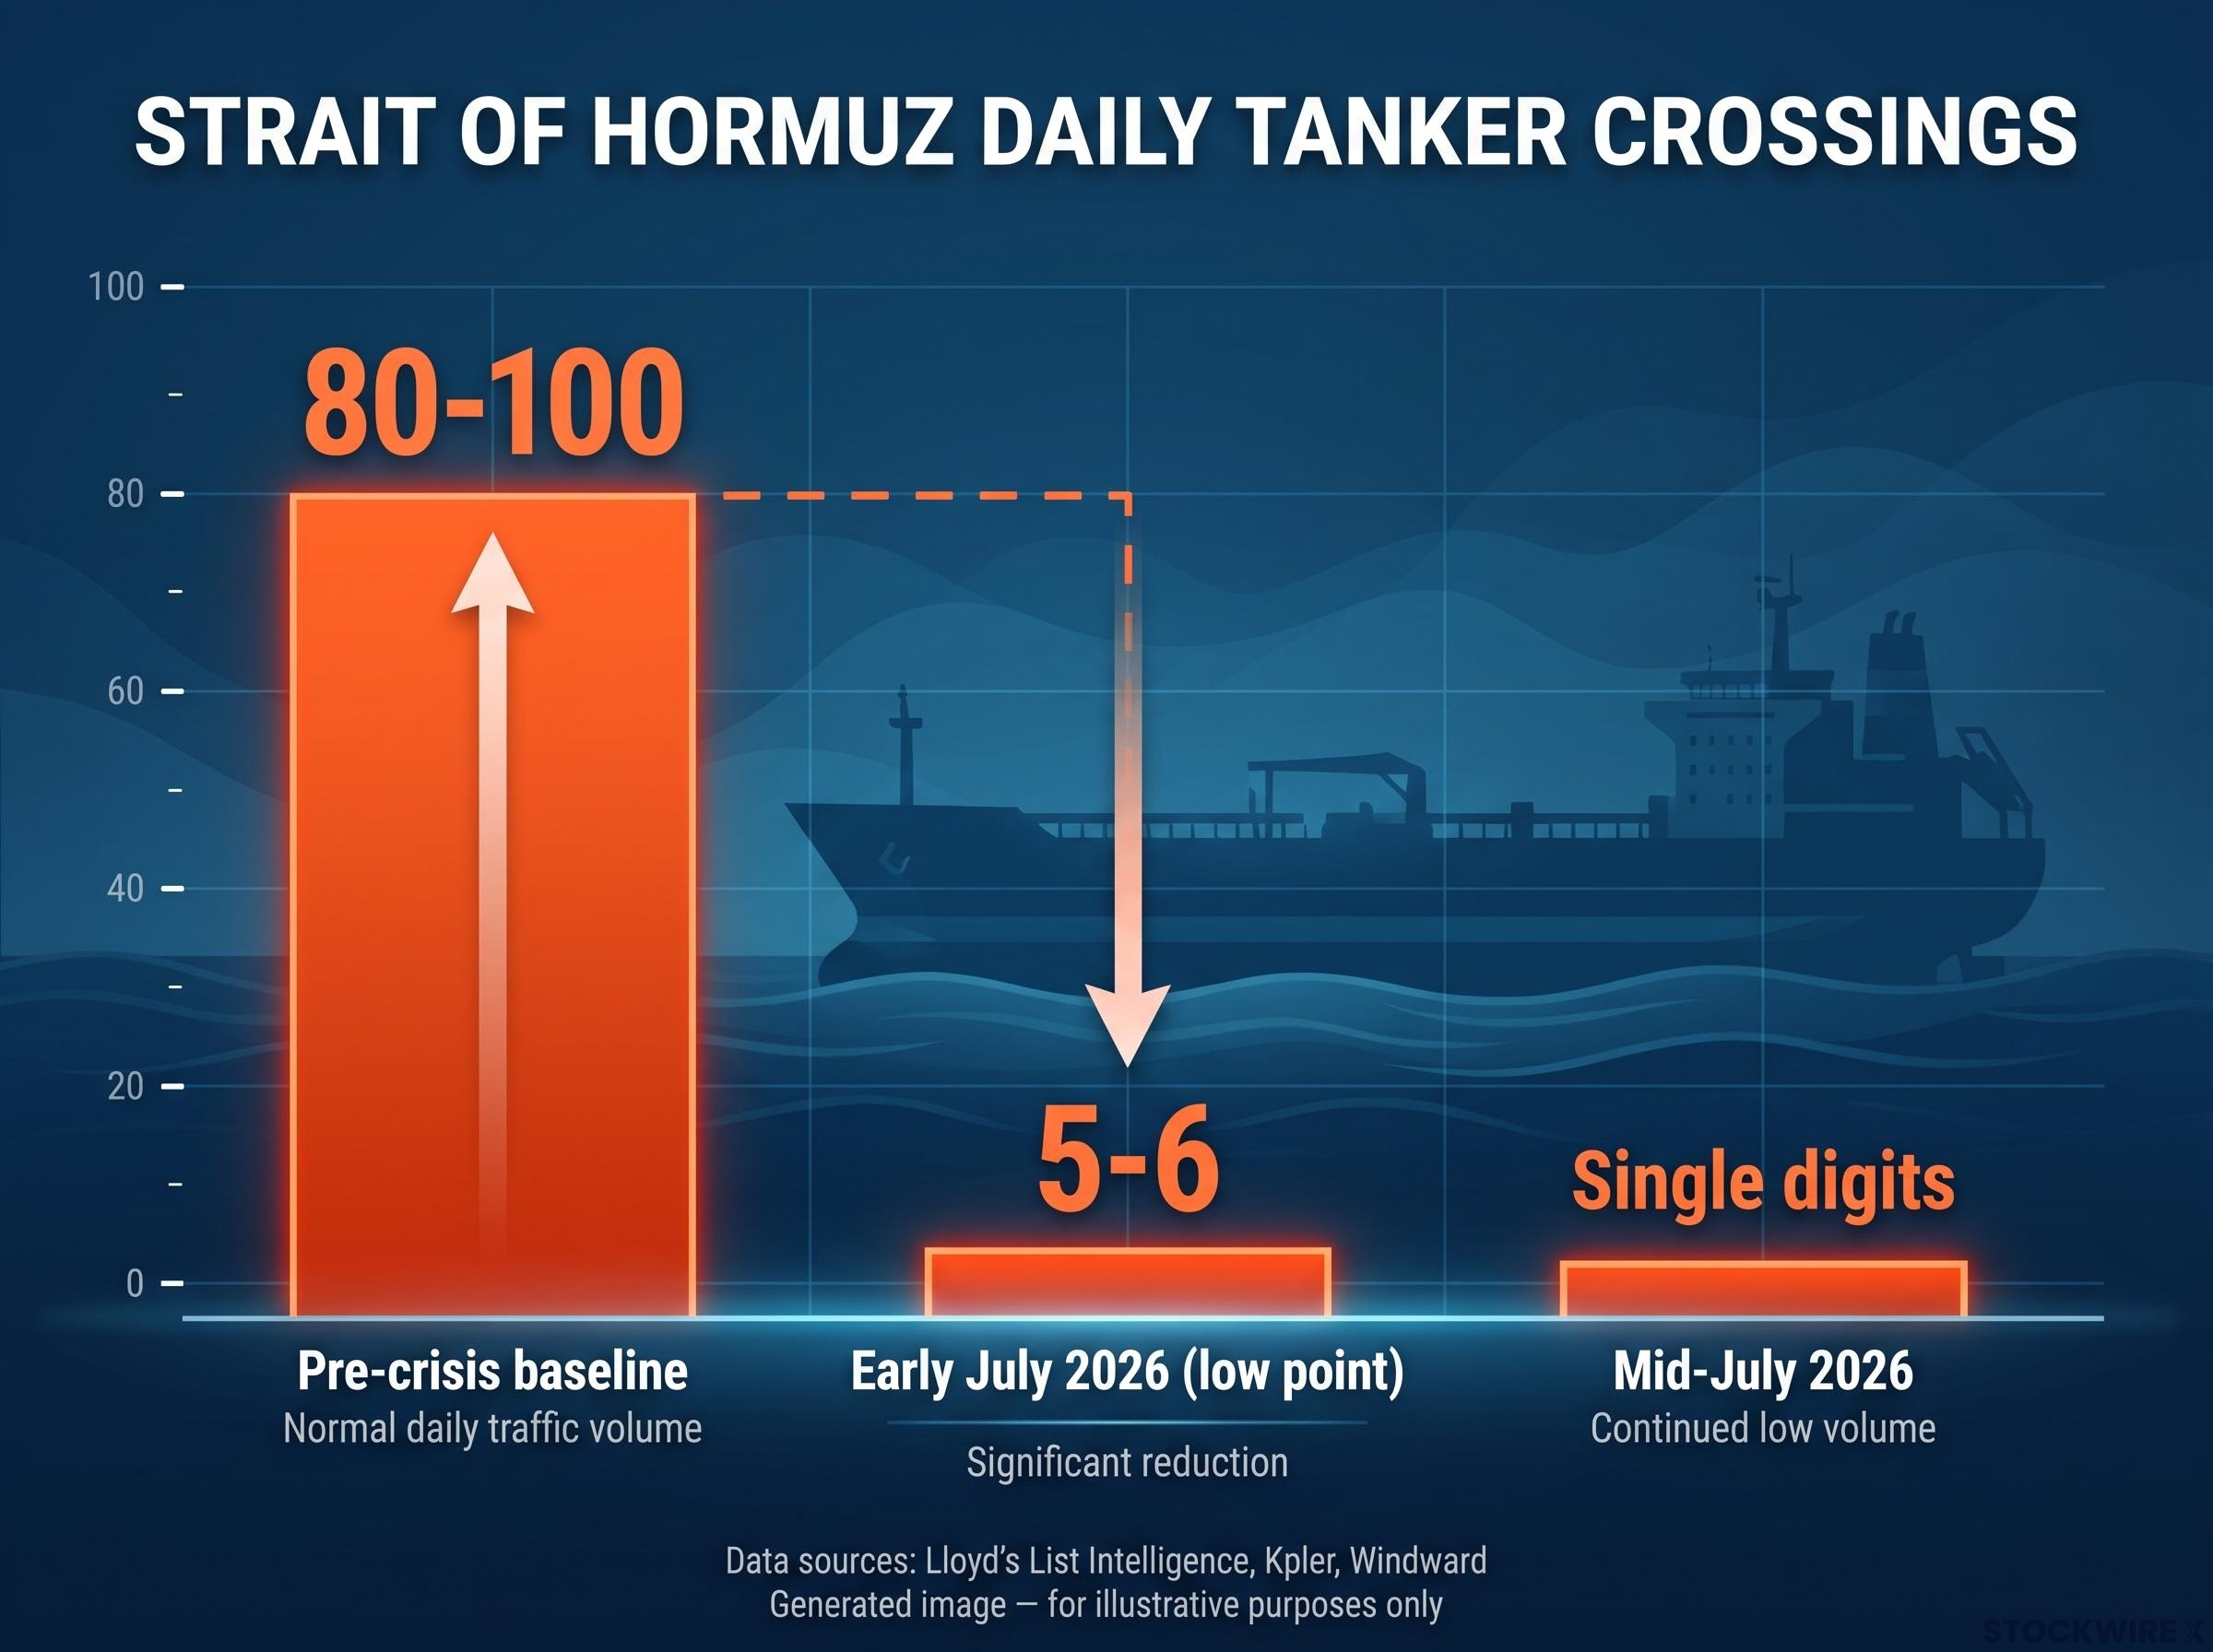
Single-digit transit days against a baseline of 80-100 crossings means the physical disruption is already large. What remains uncertain is whether this becomes permanent, and that distinction is exactly what the crude price is attempting to bet on.
The diesel signal and what it tells you that crude does not
By 17 July 2026, US diesel futures had risen by roughly 20% across the preceding week, even as WTI held broadly flat over the same period. That divergence is not a curiosity. It is structurally predictable, and it tells you where the supply chain stress is actually landing.
Why refined products react faster than crude
Benchmark crude reflects global supply and spare capacity, which adjust slowly across producers and reserves. Diesel and distillates reflect regional logistics and specific delivery routes, which tighten immediately when tanker traffic slows or reroutes.
Diesel, jet fuel, and other middle distillates depend heavily on Gulf refineries and transit through Hormuz. Even partial slowdowns in tanker traffic can tighten regional diesel balances quickly, particularly for Europe, parts of Asia, and East Africa, which are heavily import-dependent.
Reporting from mid-July 2026 confirmed a record gap between refined products and crude, with gasoline, diesel, and jet fuel prices rebounding even as benchmark crude eased, a divergence that reflects the physical delivery constraints the market is pricing rather than aggregate supply destruction.
Lloyd’s List Intelligence and Windward described AIS-visible large-vessel crossings as having “effectively ground to a halt” at multiple points in July, directly compressing the pipeline of refined product supply to these regions.
“The diesel surge is the market’s way of saying: even if global crude supply can eventually be re-routed or buffered, the near-term delivery of distillates via the usual sea lanes is already under stress.”
When diesel surges while crude holds, the market is signalling that near-term physical delivery of refined products is already constrained, even before aggregate global supply is formally disrupted. That is the risk worth watching if you hold exposure to transport, logistics, or energy-importing economies. Diesel is where the cost shock hits first.
A three-threshold framework for reading escalation risk
Rather than reacting to each headline, a structured framework converts the news flow into something you can monitor with discipline. Three thresholds capture the range of outcomes, and current conditions sit above the first but below a confirmed third.
| Threshold | Defining Characteristics | Key Indicators | Estimated Crude Impact |
|---|---|---|---|
| 1: Persistent routing disruption | Hormuz sharply reduced but not zero; ships use narrow corridors or sail dark; Red Sea harassment compounds risk | Single-digit daily crossings; crisis pressure readings at “extreme”; Houthi Red Sea activity | Elevated but bounded premium; refined products most affected |
| 2: Active harassment, still passable | Frequent attacks, mine threats, or vessel seizures; insurance premiums spike; some operators halt Gulf calls | War-risk surcharge jumps; P&I coverage changes; operator withdrawal announcements | Potential $10-$20 per barrel widening in risk premium |
| 3: Full or near-full closure sustained | Almost no tankers entering or leaving the Gulf; trackers and advisories converge on “closed”; active naval battle zone | Multi-day zero or near-zero AIS crossings; converging official closure status | Analyst estimates suggest potential spikes into the $130-$150 range |
Current conditions sit firmly above Threshold 1. Verified crossings have repeatedly fallen to single digits against the 80-100 baseline. Crisis pressure readings remain in “extreme” territory. Iran’s reported directive to Houthi forces on Red Sea routes adds a compounding second chokepoint.
The gap between Threshold 2 and Threshold 3 is narrowing. The senior Iranian military figure’s remarks positioning Hormuz as an absolute boundary that Tehran will not permit the US to contest is the kind of language that shifts tail-risk probabilities upward. Trackers have fleetingly shown “CLOSED” status, but sustained closure has not materialised. The framework matters most for knowing which indicators to watch for that transition, because the repricing at each step will be fast.
What the cross-asset picture is actually saying
The simultaneous market picture on 17 July 2026 is internally consistent, and it carries a specific message about how markets are framing this shock.
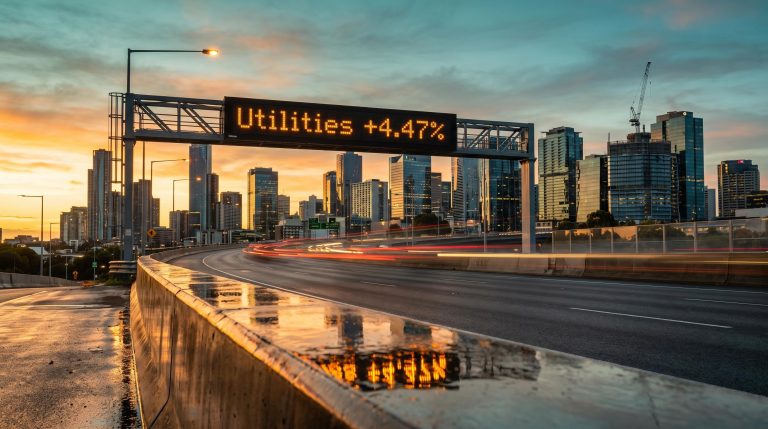
- Energy: US energy sector up 1.00%; crude flat; diesel up approximately 20% for the week
- Metals and miners: Gold down 2.07% to US$3,976.18; silver down 4.0%; palladium down 4.7%; copper down 0.92%; BHP shares down 5.5%; Rio Tinto down 3.1%; VanEck Gold Miners ETF down 3.51%; Global X Copper Miners ETF down 3.34%
- Rates: US 10-year Treasury yield up 0.53% to 4.569%
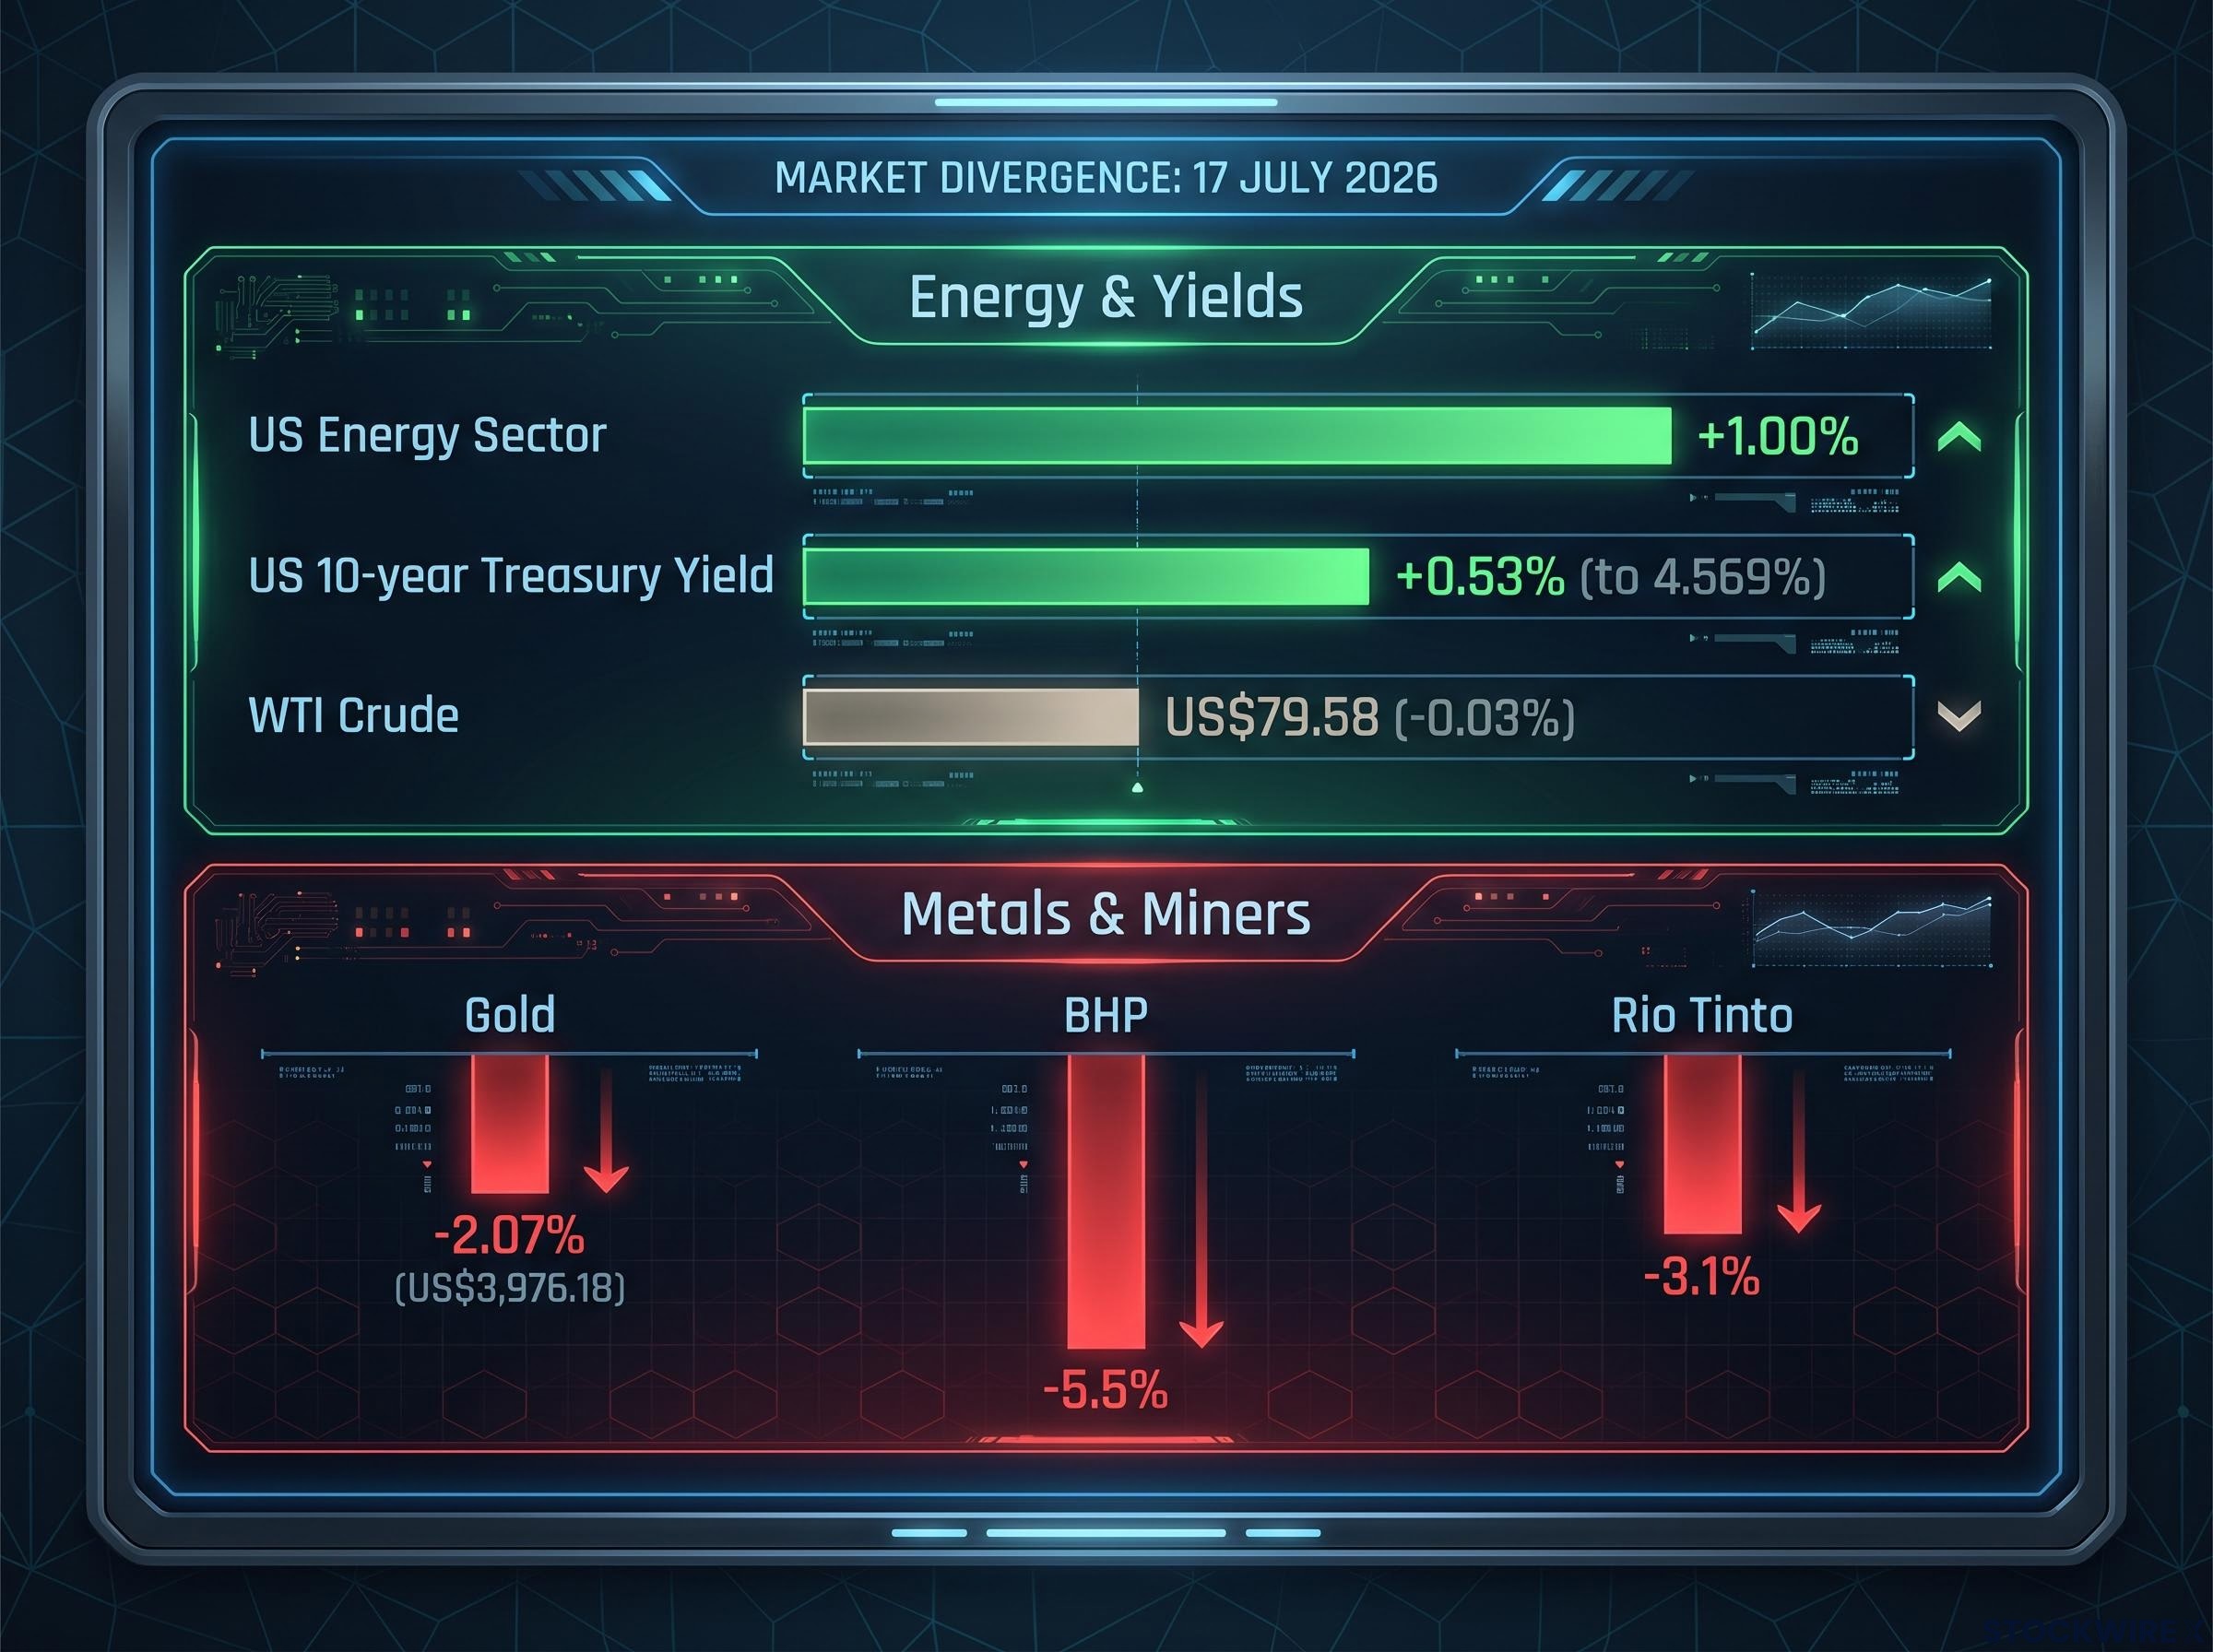
“If this were a pure geopolitical-hedge trade, gold would be rallying. It is not.”
Gold falling during a geopolitical event is a meaningful signal. It confirms that capital is rotating into energy exposure, not into broad defensive positions. This is a sector-specific energy shock trade, not a generalised flight to safety.
Rising Treasury yields complete the picture. Higher energy costs feed stickier inflation, constraining central banks from cutting rates, which creates demand headwinds for industrial commodities. The falling metals and miners confirm markets are pricing an energy-driven growth headwind for oil-importing economies.
What this tells you is that the macro risk extends well beyond the oil price itself. The stagflationary channel, where higher energy costs feed into inflation and keep policy rates elevated, has portfolio implications for fixed income duration, industrial equity exposure, and currency positioning that a simple energy sector trade does not capture.
The stagflationary transmission from an oil shock runs through inflation persistence, constrained central bank easing, and weakening industrial demand simultaneously, a combination that pressures fixed income duration and industrial equity exposure in ways that a single-sector energy trade does not capture.
The five indicators worth monitoring as the conflict develops
Five specific, trackable indicators give you the inputs to the market’s probability model rather than just the output.
- AIS tanker traffic counts through Hormuz. Daily verified crossings via Kpler, Lloyd’s List Intelligence, and Windward. Multi-day periods at or near zero would signal movement toward Threshold 3. The number of vessels “going dark” in the Gulf is itself an early warning.
- Insurer and war-risk advisory posture. P&I club coverage changes for Gulf calls, Lloyd’s war-risk premium levels, and US Naval Forces Central Command advisories. These often precede operator decisions to halt traffic entirely.
- OPEC+ and Gulf producer export signals. Production commitments, re-routing via overland alternatives such as the UAE’s Habshan-Fujairah pipeline (which bypasses Hormuz, though its current operational scale remains unverified), and any signal that Gulf producers are curtailing exports due to security concerns.
Why diplomatic signals move prices faster than shipping data
- Diplomatic progress or breakdown language. AIS data reflects what has already happened to traffic. Diplomatic signals change the market’s probability distribution about what will happen next. The June ceasefire precedent, where brief progress triggered an approximately 3% single-session drop in Brent, demonstrates how quickly the market reprices on any credible path toward stabilisation. Conversely, the senior Iranian official’s declaration that Hormuz is a line Tehran will defend absolutely and that no US interference will be tolerated shifts tail-risk probabilities in the other direction.
Diplomatic signals have consistently outpaced physical shipping data in moving the crude price, with Brent falling approximately 5.1% in a single session in May 2026 as US-Iran negotiations entered an advanced phase, well before any tanker traffic restoration was confirmed.
- Refined product spreads relative to crude. Tracking diesel futures curves alongside crude gives a more accurate picture of how much logistics stress is priced in. The crude price reflects the probability-weighted macro outcome; the diesel spread reflects what is happening right now in physical delivery pipelines.
The investor who tracks these five inputs is watching the actual drivers of the market’s bet, not just the result on the WTI ticker. That distinction is the difference between anticipating price moves and reacting to them.
What the crude price is not telling you, and what to do with that
The core analytical argument across this piece reduces to one sentence: $79 crude is an elevated but bounded risk premium that reflects a specific bet, not complacency, and the diesel spread, AIS data, and cross-asset signals tell a more complete story than the crude headline alone.
Three things would need to happen for the market’s current bet to be proven wrong: sustained Threshold 3 closure with no interim reopenings, insurance withdrawal from Gulf calls, or a diplomatic breakdown with no visible path to stabilisation.
The Iranian official’s remarks framing Hormuz as an absolute limit Tehran will defend are the most concrete current signal that tail risk remains live. The June reopening produced an immediate approximately 3% Brent drop, illustrating the speed of repricing in both directions.
The current environment calls for monitoring the five indicators identified above rather than reacting to the crude headline. Portfolio positioning should account for the stagflationary channel, where higher energy costs, stickier inflation, and constrained policy rates create risks well beyond the energy sector itself.
“The crude price is not a verdict on the conflict. It is a bet that the worst-case scenario stays in the tail.”
The most useful framing is not where crude sits today but how fast it could move if one of those monitored indicators shifts decisively. The current price range was established under the assumption that disruption remains temporary. If that assumption breaks, the repricing will not wait for confirmation.
This article is for informational purposes only and should not be considered financial advice. Investors should conduct their own research and consult with financial professionals before making investment decisions. Financial projections and price estimates referenced are subject to market conditions and various risk factors. Forward-looking statements regarding conflict escalation and market impacts are speculative and subject to change based on developments.