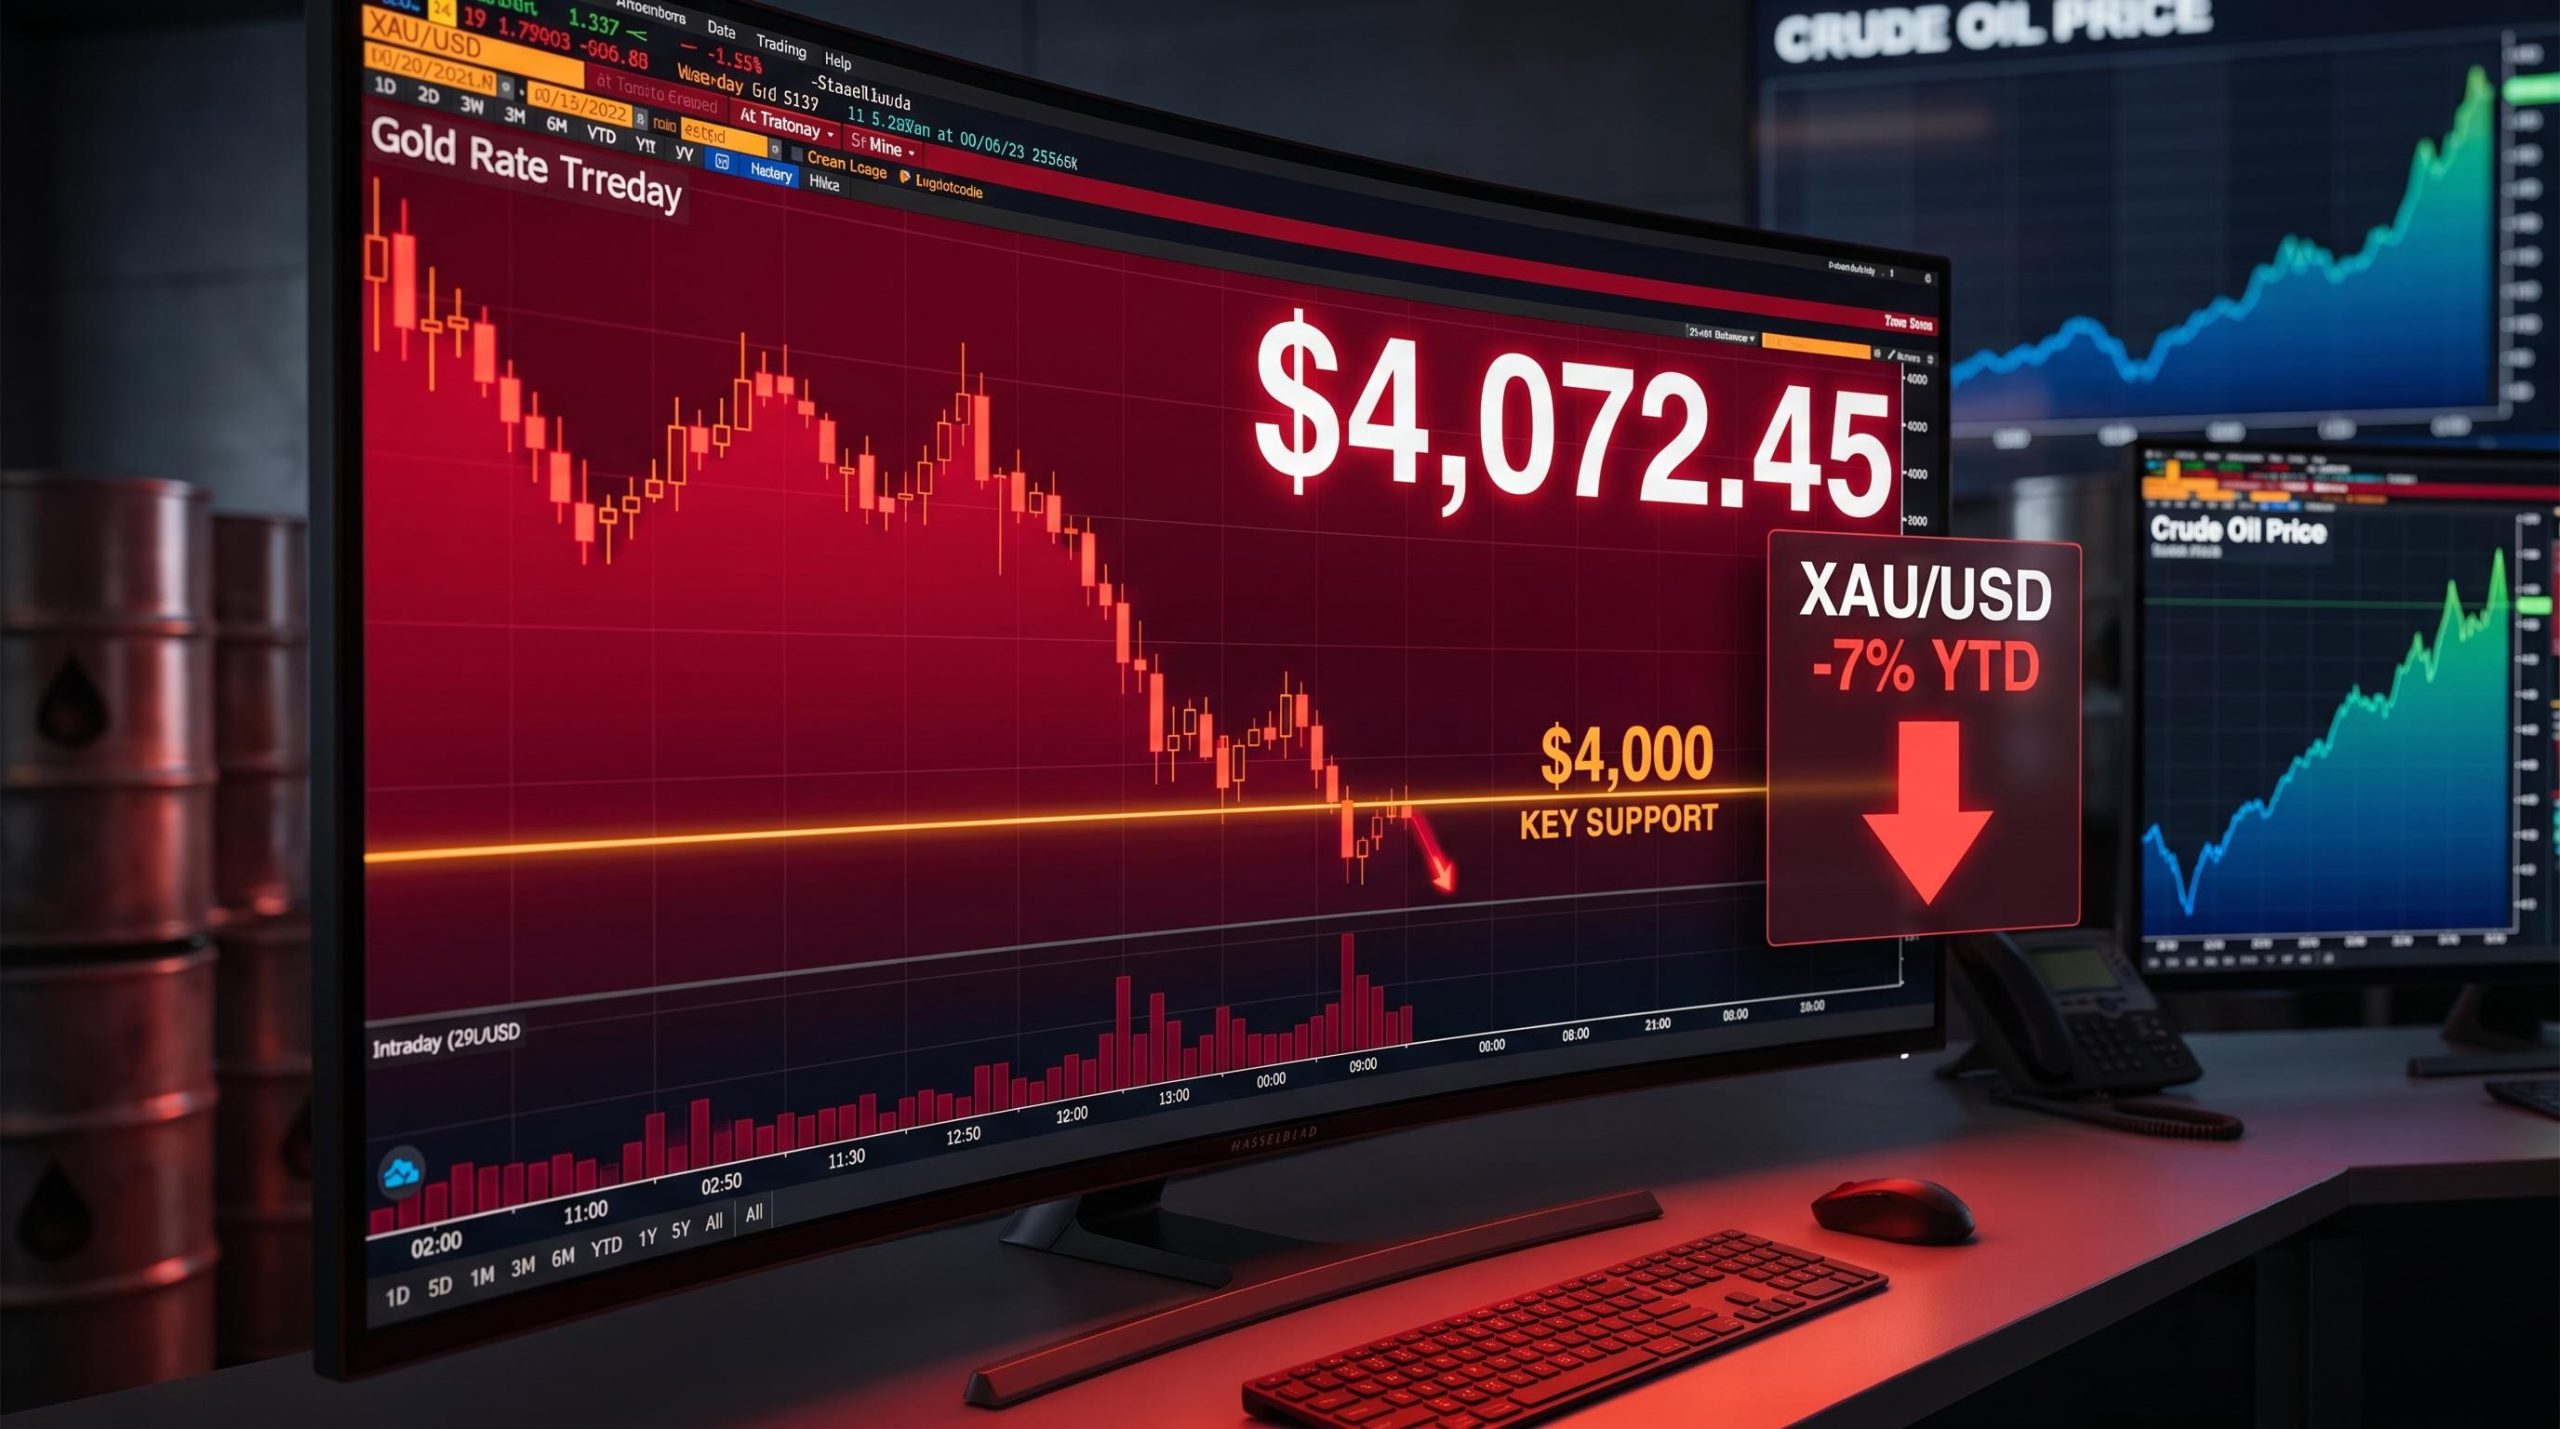
Spot gold dropped as low as $4,072 per ounce on Saturday 12 July 2026, sliding sharply after U.S. military strikes on Iran sent oil prices surging and reignited inflation fears that are now working directly against gold bulls.
The move cuts against the intuition that geopolitical conflict should drive investors into gold as a safe haven. Instead, Middle East escalation is flowing through an oil-inflation-dollar channel that strengthens the U.S. dollar and raises Treasury yields, making non-yielding assets like bullion less attractive precisely when headlines suggest they should be in demand. Gold was already down approximately 7% year-to-date before the weekend’s events added fresh pressure.
Here is exactly why gold is falling when conventional wisdom says it should be rising, what price levels matter right now, and what Wednesday’s CPI print and Fed Chair testimony will tell you about whether this slide continues or reverses.
Gold’s session low and what the price action actually shows
Gold tested the $4,072.45/oz intraday low on 12 July, a level confirmed across multiple data sources. Where it actually closed is less clear. The research layer places the closing spot price closer to $4,121.08/oz, with the daily decline at approximately 0.65%, while a separate source reported a close of $4,072.06/oz with a 1.19% decline. A global gold price feed showed spot in the $4,118-$4,122 range with a move of roughly -0.10% on the same day.
The conflict matters. An intraday test of a level is not the same as a confirmed close at that level, and anyone setting alerts or adjusting positions based on a specific closing price should verify before acting.
What is not in dispute is the direction. Key confirmed data points:
- Intraday low: $4,072.45/oz (confirmed across all sources)
- Approximate closing range: $4,118-$4,122/oz per global price feeds
- Prior week’s decline: approximately 1.3%
- Year-to-date performance: gold down approximately 7% at mid-year 2026
The price action tells you gold is under sustained directional pressure over multiple sessions, not just reacting to a single headline. The difference between an intraday probe and a confirmed closing breakdown is the difference between a market testing support and a market breaking through it.
When big ASX news breaks, our subscribers know first
Why Middle East tensions are hurting gold, not helping it
The instinct is straightforward: conflict breaks out, investors flee to safety, gold rises. That instinct is wrong in this episode, and the reason is the specific channel through which the stress is reaching financial markets.
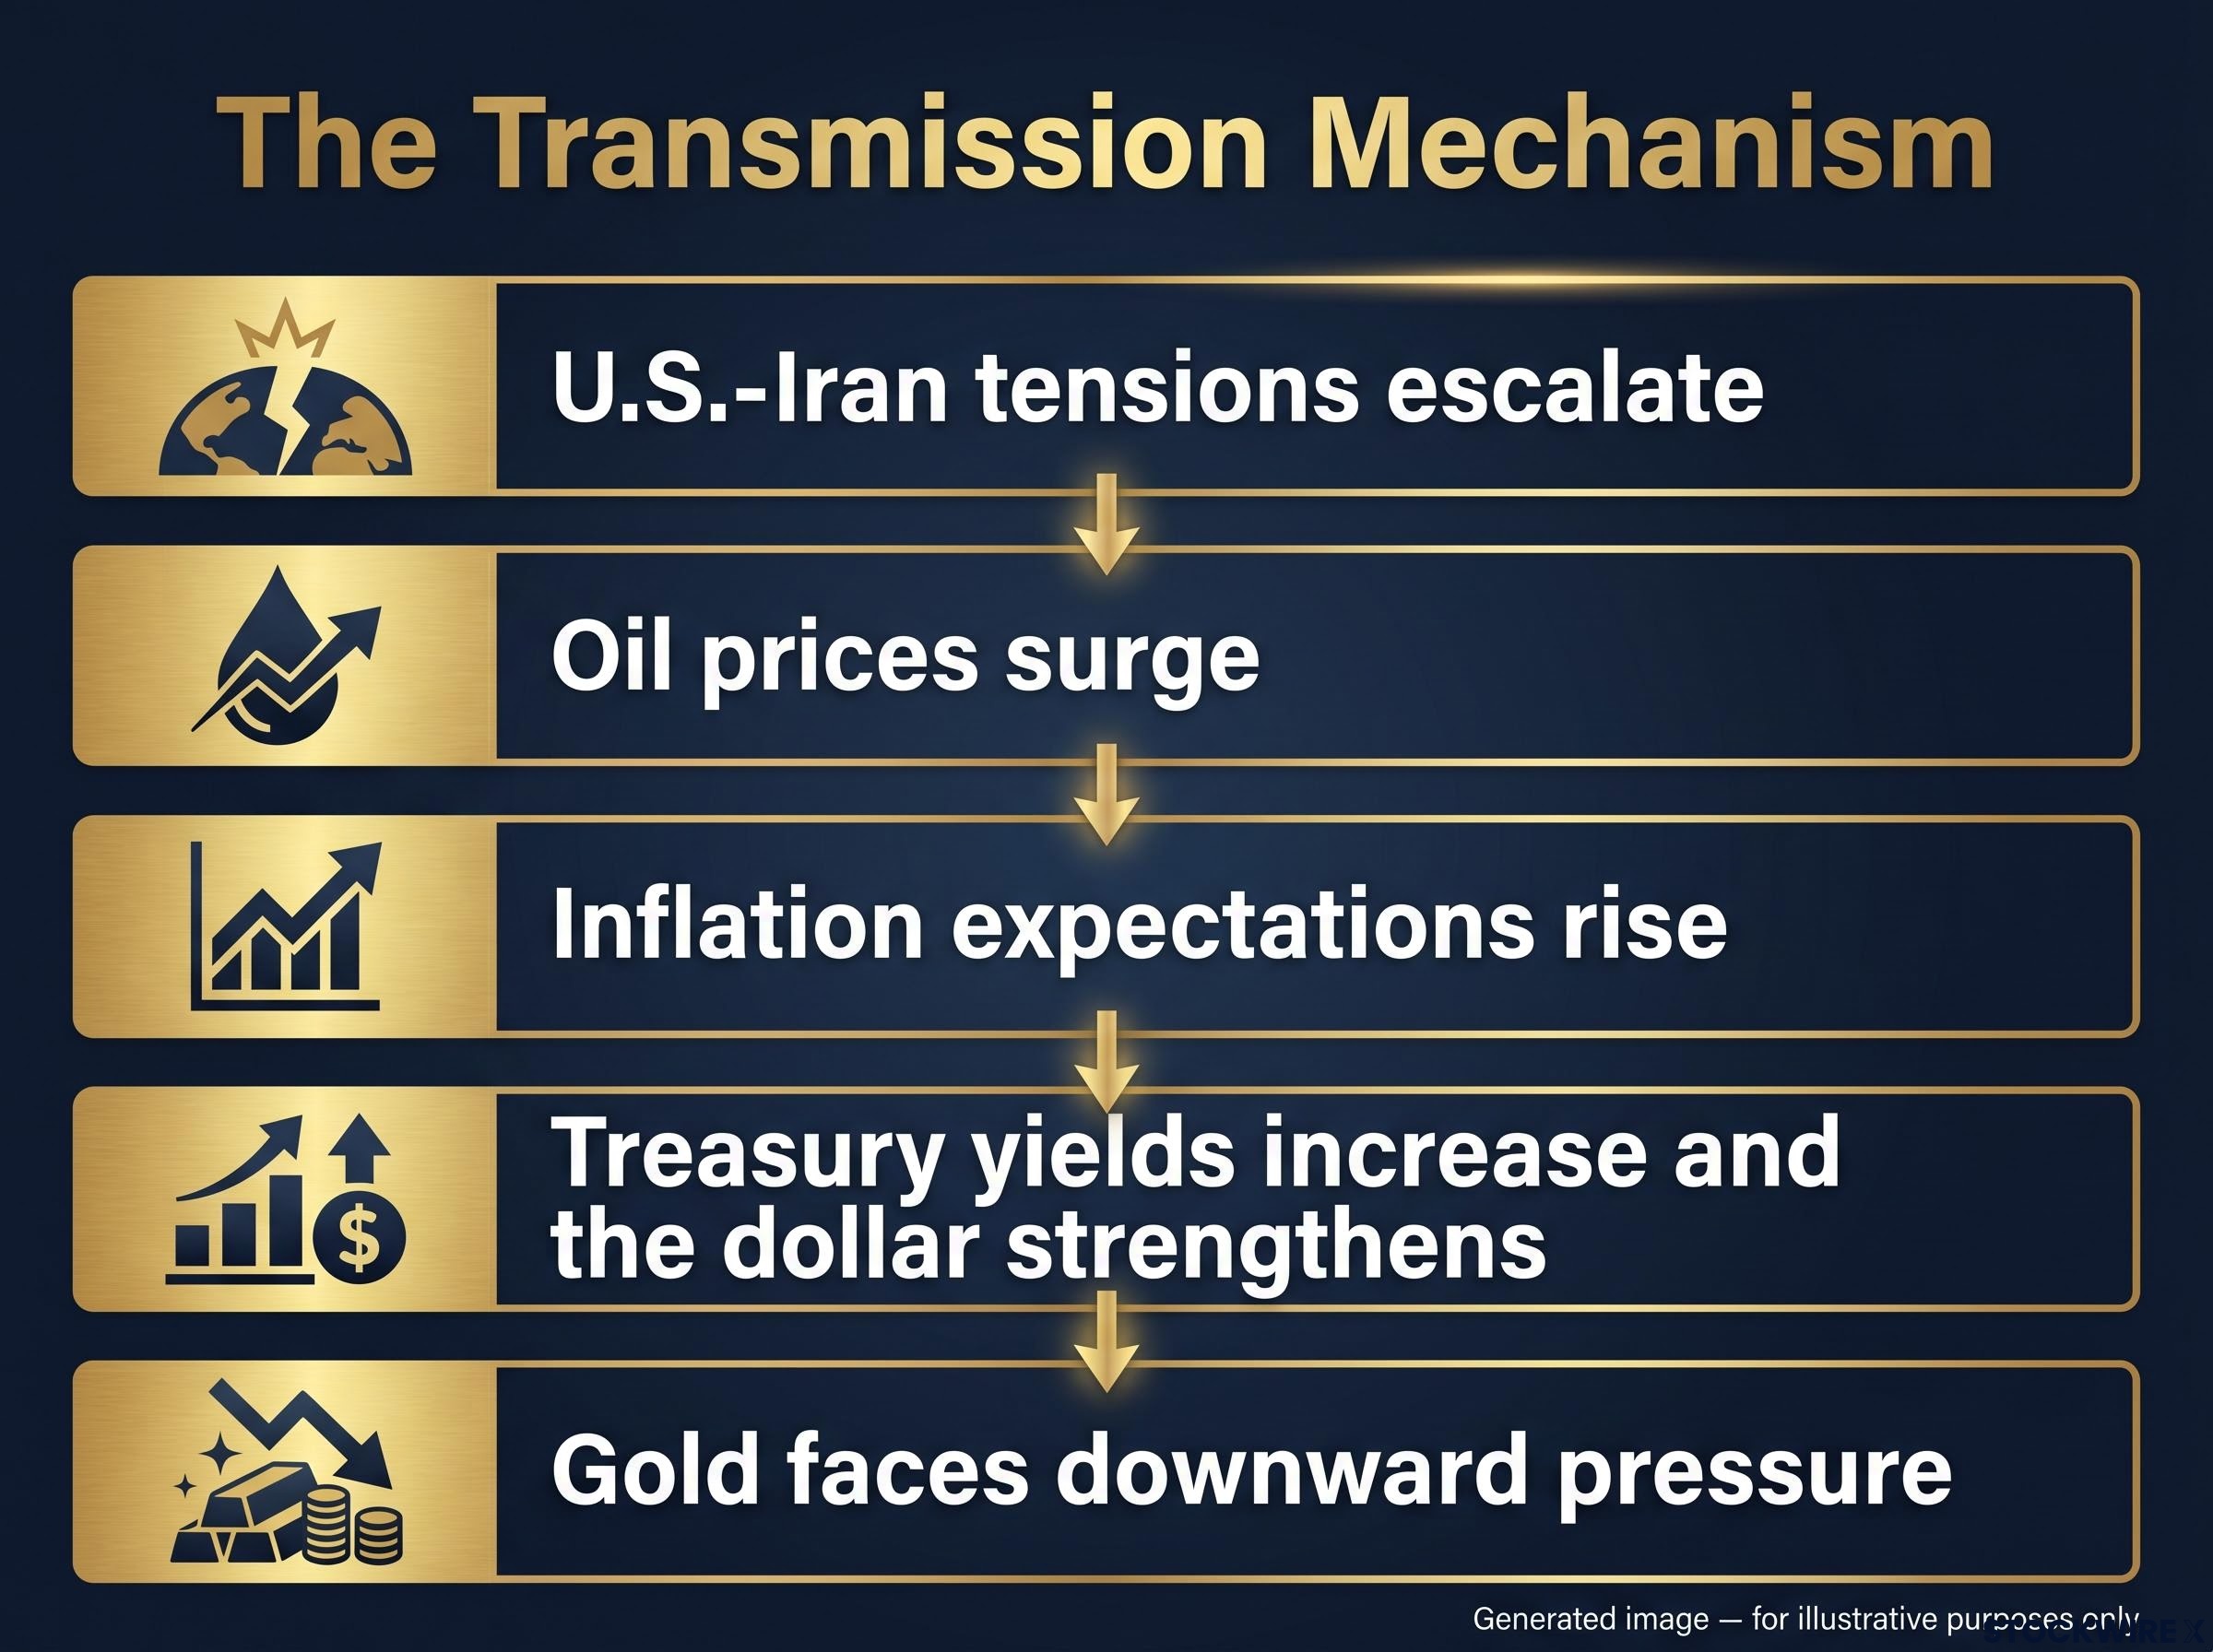
The transmission mechanism works in five steps:
- U.S.-Iran tensions escalate, raising the risk of sustained disruption to oil supply.
- Oil prices surge, reflecting supply concerns across Middle East shipping routes.
- Inflation expectations rise, as higher energy costs feed through to consumer prices and producer input costs.
- Treasury yields increase and the dollar strengthens, as markets price in a higher-for-longer interest rate environment and the dollar index gains from both safe-haven flows and yield differentials.
- Gold faces downward pressure, because it is a non-yielding asset, meaning it pays no interest or dividends, and its opportunity cost rises when bonds and cash offer higher returns.
Barchart macro commentary linked this episode directly to higher U.S. yields and a stronger dollar, with the dollar index supported by both safe-haven demand and yield differentials working in tandem.
The World Gold Council confirms that gold’s 2026 price path has been dominated by shifts in interest-rate expectations rather than raw geopolitical headlines alone.
The World Gold Council mid-year outlook for 2026 identifies shifting interest-rate expectations as the dominant driver of gold pricing, with geopolitical shocks acting as amplifiers rather than independent price catalysts when they feed through an inflation-and-yield channel.
For anyone holding gold as a geopolitical hedge, this is the distinction that matters. The channel through which conflict affects gold is as important as the conflict itself. A systemic fear shock, one that lowers the expected path of real yields, supports gold. An inflation shock, one that raises yields and the dollar, works against it. The current episode is doing the latter.
The oil-inflation transmission channel has triggered the same dynamic that unfolded when U.S. and Israeli strikes on Iran began in early 2026, when Fed rate repricing pushed Treasury yields roughly 60 basis points higher and proved a more powerful force on bullion than any safe-haven demand from the conflict itself.
The Fed dimension: how the “rate-is-done” trade is under threat
Gold’s rally to all-time highs above $5,500/oz intraday in early 2026 was not built on geopolitical fear. It was built on a specific market consensus: the Federal Reserve had finished tightening, and rate cuts were approaching.
That consensus is now fragile. At mid-year 2026, markets still price in at least one more Fed rate increase before year-end. The Fed’s dot plot, a chart showing where each Fed official expects rates to go, remains characterised as “slightly hawkish,” with projections split on the rate path through 2026. Gold’s approximately 7% year-to-date decline is consistent with that environment.
The June dot plot revision moved the Fed’s own year-end rate median from 3.4% to 3.8%, locking in at least one more 25 basis point hike as the committee’s baseline and providing the specific mechanism through which the hawkish shift has pressured non-yielding assets since mid-June.
“Hawkishness is not good for gold and silver,” one gold-sector specialist noted, with pullbacks tied explicitly to episodes where markets price in more aggressive Fed action.
Persistent energy price gains would compound the problem. Should oil costs remain high, the argument for holding rates at elevated levels grows stronger, and the door to further tightening opens wider. That is structurally negative for gold, because rising real yields increase the cost of holding an asset that generates no income.
The Fed narrative that drove gold to record highs is being tested at the same time as a geopolitical shock adds near-term noise. For gold holders, any data or testimony that makes additional tightening look more likely will directly extend this correction.
The price levels traders are watching right now
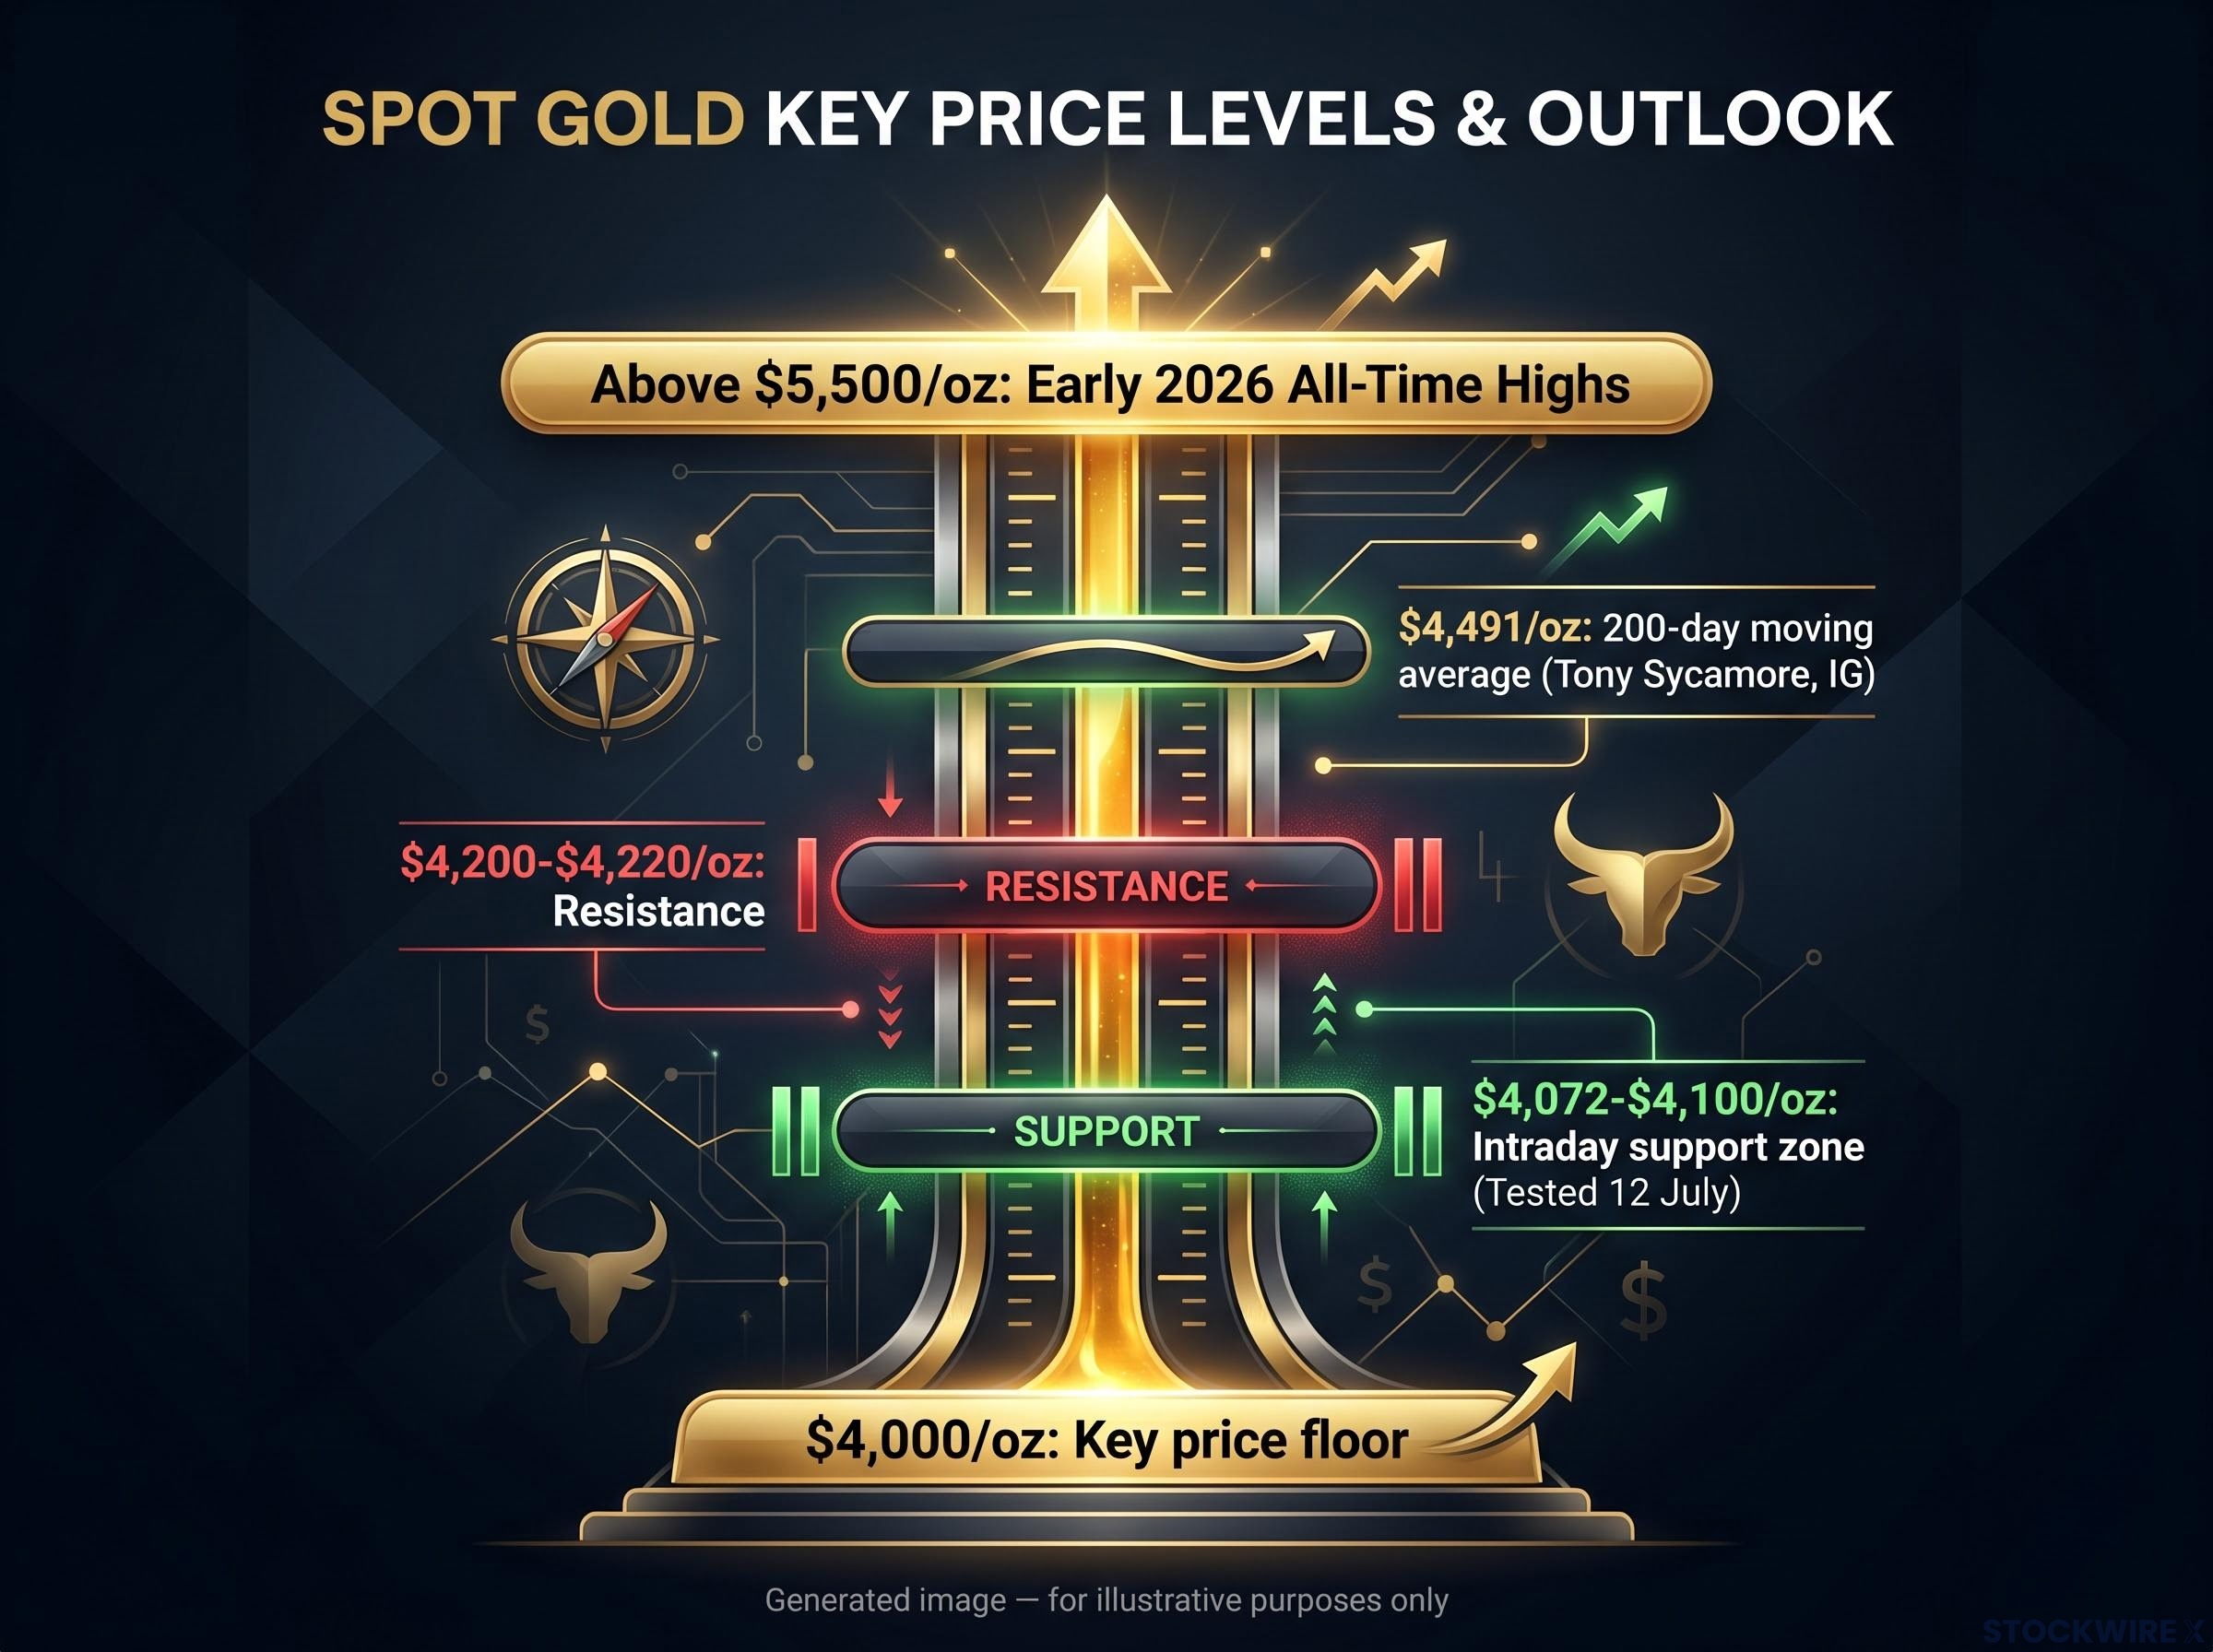
Four price levels are concentrating institutional attention, and the gap between them tells you where gold sits in its current range.
| Price Level | Role | Significance | Source |
|---|---|---|---|
| $4,000/oz | Key price floor | Widely referenced “line in the sand”; current prices are above but within striking distance | Institutional consensus |
| $4,072-$4,100/oz | Intraday support zone | Tested on 12 July; confirms market is probing lower support territory | Multiple price feeds |
| $4,200-$4,220/oz | Resistance | A closing break above this band would reinforce the broader recovery outlook | Tony Sycamore, IG |
| $4,491/oz | 200-day moving average | Next major upside target; consistent with a genuine trend resumption rather than a relief bounce | Tony Sycamore, IG |
The gap between current prices near $4,120 and the $4,491 200-day moving average (a technical indicator that smooths the price over the last 200 trading sessions to show the longer-term trend direction) tells you gold is not in recovery mode yet. The $4,000 floor is close enough that a further negative catalyst could force a genuine test of that level.
Wednesday is the pivot: CPI and Warsh testimony set the next direction
On Wednesday 15 July 2026, two scheduled events could determine gold’s next directional move: the U.S. Consumer Price Index (CPI) release and the first congressional testimony from Fed Chair Kevin Warsh.
Kevin Warsh’s forward guidance removal at the June FOMC meeting was the structural break that separated his chairmanship from the Powell era, replacing a data-conditional easing bias with a strict meeting-by-meeting framework that gives markets no reliable signal about the rate path beyond the next scheduled decision.
The combination creates a binary framework. The World Gold Council’s scenario modelling confirms that hawkish Fed messaging has repeatedly coincided with gold pullbacks, while dovish surprises have supported rebounds.
| Scenario | CPI Reading | Fed Signal | Dollar Direction | Gold Outlook |
|---|---|---|---|---|
| Hot CPI + Hawkish Warsh | Above consensus | Signals openness to further tightening | Stronger | Test of $4,000 support; correction extends |
| Soft CPI + Measured Warsh | Below consensus | Maintains patience; no hawkish escalation | Weaker | Relief rally toward $4,200-$4,220 resistance |
Wednesday’s data and testimony will tell you whether the current pullback is a brief correction within a larger uptrend or the beginning of a deeper breakdown toward $4,000. For anyone with gold exposure, it is one of the more consequential 24-hour windows for the metal in 2026.
What the correction changes, and what it does not
The structural drivers of gold’s multi-year uptrend are not affected by this weekend’s events.
What remains intact:
- Central bank buying from emerging markets, a primary source of demand since 2022, according to the World Gold Council
- Reserve diversification away from the dollar by non-Western central banks, a demand floor that is not rate-sensitive in the same way as speculative positioning
- The broader multi-year trend supported by structural reserve reallocation
What is under pressure:
- The Fed easing narrative that underpinned gold’s rally above $5,500/oz in early 2026
- Dollar weakness, which has reversed as the inflation-yield channel strengthens the greenback
- The assumption that inflation was moderating enough to allow rate cuts in the near term
The World Gold Council sees a path back toward $4,500/oz if rate expectations turn more dovish or if geopolitical stress shifts to a form that lowers real yield expectations rather than raising them. The current episode is doing the opposite.
The structural case for gold over a multi-year horizon remains intact. The timing of any recovery now depends on macroeconomic variables that Wednesday’s data will begin to clarify. Separating the cyclical headwinds from the structural foundation helps you avoid both overcorrecting on a short-term pullback and dismissing the real risks that could push prices toward $4,000 before any recovery materialises.
For investors assessing whether current levels near $4,120 represent a buying opportunity or a precursor to further losses, our deep-dive into gold’s H2 2026 outlook maps the specific price targets tied to the Fed’s October decision and explains why the World Bank’s $4,700 full-year average remains the most conservative major institutional anchor.
This article is for informational purposes only and should not be considered financial advice. Investors should conduct their own research and consult with financial professionals before making investment decisions. Past performance does not guarantee future results. Financial projections are subject to market conditions and various risk factors.
—