What the Broadcom Drop Reveals About AI Stock Valuations Now
3 hrs ago


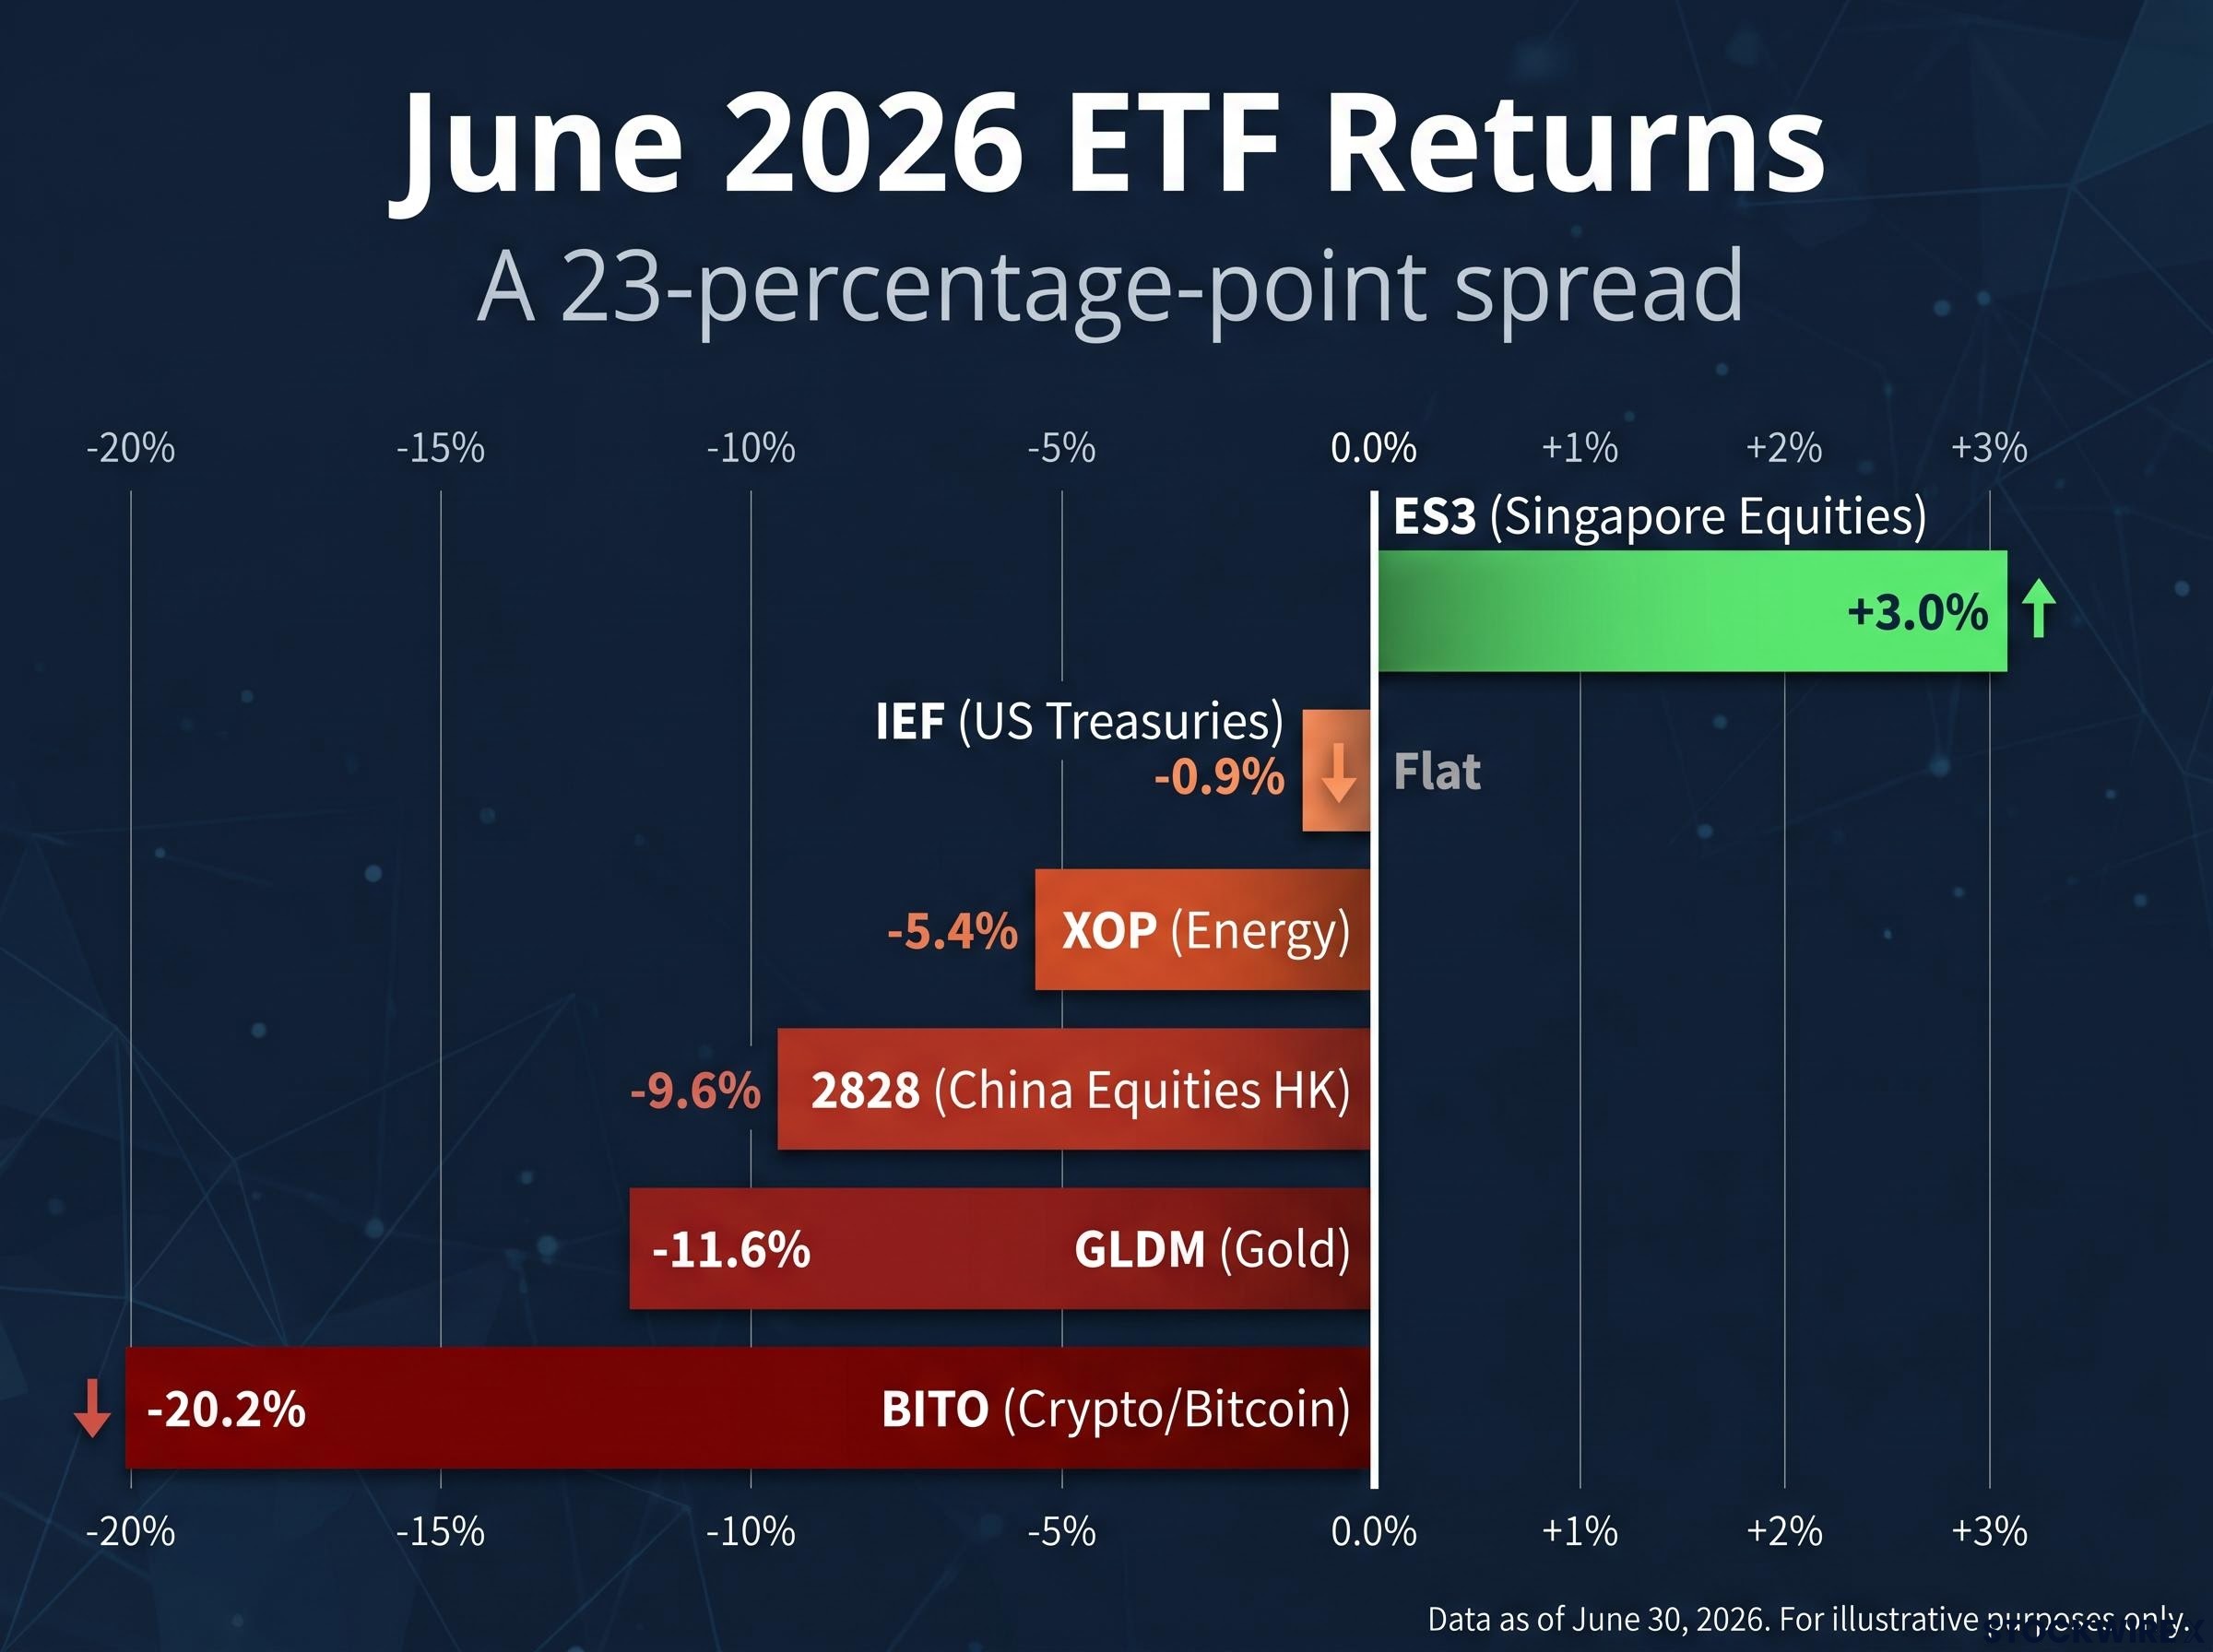
Seven major ETF categories reported their June 2026 returns this week, and the results span a 23-percentage-point range, from Singapore equities gaining 3% to Bitcoin-linked ETFs losing more than 20%. That kind of divergence inside a single monthly window is not noise. It is a structural signal about where different corners of the market sit in their respective cycles.
Phillip Securities Research published its monthly ETF review on 6 July 2026, covering US equities, Singapore equities, US Treasuries, gold, energy, China equities (Hong Kong-listed), and cryptocurrency. For investors reassessing ETF exposure at the start of Q3, the review provides a rare cross-asset snapshot at the moment most asset classes are entering a digestion phase.
Here is the full performance picture, the support levels that separate genuine consolidation from renewed breakdown, and the one segment where no stabilisation is in sight. Use it to calibrate your own ETF market outlook and positioning before July develops further.
The best way to read June is not ETF by ETF but as a spread. ES3 gained 3.0% while BITO dropped 20.2%. Everything else fell somewhere in between, and the distribution was not random. It followed a pattern: assets on multi-month winning streaks held up, assets on multi-month losing streaks got worse, and the one asset with the deepest momentum problem (crypto) accelerated its decline.
| ETF | Asset Class | June Return | Monthly Trend |
|---|---|---|---|
| ES3 | Singapore Equities | +3.0% | Third consecutive gain |
| IEF | US Treasuries | Flat | Stable |
| VOO | US Equities | -0.9% | Ended two-month win streak |
| XOP | Energy | -5.4% | Third consecutive decline |
| 2828 | China Equities (HK) | -9.6% | Second consecutive decline |
| GLDM | Gold | -11.6% | Fourth consecutive decline |
| BITO | Crypto (Bitcoin) | -20.2% | Second consecutive sharp decline |
BITO: -20.2% across a single calendar month, extending what is now a two-month run of heavy losses. The next worst performer in this review did not come close to half that drawdown.
The streak data matters as much as the monthly return. GLDM on its fourth consecutive monthly loss is in a structurally different position from VOO, which slipped for the first time after two months of gains. If you are weighting exposure decisions off a single month’s number, you are missing the momentum context that actually shapes where each asset goes next.
The 23-percentage-point spread between ES3 and BITO in a single month is only legible if you have a firm grip on ETF mechanics, specifically how an ETF’s price tracks its underlying assets and why liquidity conditions can amplify moves in thinly traded categories like crypto.
The Phillip Securities analysis projects six of the seven ETFs reviewed to enter or remain in range-bound consolidation during July. Only BITO receives a continued bearish forecast. Before that distinction means anything actionable, consolidation itself needs a precise definition.
Market consolidation is a period of range-bound price action following a directional move. Buyers and sellers reach a temporary equilibrium: selling pressure pauses, but buying conviction has not arrived with enough force to reverse the preceding trend. The price drifts sideways within a defined band rather than trending up or down.
The distinction that matters here is between consolidation and a confirmed bottom. Consolidation means the selling has paused. It does not mean the downtrend has reversed. For position-sizing decisions, that difference is significant: adding aggressively into a consolidation phase carries the risk that the range resolves to the downside rather than the upside.
IEF provides the clearest example. The Treasury ETF has spent the better part of four months moving horizontally, confined to a band of roughly US$93.40 to US$95.40 that has held firm since around mid-March 2026. That is what prolonged consolidation looks like in practice: no trend, no breakout, just range.
For your own positioning, a “consolidation expected” call carries three practical implications:
Each consolidation forecast comes with a price level that separates “digestion” from “deterioration.” These are not passive reference points. They are the thresholds where your thesis about each position gets confirmed or invalidated.
| ETF | Support Level | What a Break Below Signals |
|---|---|---|
| IEF | US$93.40-US$95.40 | Exit from four-month range; renewed downside in Treasuries |
| GLDM | US$77.50 | Breach of October 2025 swing low; fresh leg lower in gold |
| XOP | US$148-US$154 | February 2026 resistance fails as support; bear trend intact |
| 2828 | HKD$74.65-HKD$77.10 | Former Oct 2024-Feb 2025 resistance collapses; further correction |
The GLDM level deserves particular attention. Four consecutive months of losses have driven the gold ETF down to a level last tested in October 2025. That US$77.50 swing low is not just a line on a chart; it is the point where the current decline either finds a floor or confirms that gold’s correction has further to run.
VOO’s single-month slip after two consecutive gains also sits within a broader pattern: the S&P 500 breadth divergence documented in mid-May 2026, where the index traded 8.5% above its 50-day moving average while fewer than half of its constituents did the same, flagged the kind of top-heavy momentum that historically precedes consolidation rather than clean continuation.
GLDM: Four consecutive months of losses, with US$77.50 (the October 2025 swing low) as the level that separates consolidation from a fresh downside leg.
For XOP and 2828, the support zones carry a notable technical characteristic: both price areas acted as ceilings during earlier rallies before the ETFs eventually cleared them. According to Phillip Securities Research, having broken through that resistance on the way up, those same zones are now expected to absorb selling pressure on the way down. If they hold, the consolidation thesis is validated. If they break, each ETF’s multi-month decline is likely to extend.
What this means for you practically: these four levels are your July monitoring checklist. As long as prices stay above them, the consolidation read holds. A break below any of them is a signal to reassess rather than hold through.
ES3 earned its position as the standout. A 3.0% gain in June, its third consecutive monthly advance, made Singapore equities the clear outperformer across every asset class in the review. That is not a marginal lead; it is the only ETF in the group with sustained positive momentum.
The question is what comes next, and Phillip Securities Research’s answer is measured. Three consecutive months of gains have carried the ETF to the price levels analysts had set as targets, and the July outlook shifts accordingly to consolidation rather than further advancement.
That shift in outlook changes the positioning calculus depending on where you sit:
Three consecutive monthly gains that carry an ETF to its analyst target price is a signal that the position has done its work. The question at this point is about protecting gains, not chasing further upside. If you are fully weighted in ES3, July is the month to think about trimming rather than adding.
Every other ETF in this review received some version of the same July forecast: consolidation, range-bound, stabilisation expected. BITO did not.
June’s 20.2% drop was the crypto-linked ETF’s second successive month of substantial losses, and the Phillip Securities analysis sees no floor forming yet. Rather than forecasting a pause in selling, it projects the bearish trend continuing into July, with price potentially working its way back down to the August 2024 swing low in the vicinity of US$7.44, a move that would represent roughly 6-7% additional downside from where the ETF stood at the time of the analysis.
The divergence between BITO’s 20.2% monthly drop and GLDM’s comparatively contained decline also reflects a longer-running debate about Bitcoin as an inflation hedge, a role the 2022 episode tested decisively when gold held stable while Bitcoin lost roughly 77% of its value in an environment of rising prices.
BITO downside reference: approximately US$7.44 (August 2024 swing low), implying around 6-7% of further decline measured from analysis-date pricing. Treat this as a technical marker rather than a guaranteed stopping point.
When every other asset class in a multi-asset review is flagged for consolidation and one is flagged for continued decline, that asymmetry is the most important signal in the entire report. If you hold crypto-linked ETF exposure, three positioning principles apply:
Two consecutive months of 20%-plus losses in a segment where no stabilisation is forecast is not a contrarian opportunity. It is a prompt to review your risk management.
The cross-asset picture heading into July is unusually legible. Six of seven ETFs are in consolidation mode with defined support levels. One is in continued decline with a specific downside target. That consensus is rare, and it shapes what kind of month this is likely to be.
The 23-percentage-point performance spread across just seven ETF categories in a single month is also a useful lens on 2026 market volatility more broadly, a year where the gap between implied and realised volatility has consistently been wider than the actual daily price moves justify.
For most of the ETF universe, July is a month for position maintenance and threshold monitoring, not aggressive new entries or panicked exits. The analytical work shifts from directional calls to watching whether identified support levels hold or break.
Your July monitoring checklist:
Knowing which levels to watch, and what a breach at each one means, is what separates informed positioning from reactive decision-making. The levels are set. The month will tell you whether the consolidation thesis holds or whether fresh directional trades emerge.
This article draws on analysis from Phillip Securities Research’s monthly ETF review, auto-generated via PhillipGPT, published 6 July 2026.
This article is for informational purposes only and should not be considered financial advice. Investors should conduct their own research and consult with financial professionals before making investment decisions. Past performance does not guarantee future results. Financial projections are subject to market conditions and various risk factors.
ETF consolidation is a period of range-bound price action after a directional move, where selling pressure pauses but buying conviction has not arrived with enough force to reverse the trend. It means holding existing positions and monitoring support levels rather than adding aggressively or exiting defensively.
ES3, the Singapore equities ETF, was the top performer in June 2026 with a 3.0% gain, its third consecutive monthly advance and the only ETF in the Phillip Securities review with sustained positive momentum.
BITO fell 20.2% in June 2026, extending what was already a second successive month of heavy losses, with Phillip Securities Research projecting the bearish trend to continue into July with a potential downside target of approximately US$7.44 (the August 2024 swing low) and no near-term floor identified.
The key support levels to monitor are US$93.40 for IEF, US$77.50 for GLDM, US$148-US$154 for XOP, and HKD$74.65-HKD$77.10 for 2828; a break below any of these levels signals the consolidation thesis has failed and the downtrend is likely to extend.
GLDM, the gold ETF, fell 11.6% in June 2026, marking its fourth consecutive monthly decline and bringing prices down to the October 2025 swing low of US$77.50, the level that separates continued consolidation from a fresh leg lower.