Why Australian Investors Keep Repeating the Same 4 Mistakes
3 hrs ago

Brent crude above $110. Inflation at 4.2%. A Federal Reserve in leadership transition. A major North American trade agreement under formal review. And a 14.1% quarterly gain for global equities.
That collision of conditions defined Q2 2026. The quarter closed on 1 July, and the United States-Mexico-Canada Agreement (USMCA) review concluded on 2 July, meaning two of the three dominant risk narratives resolved within the same 48-hour window. Published the day after both events, this is an unusually clean moment to assess what actually happened versus what the financial media coverage suggested was at stake.
The 14.1% return is the headline. But understanding why three concurrent risks failed to derail global stock market performance is more valuable than the number itself. The same analytical framework that explains Q2’s outcome applies the next time the news cycle fills with urgent-sounding warnings, and that is what this piece delivers.
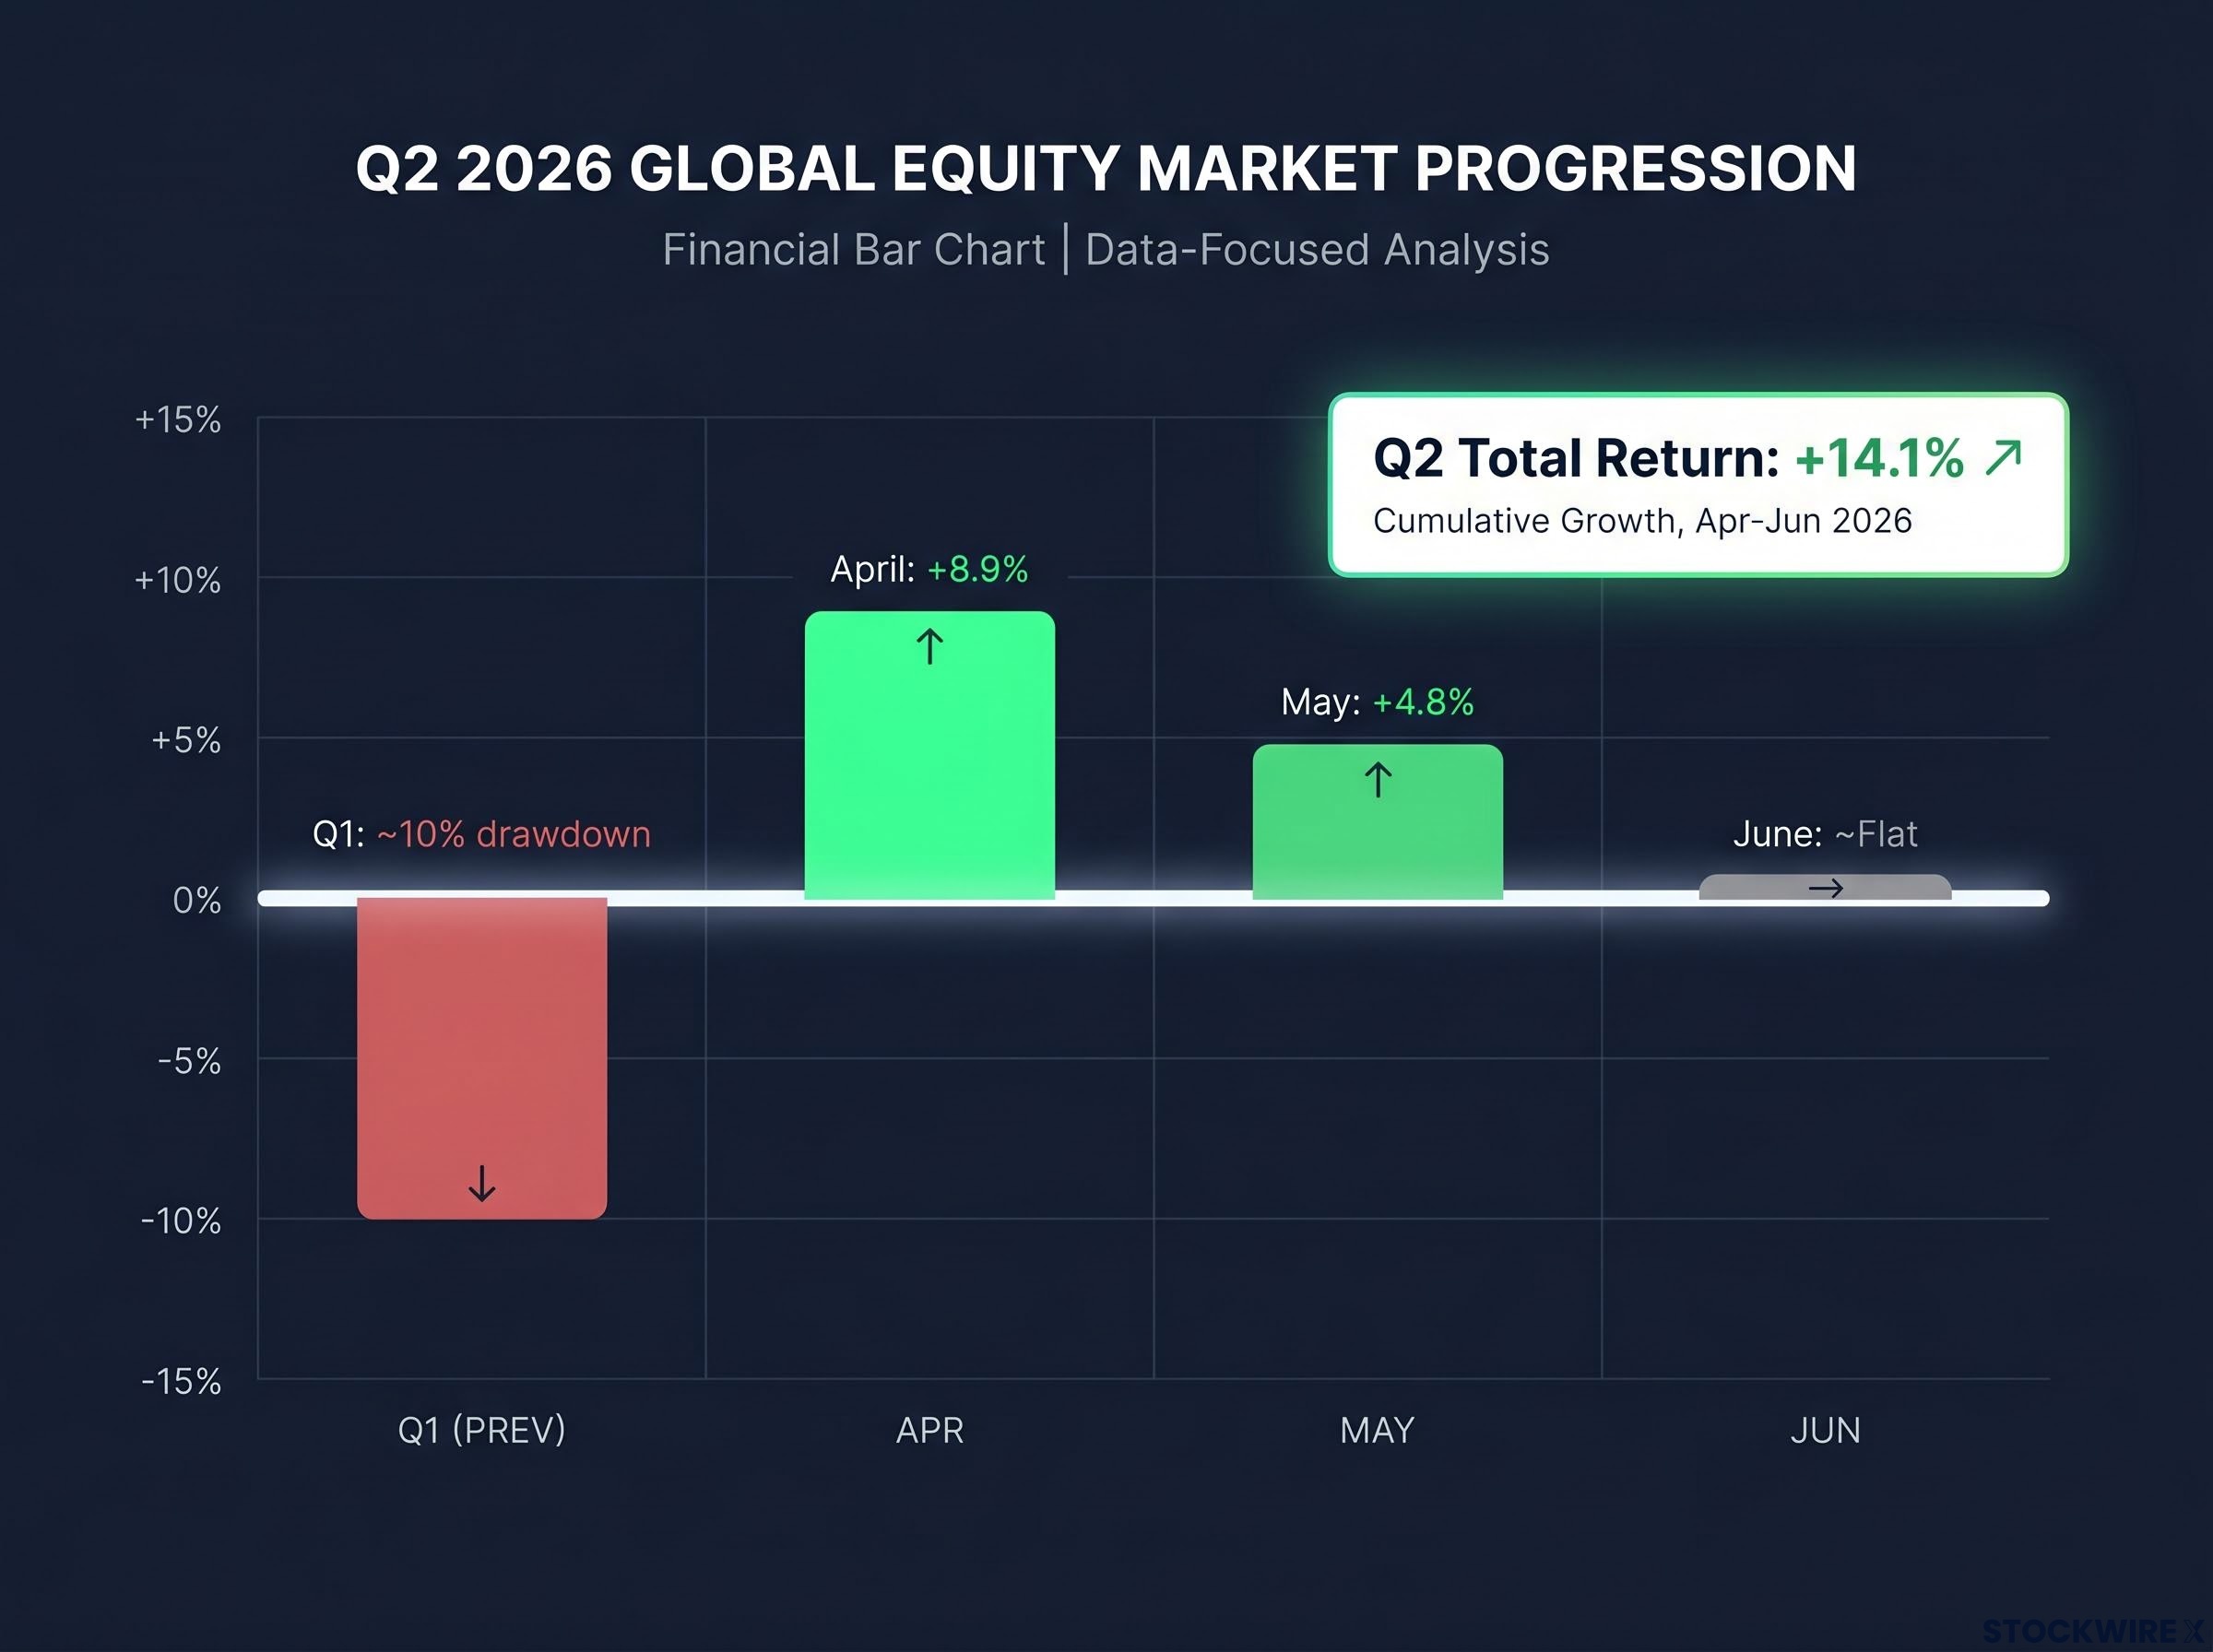
Q2 2026 was not a single upward line. It moved in three distinct phases, and recognising their shape matters more than the final tally.
April delivered approximately 8.9%, the sharpest monthly gain. That was not an anomaly. It was recovery momentum following Q1’s near-correction, when global equities came close to a 10% drawdown. The snapback was structural, not speculative.
May added approximately 4.8%. The pace slowed, but the direction held. By this point, two of the quarter’s three headline risks were being steadily absorbed into pricing.
June ended roughly flat. Technology sector weakness was the primary source of within-quarter turbulence, trimming the monthly return toward zero while leaving the earlier gains intact.
| Month | Approximate return | Notable driver |
|---|---|---|
| April 2026 | +8.9% | Recovery from Q1 near-correction |
| May 2026 | +4.8% | Continued broad-based strength |
| June 2026 | ~Flat | Technology sector retreat |
| Q2 Total | +14.1% |
Most investors experience markets month by month, not as tidy quarterly summaries. An investor who reacted to June’s wobble, interpreting the Technology-led pullback as the start of something worse, would have surrendered the full 14.1% result. The quarterly number rewards those who stayed positioned through all three acts, not those who tried to time the intermission.
The Iran conflict and the disruption to maritime shipping through the Strait of Hormuz (the narrow waterway through which roughly a fifth of the world’s oil supply passes) dominated energy headlines for the first half of 2026. Brent crude reached a peak above $110 per barrel in March 2026, driven by fears over supply disruption, and that proved to be the high-water mark for the move. Through April and into early May, prices stayed choppy, before a sustained decline carried Brent back to around $72 per barrel by the close of June 2026, broadly in line with where it had traded before the conflict began.
Brent crude moved from above $110 per barrel in March to approximately $72 by end of June, completing its full shock-and-normalisation cycle within a single quarter.
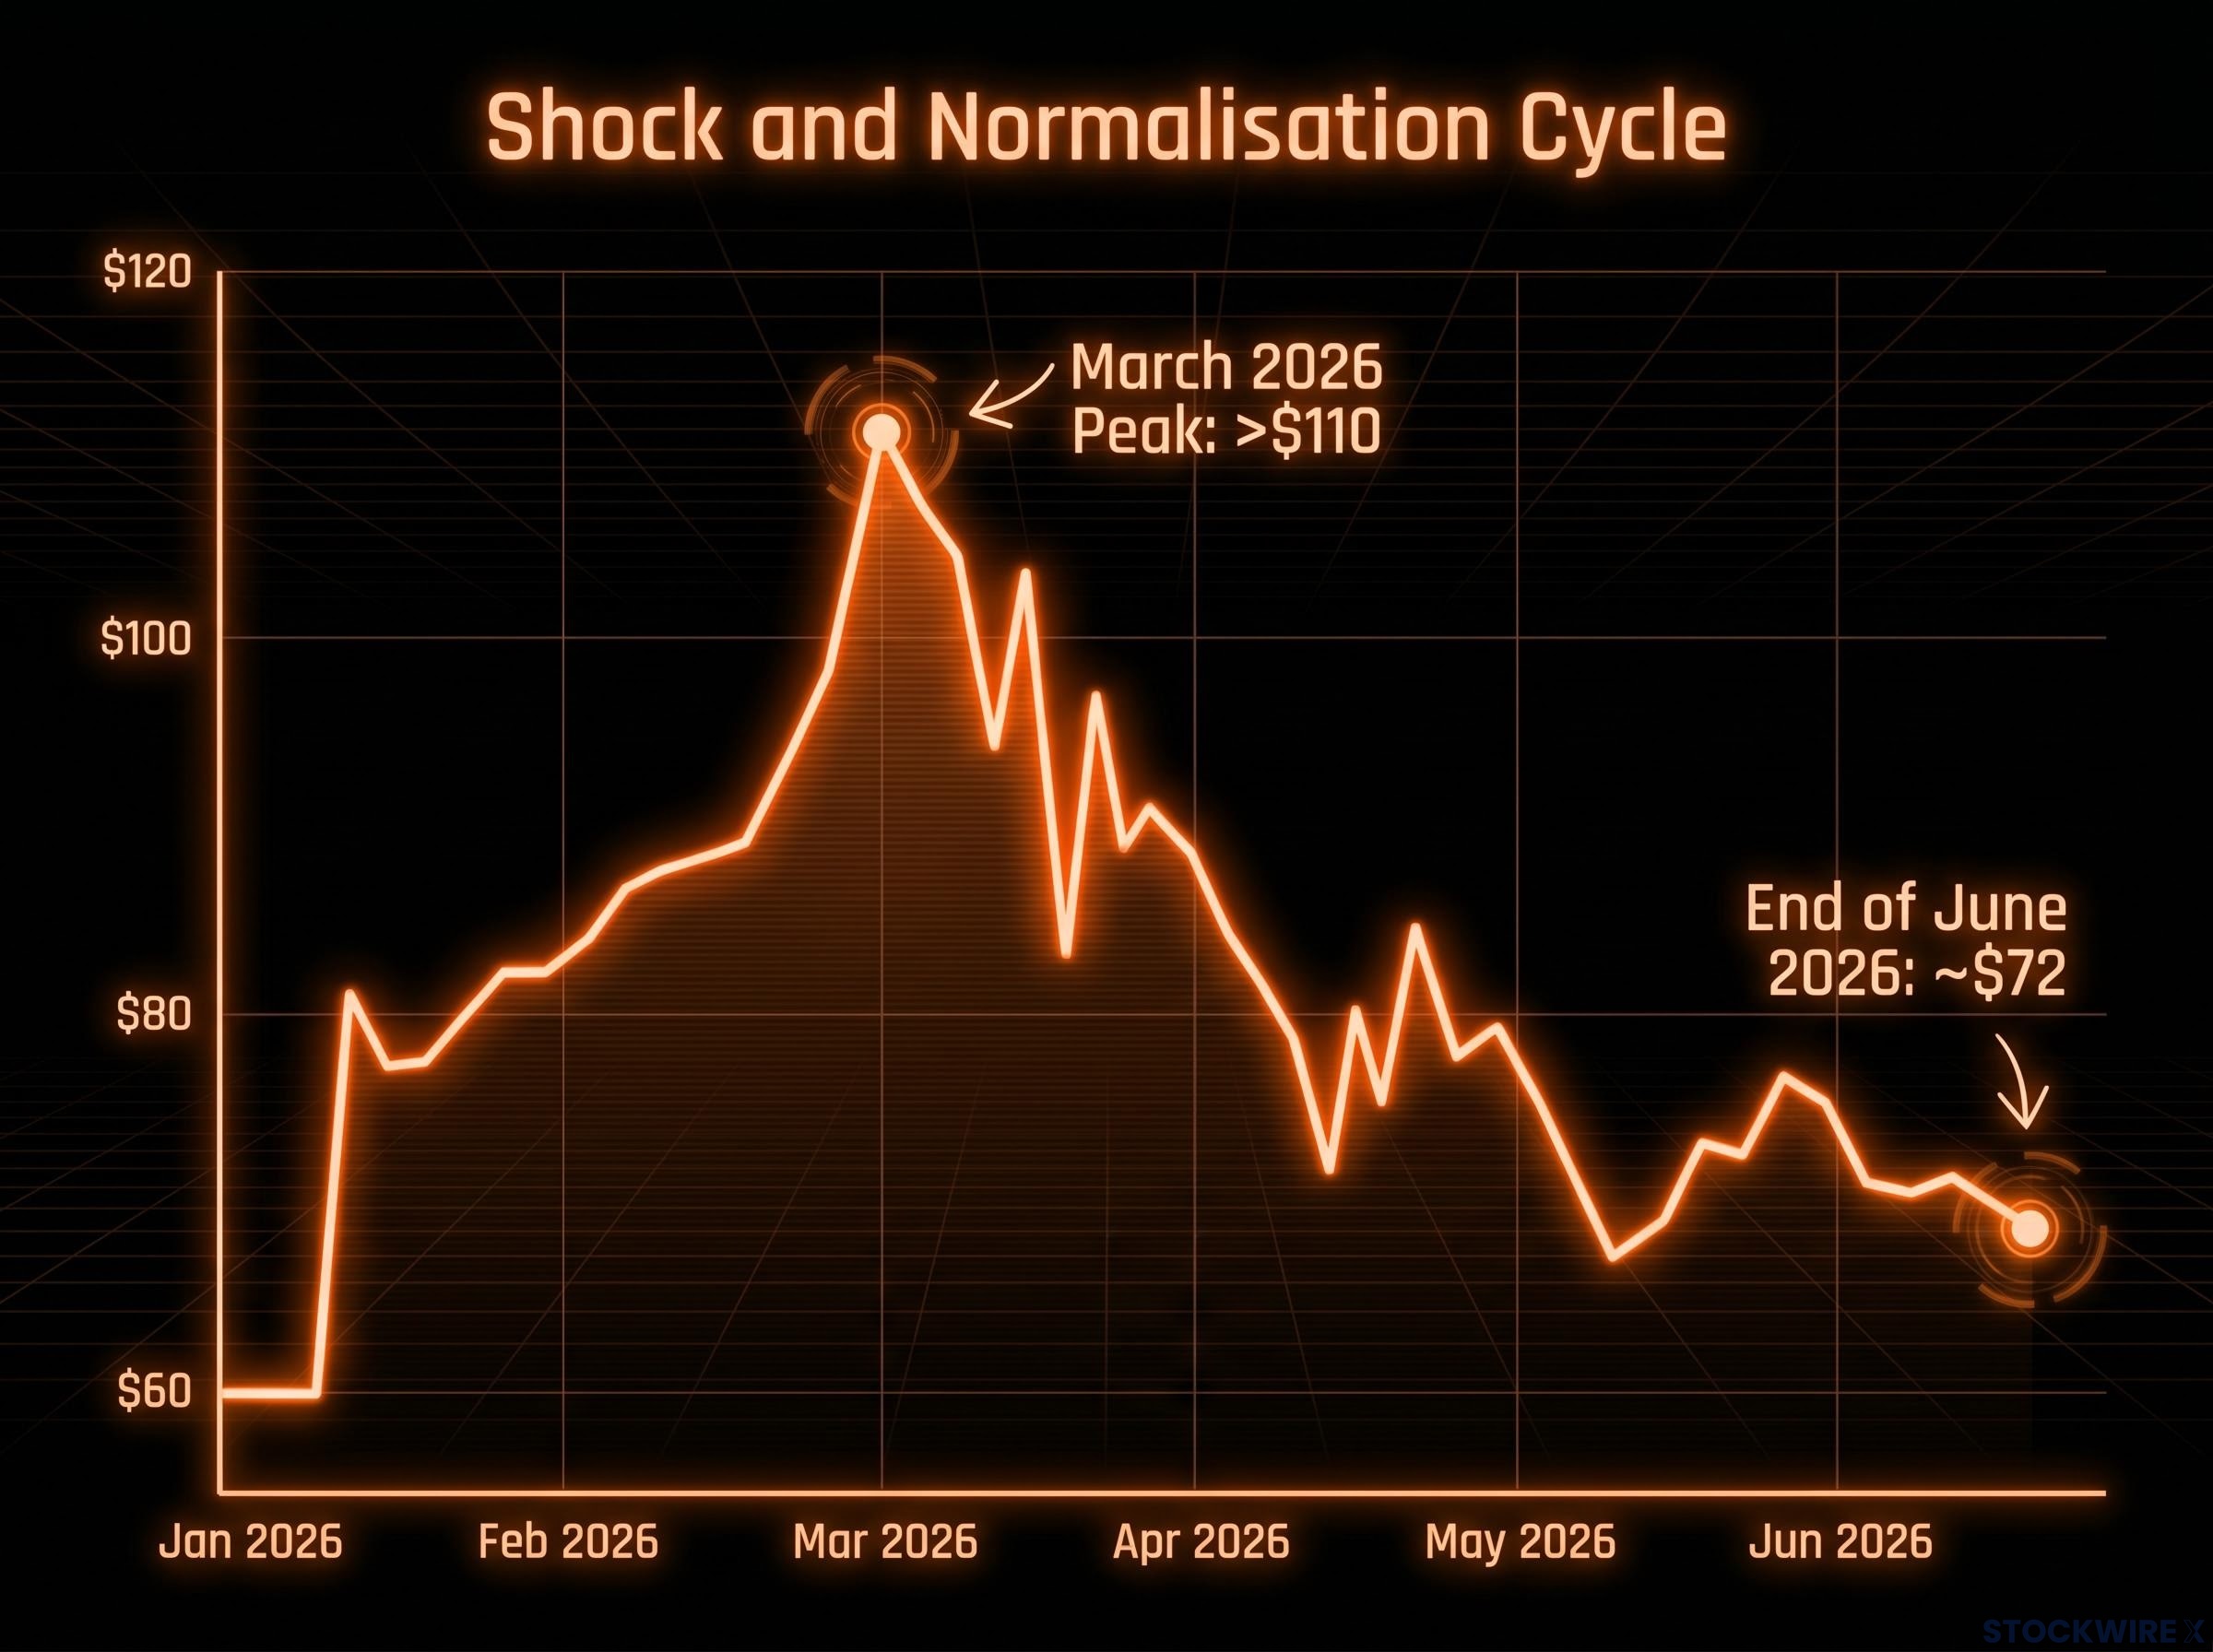
The normalisation was not luck. Geopolitical commodity shocks tend to spike fast because they price in the worst-case supply disruption immediately. As the actual disruption proves narrower than feared, prices recalibrate downward, often within a single quarter. The pattern is predictable even when the specific trigger is not.
Hormuz throughput constraints were transmitting through oil prices into inflation expectations and central bank signalling simultaneously, with vessel traffic reduced to a fraction of normal capacity at the shock’s peak in May 2026, which is precisely why the subsequent normalisation carried such force when actual supply disruption proved narrower than priced.
What this tells you is that a diversified equity portfolio has structural buffers against sector-level energy stress. Global equities gained 14.1% in the same quarter that oil staged its most dramatic price spike in years. The two outcomes coexisted because equity markets are broader than any single commodity input, and the energy sector’s pain was offset by strength elsewhere.
There is a consistent principle that explains why all three of Q2’s headline risks failed to derail equity returns. It works like this: as a risk receives widespread media coverage, markets progressively incorporate it into pricing. Each new article, each analyst note, each investor conversation about the risk reduces its remaining capacity to generate a negative surprise. By the time a concern dominates financial media, much of its downside has already been absorbed.
This principle, sometimes called the “wall of worry” (the idea that bull markets tend to climb while investors worry about widely discussed risks), operated consistently across Q2’s three dominant themes:
The corollary is equally important: what actually moves stock prices is what has not been priced in. Surprises from unexpected quarters, not the headlines dominating your news feed, are the primary source of market-moving events. The volume of media coverage on a risk is, counterintuitively, inversely related to that risk’s remaining ability to surprise markets downward. That reframes how you should interpret future news cycles.
Negativity bias in financial media is not incidental; negative headlines outnumber positive ones by approximately 17 to 1, a ratio produced by engagement optimisation rather than informational accuracy, which is why the volume of coverage on a given risk is a poor guide to that risk’s remaining market-moving capacity.
The USMCA came into force in July 2020, succeeding the North American Free Trade Agreement, and carries a 16-year term with a scheduled end date of 2036. The agreement’s design includes a mandatory six-year checkpoint, and that first formal review fell due on Wednesday, 2 July 2026, the day before this article was published.
| Milestone | Date | Significance |
|---|---|---|
| USMCA enacted | July 2020 | Replaced NAFTA; 16-year structure established |
| Six-year review deadline | 2 July 2026 | First mandatory joint review checkpoint |
| Scheduled expiration | 2036 | Subject to annual reviews through expiration |
The Trump administration declined to extend the agreement, subjecting it to annual reviews through its 2036 expiration. Because the review had been on the calendar for years and trade policy had occupied the headlines for an extended period, markets had progressively discounted the range of plausible outcomes long before the deadline arrived, which left little residual power to move prices when the conclusion was announced.
The Brookings analysis of the USMCA review mechanism confirms that Canada and Mexico agreed to extend the agreement while the United States declined, triggering annual joint reviews under Article 34.7 through to the agreement’s 2036 expiration, precisely the lower-stakes outcome markets had progressively priced in.
The deeper point is structural. The economic integration among the US, Mexico, and Canada is too embedded to be materially disrupted by the formal agreement’s review mechanics, regardless of political framing. Trade flows between these three economies operate on infrastructure, supply chains, and contractual relationships that exist independently of the agreement’s review schedule.
Widely anticipated policy outcomes lose their market-moving power as coverage intensifies. By the time a trade headline dominates the news cycle, markets have already priced in the range of plausible results.
The USMCA conclusion, landing in the same 48-hour window as Q2’s close, is a real-time test of this principle. The equity market’s verdict, a 14.1% quarterly gain, tells you everything about how much that headline actually cost investors: nothing.
Investors entering April were not in a comfortable position. Q1 had brought global equities to the edge of a formal correction, and the instinct to reduce exposure after that kind of drawdown is strong. It is also, historically, costly.
That sequence is not a coincidence. It is the pattern. The moment of maximum discomfort tends to sit immediately adjacent to the sharpest recovery, which is what makes reactive selling structurally costly. An investor who reduced exposure in late Q1 missed April’s 8.9% snap-back, and there was no second chance to capture it.
Research on reactive selling at the worst moment shows the damage is not evenly distributed: approximately 30.9% of investors who panic-sold during a major drawdown never re-entered equities, permanently forfeiting participation in subsequent recoveries, which explains why Q1’s near-correction followed immediately by April’s 8.9% gain is such a structurally costly sequence for those who acted on the discomfort.
June’s Technology-led wobble repeated the test on a smaller scale. Within-quarter volatility briefly made the quarter’s gains feel fragile, and an investor who interpreted that wobble as the start of a reversal would have stepped out of the way of a 14.1% total return. The cost of reacting was the return itself.
This is not a prescription. It is a pattern visible in the data. Investors who maintain discipline through periods of volatility tend, over time, to be rewarded. Q2 2026 is a particularly clean illustration of why.
Q3 begins with a meaningfully different risk map than the one investors faced in April. Two of Q2’s three headline concerns are now resolved or substantially de-risked.
Resolved entering Q3:
Open variables to watch:
The market’s attention will rotate toward whatever the next widely discussed concern becomes. When it does, you should apply the same priced-in framework. Ask whether the risk is genuinely new information or whether it has already been covered, debated, and progressively absorbed. That distinction is the difference between a risk that can still surprise and one that has already been discounted.
Three risks dominated Q2’s coverage. An oil shock that sent Brent crude above $110. A USMCA review that generated months of trade policy headlines. A Federal Reserve leadership transition that kept policy uncertainty elevated. All three were widely covered, all three were progressively absorbed, and none derailed a 14.1% quarterly gain.
The pattern is not unique to this quarter. It is a structural feature of how markets process information. Risks that receive the most coverage are, by definition, the risks that have been most thoroughly priced in. Their remaining capacity to surprise is diminished with every article, every analyst note, every investor conversation that incorporates them into expectations.
That does not guarantee positive outcomes. It does not mean widely discussed risks never materialise into genuine market disruptions. But it does mean that the headline-to-consequence assumption, the instinct that says “this sounds bad, so stocks should fall,” is a less accurate map of how markets actually behave than the pricing-in framework.
What is already known cannot surprise. It is the unanticipated, not the widely debated, that drives genuine market moves.
Apply that lens to Q3’s emerging narratives. When the next risk story builds momentum in financial media, ask what the market has already priced in before deciding what it means for your portfolio. That question, asked consistently, is worth more than any single quarter’s return.
For investors wanting to translate the pricing-in framework into a concrete decision process for Q3’s emerging narratives, our comprehensive walkthrough of geopolitical risk investing strategy covers the research-backed filter for separating headline-driven noise from genuine portfolio action signals, with historical data from three prior oil-above-$100 episodes included.
This article is for informational purposes only and should not be considered financial advice. Investors should conduct their own research and consult with financial professionals before making investment decisions. Past performance does not guarantee future results.
The pricing-in framework holds that as a risk receives widespread media coverage, markets progressively absorb it into valuations, reducing its remaining capacity to generate a negative surprise. In Q2 2026, all three dominant risks (the oil shock, the USMCA review, and the Fed leadership transition) were so thoroughly covered that none could derail a 14.1% quarterly gain.
Geopolitical commodity shocks tend to spike fast because markets immediately price in the worst-case supply disruption; when actual disruption proves narrower than feared, prices recalibrate quickly. Brent crude fell from above $110 in March to approximately $72 by end of June, completing its full shock-and-normalisation cycle within a single quarter while global equities gained 14.1%.
Canada and Mexico agreed to extend the USMCA while the United States declined, triggering annual joint reviews under Article 34.7 through to the agreement's 2036 expiration. Because this lower-stakes outcome had been progressively priced in over months of coverage, markets registered no material negative reaction when the conclusion was announced.
Global equities approached a 10% drawdown at the end of Q1 2026, and the single strongest month of the subsequent recovery, April's 8.9% gain, arrived immediately after that period of maximum discomfort. Research cited in the article found that approximately 30.9% of investors who panic-sold during a major drawdown never re-entered equities, permanently forfeiting participation in recoveries like April's.
Three variables carry into Q3: inflation remains at 4.2% year-over-year as of May 2026 with an uncertain trajectory, the Technology sector's direction after June's retreat is unresolved, and the Federal Reserve leadership transition continues without a clear resolution date. The two largest Q2 risks, the oil price shock and the USMCA review, are now substantially de-risked.