What the June Jobs Report Means for Fed Monetary Policy
1 hr ago

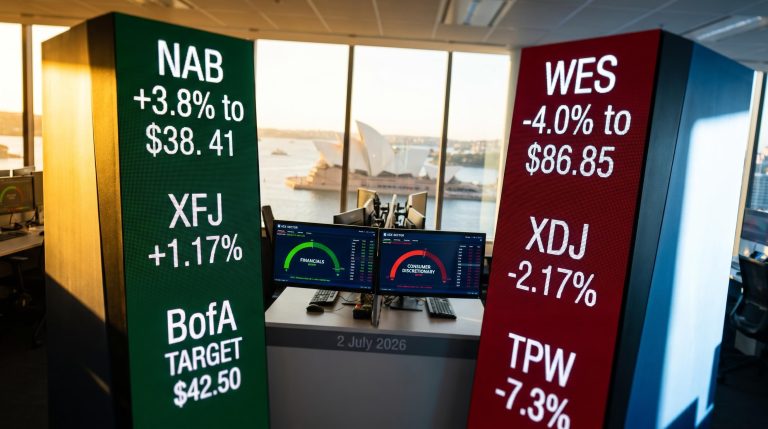
The S&P 500 has closed higher in every single July for the past decade. Ten out of ten. That is not a rounding error or a selective reading of the data; it is the most consistent single-month performance record in recent US equity history.
Today is 1 July 2026, which means you are standing at the start of the month that record describes. The seasonal data covering both Australian and US equities is not a retrospective curiosity right now; it is live context for decisions you may already be weighing about staying invested, deploying new capital, or sitting on the sidelines through mid-year noise.
Here is a data-backed framework for understanding why July tends to behave differently from most other months across both the ASX 200 and major US indices, what structural forces drive that behaviour, and where the pattern’s honest limits sit so you can use the evidence without over-weighting it.
Going back to 1980, the S&P/ASX 200 has recorded a mean July price return of 2.13%, closing higher in roughly 72% of those years. By that measure, July ranks as the second-best calendar month for Australian equities across the entire period.
72% of all Julys since 1980 have closed positive on the ASX 200, making it one of only two months to sustain that level of consistency across nearly five decades of data.
The total return dataset, which includes dividends and begins from 2001, tells a complementary story:
That the pattern holds across two separate methodologies and two different starting dates tells you something important: this is a structural feature of the Australian calendar, not a statistical accident produced by choosing the right dataset. A 72% hit rate still leaves roughly one in four Julys finishing lower, so the tendency is real without being a guarantee.
The long-run average sets the baseline. The recent record sharpens it.
Looking at the 12 most recent completed July periods through July 2025, the ASX 200 ended the month in positive territory on 11 occasions. That is approximately a 92% hit rate, comfortably above the 72% long-run figure.
The magnitude has shifted too:
Both the frequency and the size of gains have increased in the most recent window. That matters because of the question a sophisticated reader will already be asking: has this pattern been arbitraged away? The answer from the data is the opposite. July’s seasonal reliability has strengthened rather than faded, and the recent window spans multiple different macro environments, giving the trend some cross-cycle credibility.
The shorter sample carries less statistical weight than the full 46-year record, so the long-run figure remains the more conservative anchor. But seeing the pattern reinforce rather than erode in recent years gives you two independent reasons to take the seasonal signal seriously.
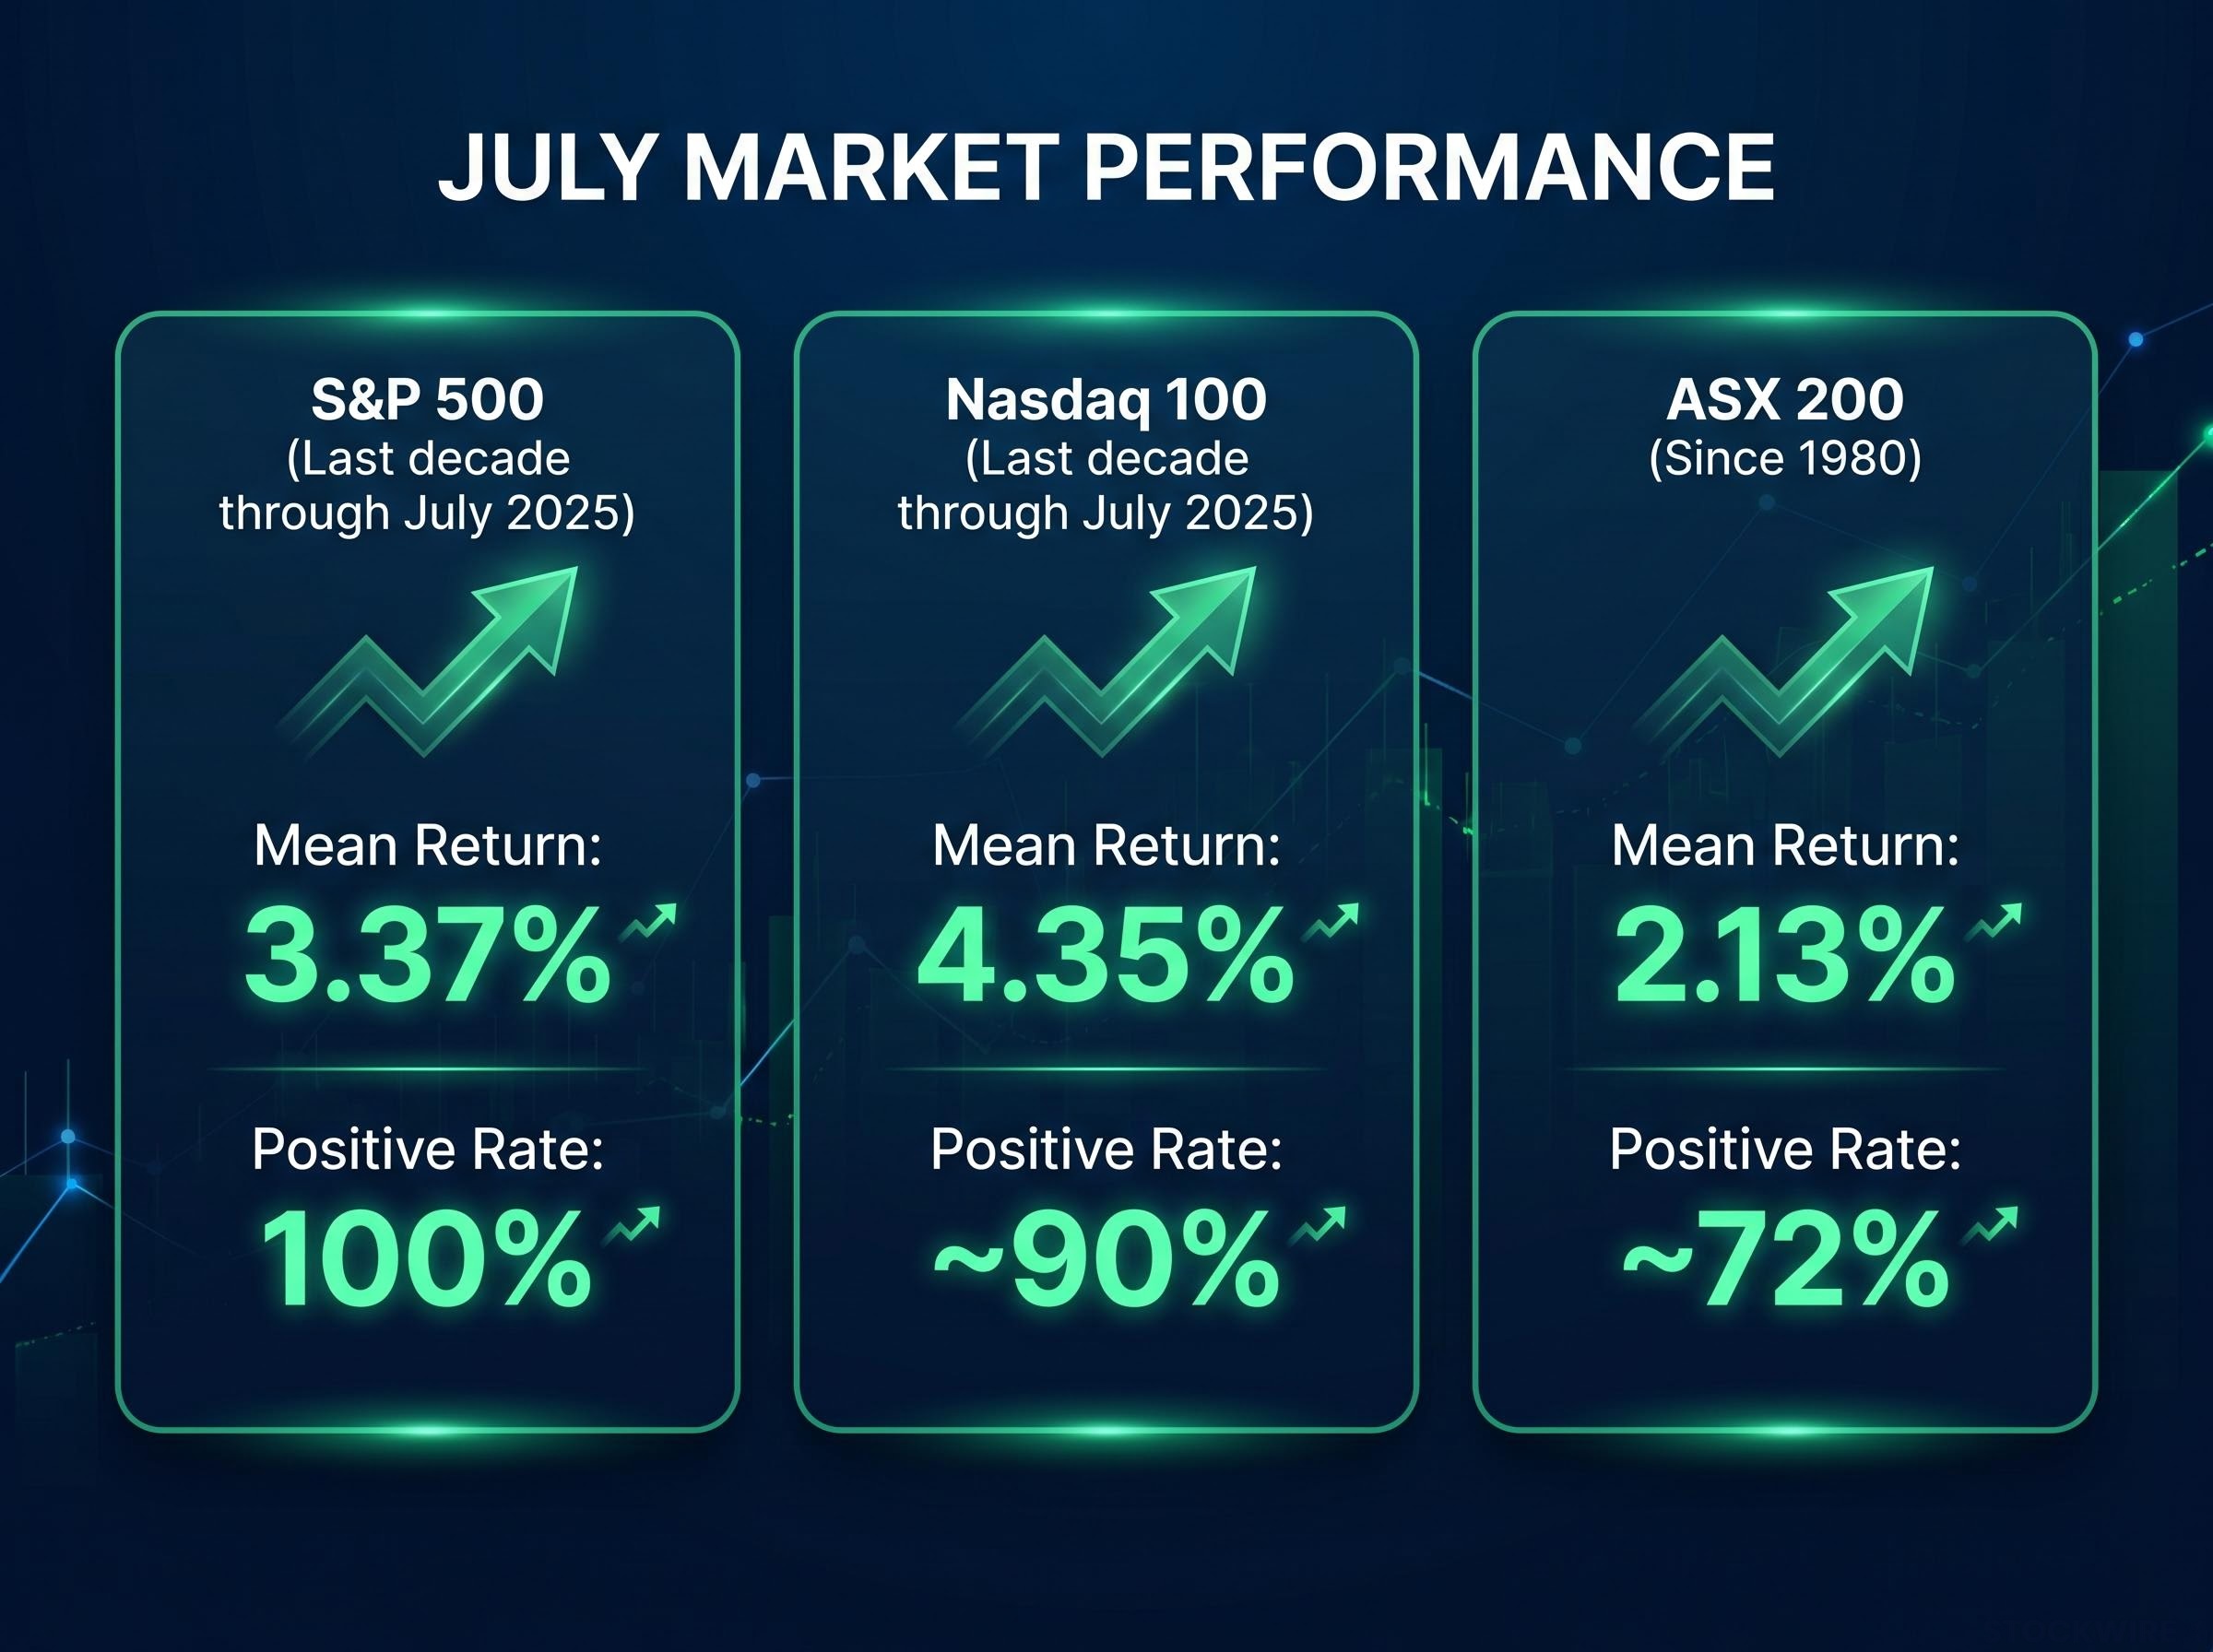
JPMorgan data covering the last decade through July 2025 shows the S&P 500 producing a mean July return of 3.37% without recording a single negative month across all ten years, a 100% positive rate that stands out even against the index’s broader long-run seasonal record. For a broad equity index covering hundreds of companies, that level of consistency is exceptional.
The Nasdaq 100 tells a similar story. Over that same ten-year window, JPMorgan’s figures show the index posting an average July return of 4.35%, with roughly 90% of those months finishing in positive territory.
Of all calendar months, July has produced the strongest average gain for the Nasdaq 100 over the past decade, with a 4.35% mean return across the period.
| Index | Period | Mean July return | Positive rate |
|---|---|---|---|
| S&P/ASX 200 | Since 1980 | 2.13% | ~72% |
| S&P/ASX 200 (total return) | Since 2001 | 1.69% | ~72% |
| S&P/ASX 200 | Last 12 Julys (through 2025) | ~2.88% | ~92% |
| S&P 500 | Last decade (through July 2025) | 3.37% | 100% |
| Nasdaq 100 | Last decade (through July 2025) | 4.35% | ~90% |
A ten-year sample is short by the standards of historical analysis, and the period covered is largely a bull-market era. Both figures should be read as recent findings rather than century-long laws. But for anyone with US equity exposure, a month where the index has not finished negative in a decade is not trivia. It is a directional signal worth incorporating into how you think about staying invested through short-term volatility in late June or early July.
The Nasdaq 100 valuation risk is the most significant variable conditioning whether July’s historical 4.35% average return can be replicated in 2026; the index’s trailing PE near 40-41x entering the second half prices in earnings acceleration from Magnificent Seven names that must now be confirmed through quarterly disclosures.
The US data extends the Australian picture into a second major market, giving you a genuinely global basis for the seasonal argument.
The statistics would be interesting on their own. They become significantly more compelling once you understand the structural reasons they keep repeating.
Three calendar-driven mechanisms explain why July tends to outperform:
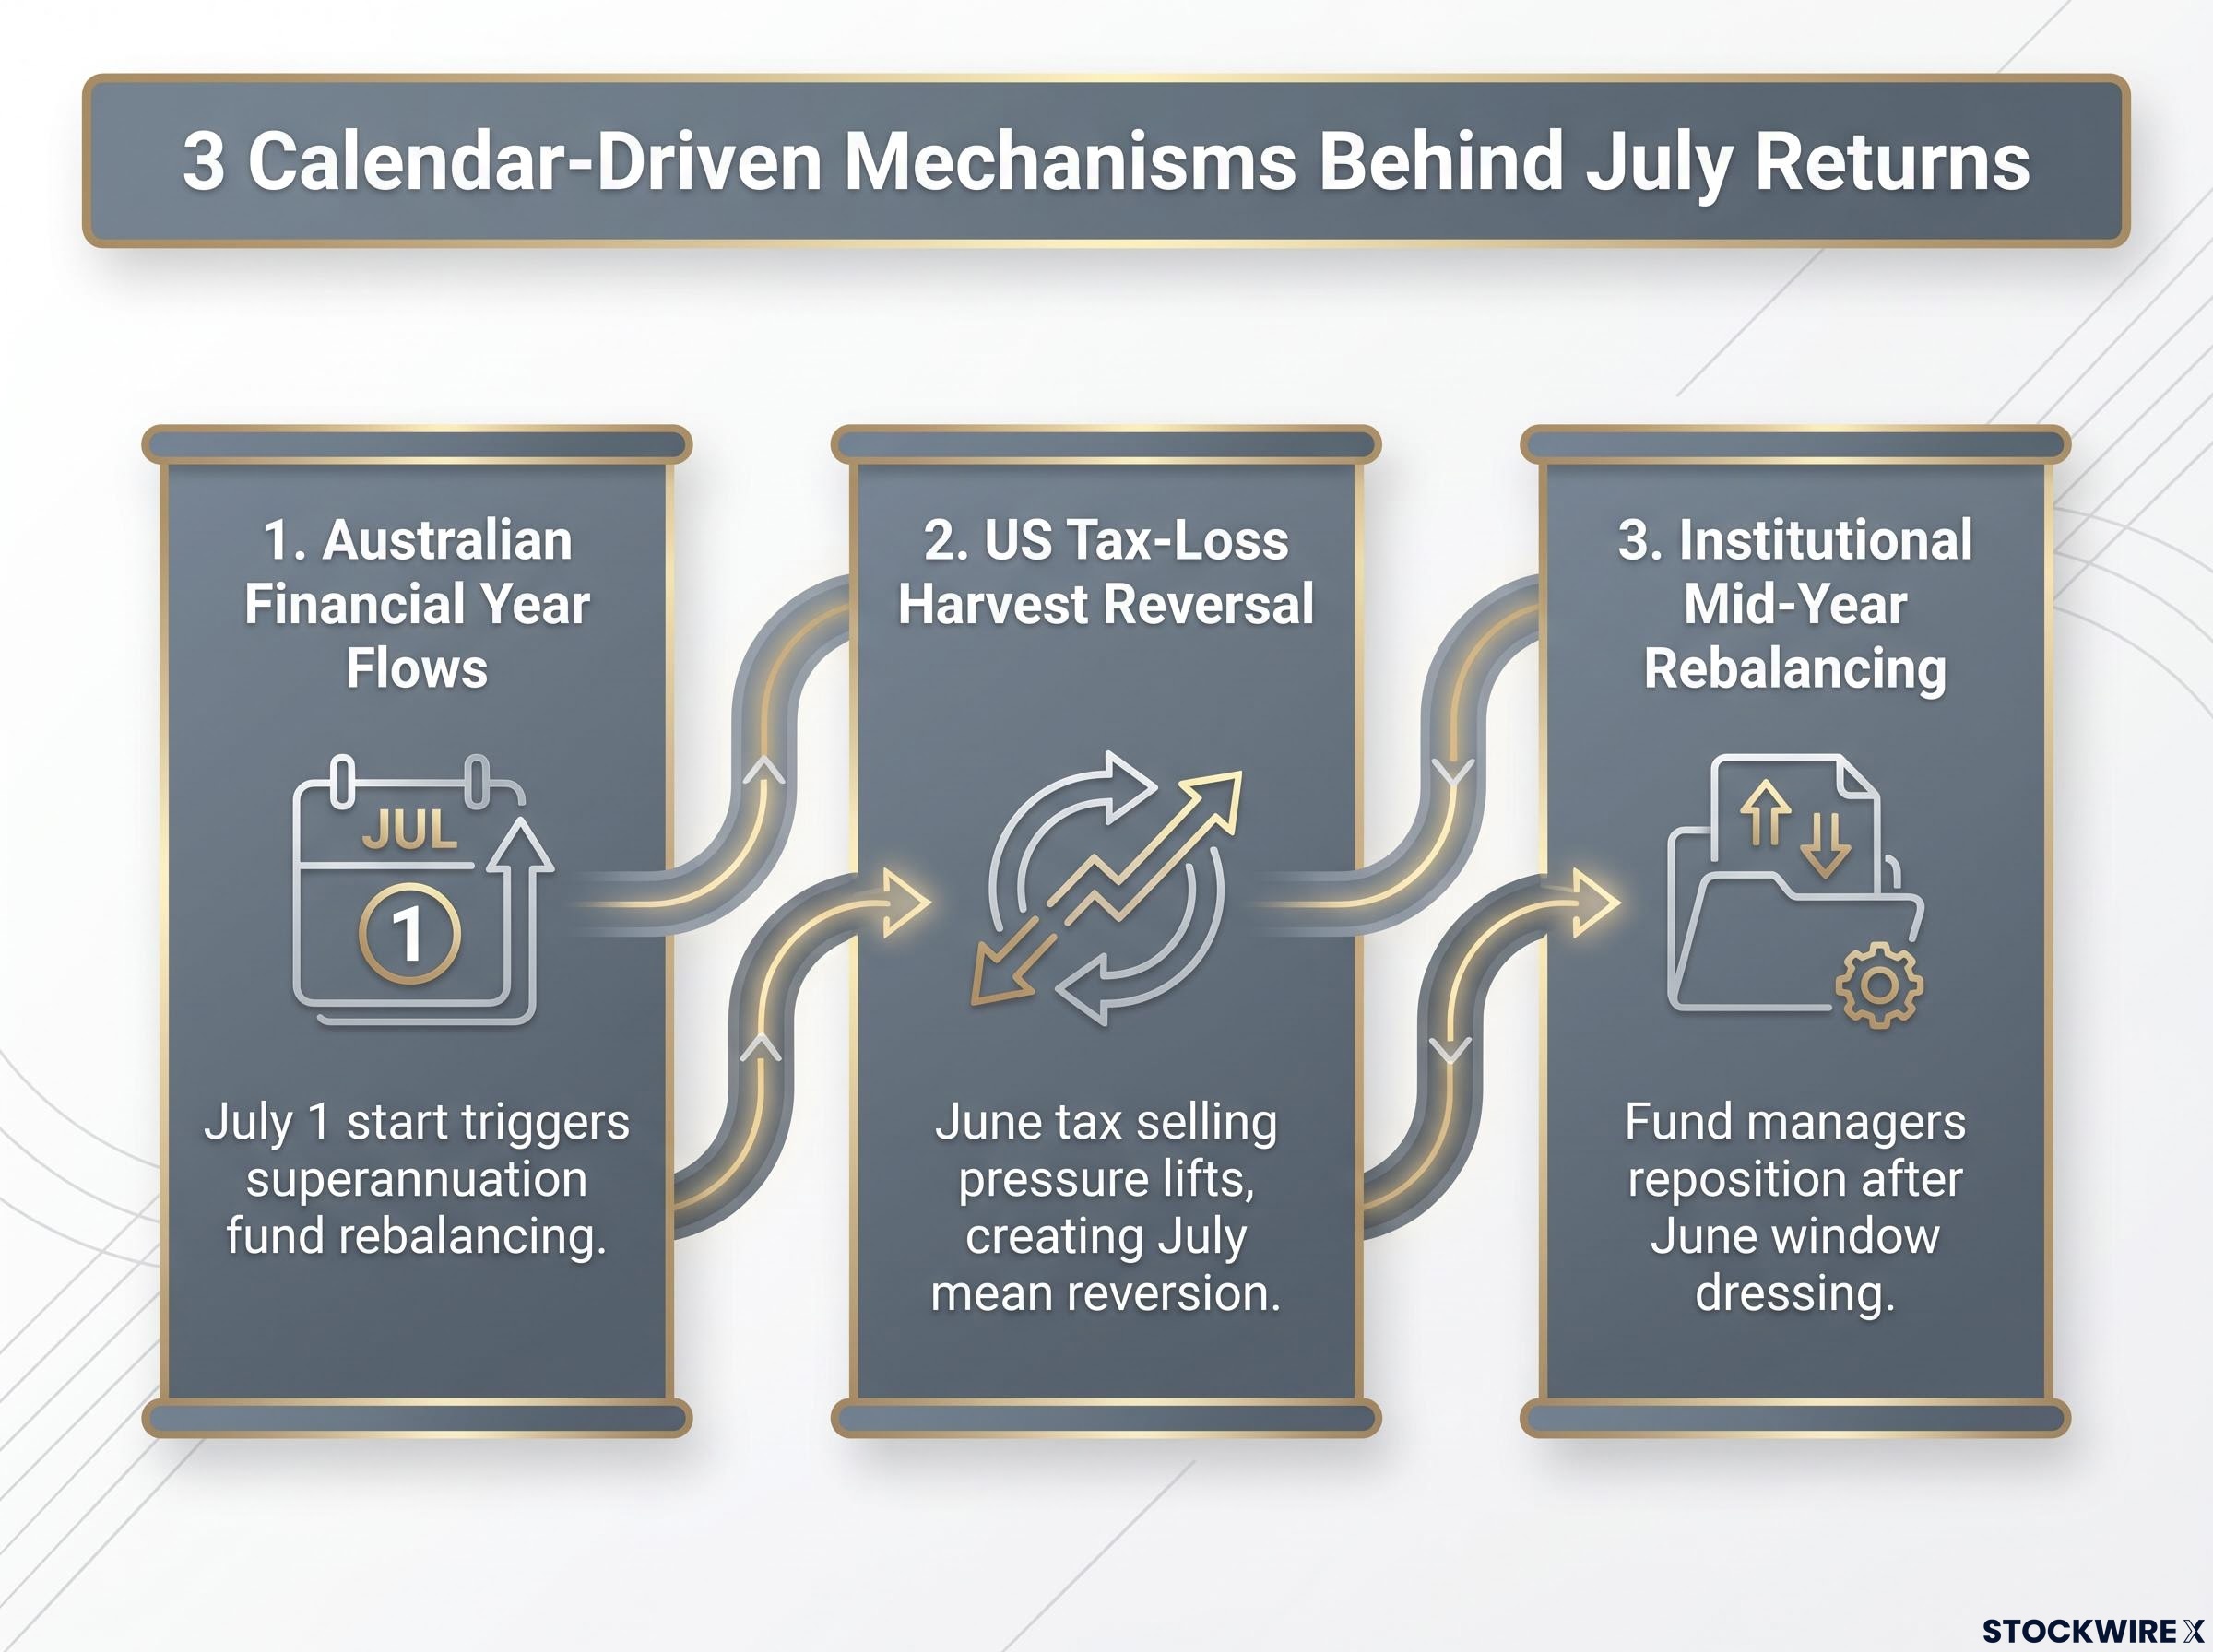
These flows are calendar-driven and repeat every year. That gives you a reason to believe the pattern has structural persistence rather than assuming it will eventually disappear simply because it has become more widely known.
July does not sit in isolation; it is the strongest single month within a broader calendar of equity seasonal patterns that a century of S&P 500 data shows are real, largely positive, and frequently misapplied by investors who exit at the wrong inflection points.
Seasonal patterns describe what has tended to happen. They do not tell you what must happen in any given year.
The evidence presented above is real and spans multiple indices, geographies, and return definitions. But it is descriptive, not predictive. Several specific forces can override the seasonal tailwind:
Even the ASX 200’s long-run 72% positive rate means roughly one in four Julys have gone against the trend. The S&P 500’s perfect 100% record and the Nasdaq 100’s 90% figure cover only a decade, a comparatively short and mostly favourable slice of market history.
The case for July is probabilistic and contextual, not deterministic. That is what makes it useful as a decision-support input rather than a naive prediction.
Seasonality is one input among several. It sits alongside valuations, risk tolerance, macro conditions, and individual circumstances, and it does not replace any of them. Where it adds value is in providing calendar context that can inform the weight you give to other signals.
The practical evidence on seasonal timing costs is stark: investors who followed the Sell in May exit in 2025 missed a full May through October gain of 23.6%, a reminder that acting mechanically on calendar signals has historically been most expensive at precisely the moments the strategy feels most justified.
Two reader situations illustrate the practical distinction:
You are at the start of July 2026, the precise point at which this seasonal context is most directly applicable. The most useful thing you can do with the evidence is hold it as a supportive background signal, a real, data-backed tendency across two major markets, rather than a trade instruction. What it cannot do is replace your own assessment of whether current valuations, your risk tolerance, and the macro environment justify the positions you hold or the ones you are considering.
For investors wanting to translate July’s seasonal context into a concrete portfolio action, our dedicated guide to portfolio rebalancing walks through how to identify asset drift after multi-year equity gains and execute a tax-efficient rebalancing strategy suited to current market conditions.
This article is for informational purposes only and should not be considered financial advice. Investors should conduct their own research and consult with financial professionals before making investment decisions. Past performance does not guarantee future results. Seasonal patterns are descriptive of historical tendencies and are subject to market conditions and various risk factors.
July stock market seasonality refers to the historical tendency for equity indices to produce above-average returns in July, driven by structural calendar forces such as Australian financial year flows, US tax-loss harvest reversals, and institutional mid-year rebalancing. It matters because these forces repeat annually and provide a directional signal investors can weigh alongside valuations and macro conditions.
Going back to 1980, the ASX 200 has recorded a mean July price return of 2.13% with roughly 72% of those months finishing positive, making it the second-best calendar month in the 46-year record. Over the most recent 12 completed Julys through 2025, that positive rate rose to approximately 92% with a mean return of around 2.88%.
No. According to JPMorgan data covering the last decade through July 2025, the S&P 500 posted a positive return in every single July across all ten years, producing a mean return of 3.37% and a 100% positive rate over that period.
Three calendar-driven mechanisms repeat every year: fresh capital allocations and superannuation rebalancing in Australia at the July 1 financial year start, mean reversion in US stocks following June tax-loss harvesting selling pressure, and renewed institutional buying after mid-year portfolio window dressing.
Seasonal patterns are descriptive of historical tendencies, not guarantees. Even the ASX 200's long-run 72% positive rate means roughly one in four Julys have finished lower, and macro shocks, recession, or significant valuation compression can override the seasonal tailwind in any given year.