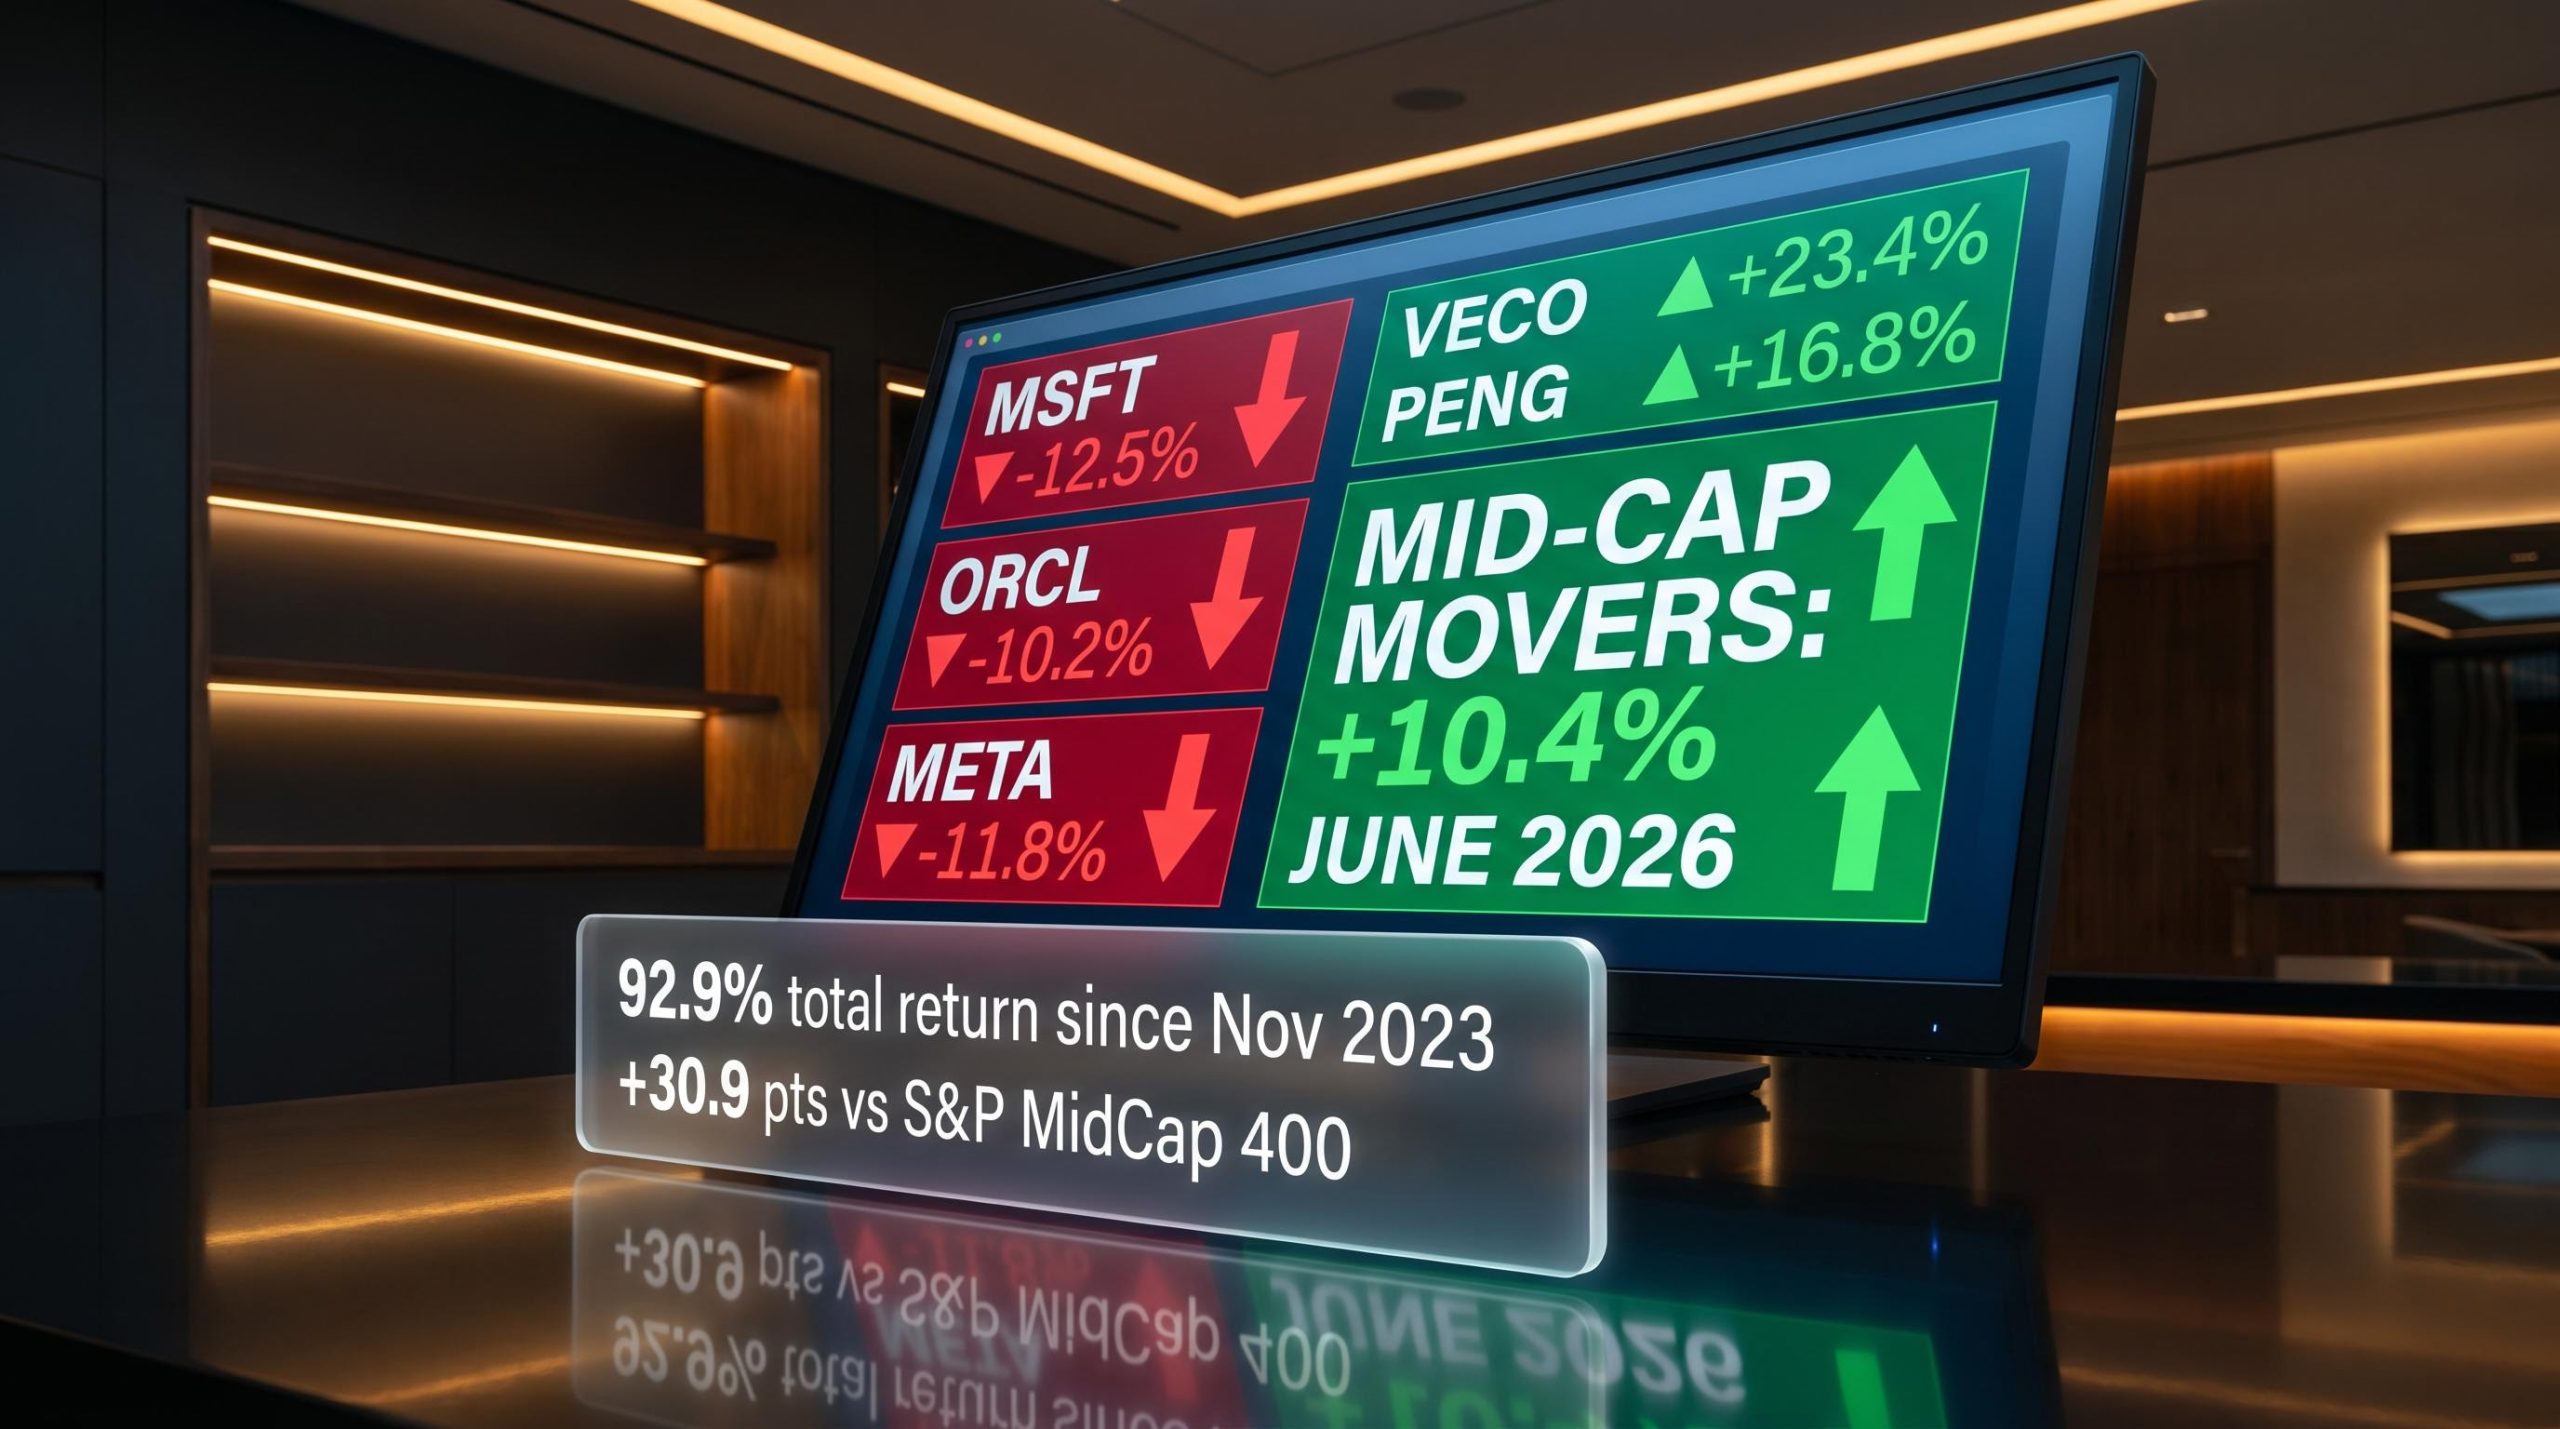
Why the Mid-Cap Rotation Beat Mega-Cap Tech in June 2026
14 mins ago
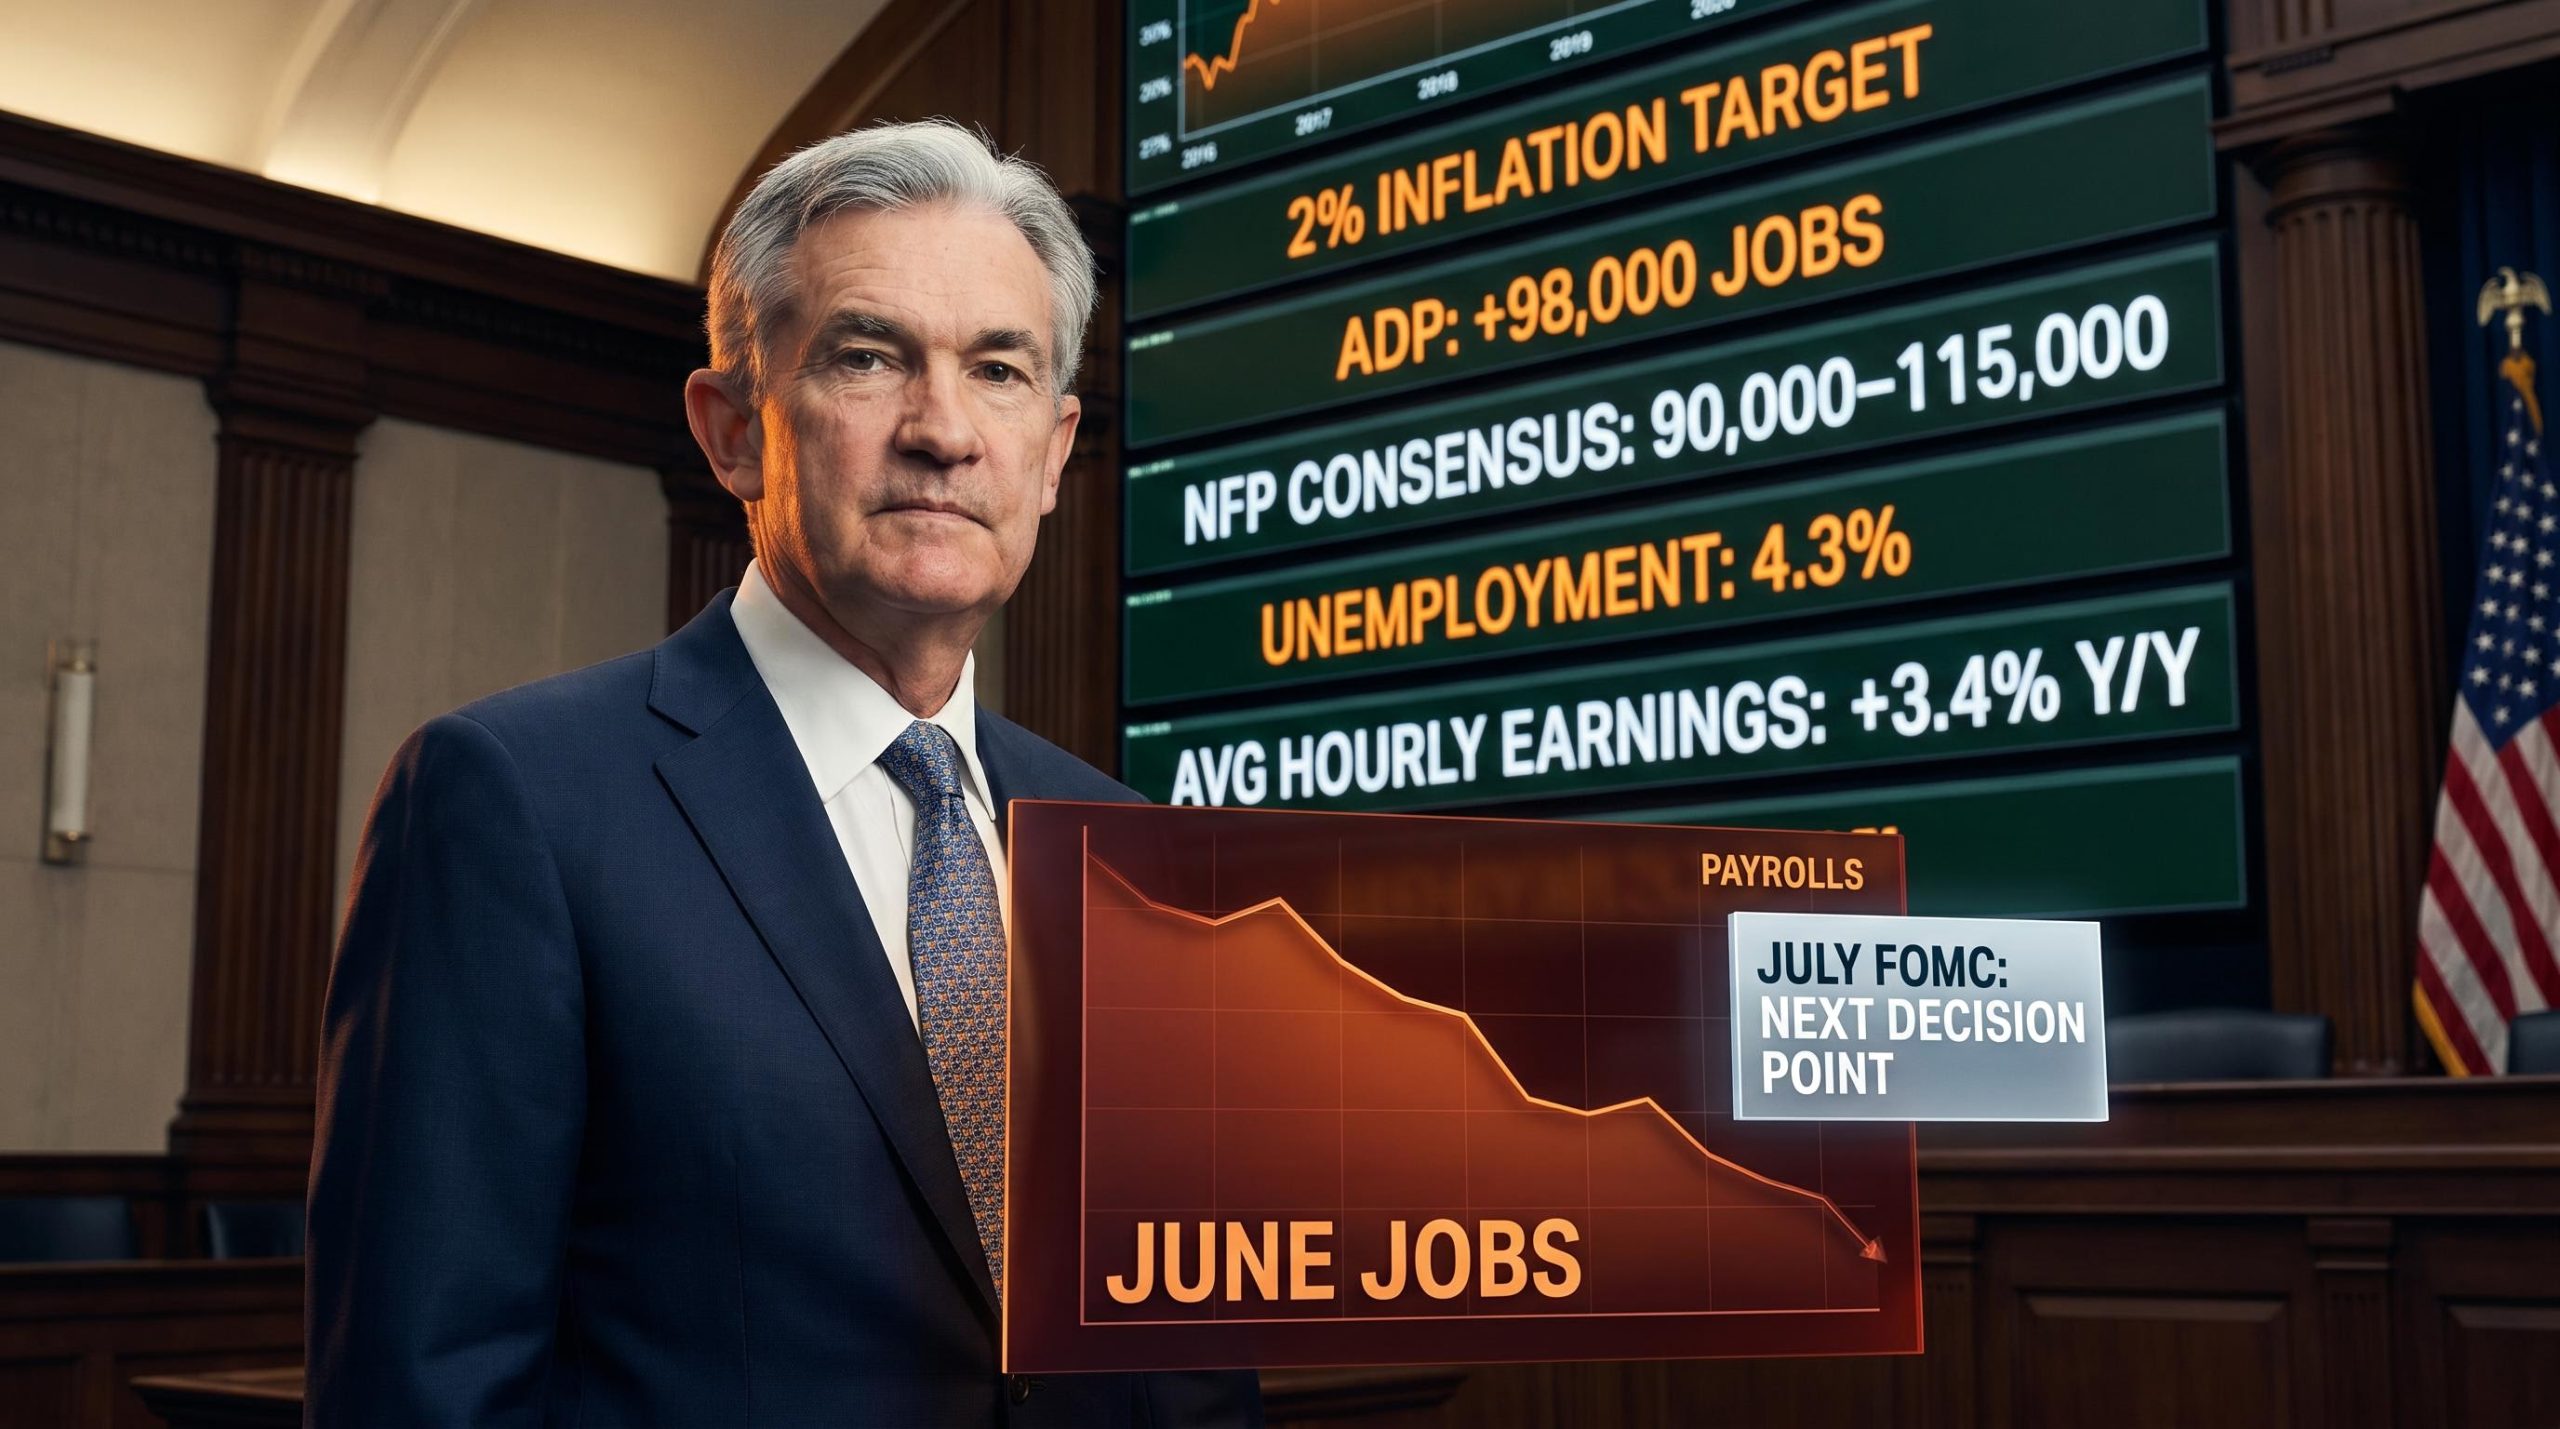
Jerome Powell drew a clear line on 1 July, reaffirming the Federal Reserve’s 2% inflation target and signalling that at least one more rate increase remains on the table for 2026. Hours later, ADP reported that private employers added just 98,000 jobs in June, well below expectations. The Fed is leaning harder on the brake at the exact moment the engine is losing power.
That tension resolves, or deepens, today. The official nonfarm payrolls report drops on 2 July, and that single number will either validate Powell’s hawkish confidence or put it under immediate strain. The Fed’s reaction function is not a mystery: labour market weakness must be clear and sustained before policy shifts. But a weak enough print changes what “sustained” looks like to markets.
Here is the framework for reading today’s data in real time: the three numbers inside the report that matter most, what each one signals about the Fed’s next move, and how different outcomes should change how you are positioned heading into the second half of 2026.
Powell’s remarks on 1 July left little room for interpretation. The Fed chair reaffirmed that the 2% inflation target is non-negotiable and that the central bank anticipates a minimum of one further rate increase in 2026.
Powell’s core message: The Fed will not accommodate expectations of looser monetary conditions. The 2% target comes first, and policy will remain restrictive until inflation credibility is secured.
The reaction function behind that message is worth understanding. Inflation credibility sits at the top of the hierarchy. Labour market deterioration must be clear and sustained, not suggested by a single print, before the Fed meaningfully pivots. Powell carries the 1970s experience as an internal reference point: premature loosening allowed inflation to re-accelerate, and that institutional memory explains why the Fed will accept some growth sacrifice to preserve credibility. Rate relief is further away than the ADP miss alone might suggest.
The Fed leadership transition that brought Kevin Warsh into the chair role in May 2026 added a layer of institutional complexity to the already-fraught inflation picture, with Warsh inheriting an environment of 3.8% headline CPI and Brent crude above $107 at the moment of confirmation, a starting point that helps explain the committee’s determined hawkishness through the second quarter.
The backdrop makes the timing sharper. Elevated energy costs pushed inflation sharply higher across the second quarter, and although those pressures have since eased, investor confidence in the retreat remains fragile. Semiconductor and chip price increases represent an additional complication for the journey back to 2%, adding a layer of uncertainty the Fed cannot ignore. The July FOMC meeting is the next formal decision point, and today’s data will condition how markets read the dot plot when it arrives.
Powell’s hawkish signal landed hours before a data print that complicates it. That is the irony, and it is also the analytical setup for everything that follows.
The hiring picture entering today is one of deceleration, not collapse. In May 2026, nonfarm payrolls reportedly rose by 172,000, following 179,000 in April (both figures unconfirmed by independent sources). Both prints came in well above forecasts and gave the Fed confidence to maintain its hawkish stance. The unemployment rate held steady at 4.3% in May.
Then the ADP June print landed at 98,000, a directional warning that hiring momentum is fading. A caveat matters here: ADP uses its own payroll data while the Bureau of Labor Statistics (BLS) relies on broader surveys, and the two series can diverge materially in any given month. A soft ADP number is a signal, not a guarantee.
The May payrolls surprise was itself a product of broad-based sector gains across leisure, hospitality, and government, which made the upside revision from 115,000 to 179,000 in April all the more striking; that combination of strength across two consecutive months is precisely the foundation on which the Fed built its confidence to stay hawkish heading into today.
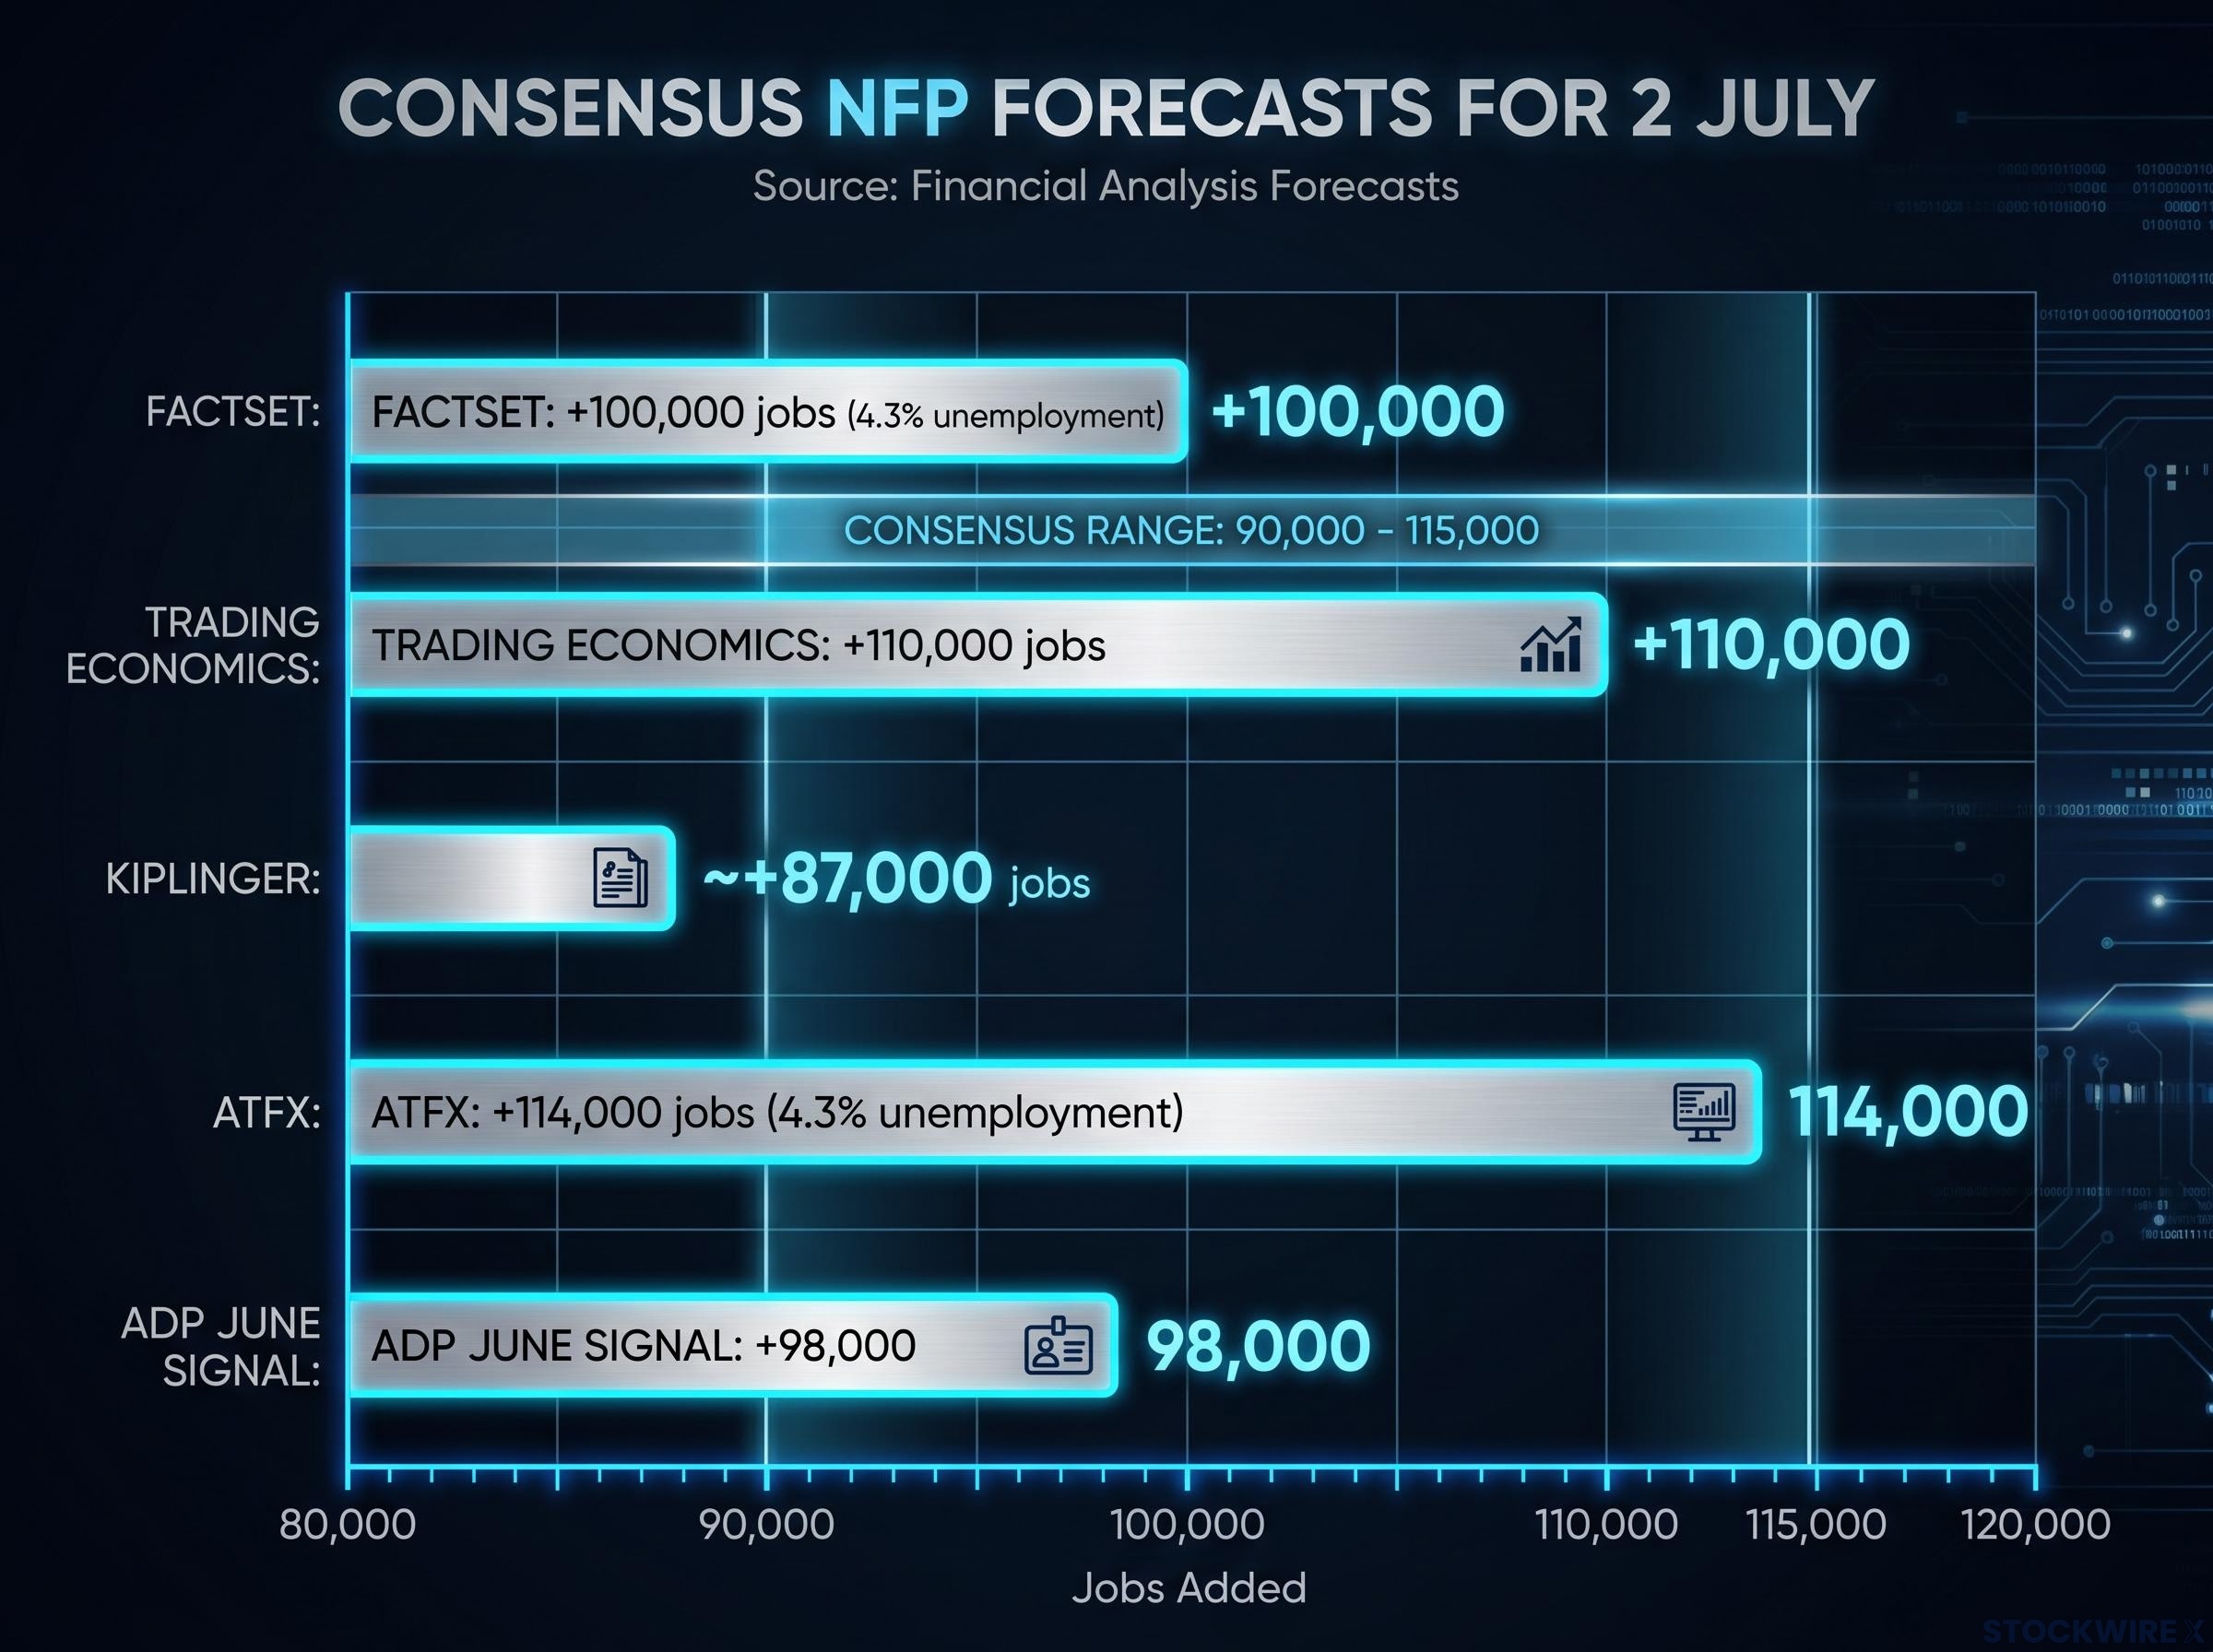
Consensus for today’s official report clusters in the 90,000-115,000 range, with unemployment expected to hold at 4.3% and average hourly earnings forecast at approximately +0.3% month-on-month and +3.4% year-on-year. Individual forecaster estimates (all unconfirmed by independent sources) include:
| Metric | Consensus range | ADP signal (June) |
|---|---|---|
| Headline payrolls | +90,000-115,000 | +98,000 |
| Unemployment rate | 4.3% | N/A |
| Avg hourly earnings (m/m) | +0.3% | N/A |
| Avg hourly earnings (y/y) | +3.4% | N/A |
The ADP miss tells you the direction of travel, but it does not tell you the Fed will flinch. One month of payroll deceleration into still-positive territory is not the “clear and sustained” signal the Fed has said it needs.
When the headline prints, most coverage will focus on a single figure. That is not how the Fed reads it, and it is not how you should either. Three variables inside the report do the policy work, and knowing them in advance lets you interpret the number the instant it arrives rather than waiting for analyst commentary.
Headline payrolls are the first decision variable. Below roughly 80,000 signals more pronounced cooling than expected; according to ATFX analysis, a print at that level could weigh on the dollar and reduce rate-hike expectations. A number in the 80,000-130,000 band confirms an orderly slowdown, tighter policy biting but not breaking the labour market. Above 150,000 hands the hawks a strong argument for another 2026 increase, echoing the recent pattern of upside surprises that kept the Fed confident.
Wage growth is the second variable, and it is the one most retail investors underweight. Average hourly earnings above roughly 4% year-on-year sustain the argument that labour-cost inflation remains inconsistent with a 2% target. A move toward or below 3.25-3.5% year-on-year strengthens the case that wage-driven inflation is easing.
The unemployment rate is the third. Most forecasts expect it to hold at 4.3%. The risk scenario is specific: if payrolls weaken and unemployment simultaneously pushes toward or above 4.5%, the Fed faces a harder trade-off between inflation credibility and recession risk.
There is a fourth, often-overlooked signal: revisions to April and May data. Given that May’s reported +172,000 already surprised to the upside, negative revisions would help confirm that peak hiring momentum has passed, while positive revisions would reinforce underestimated strength.
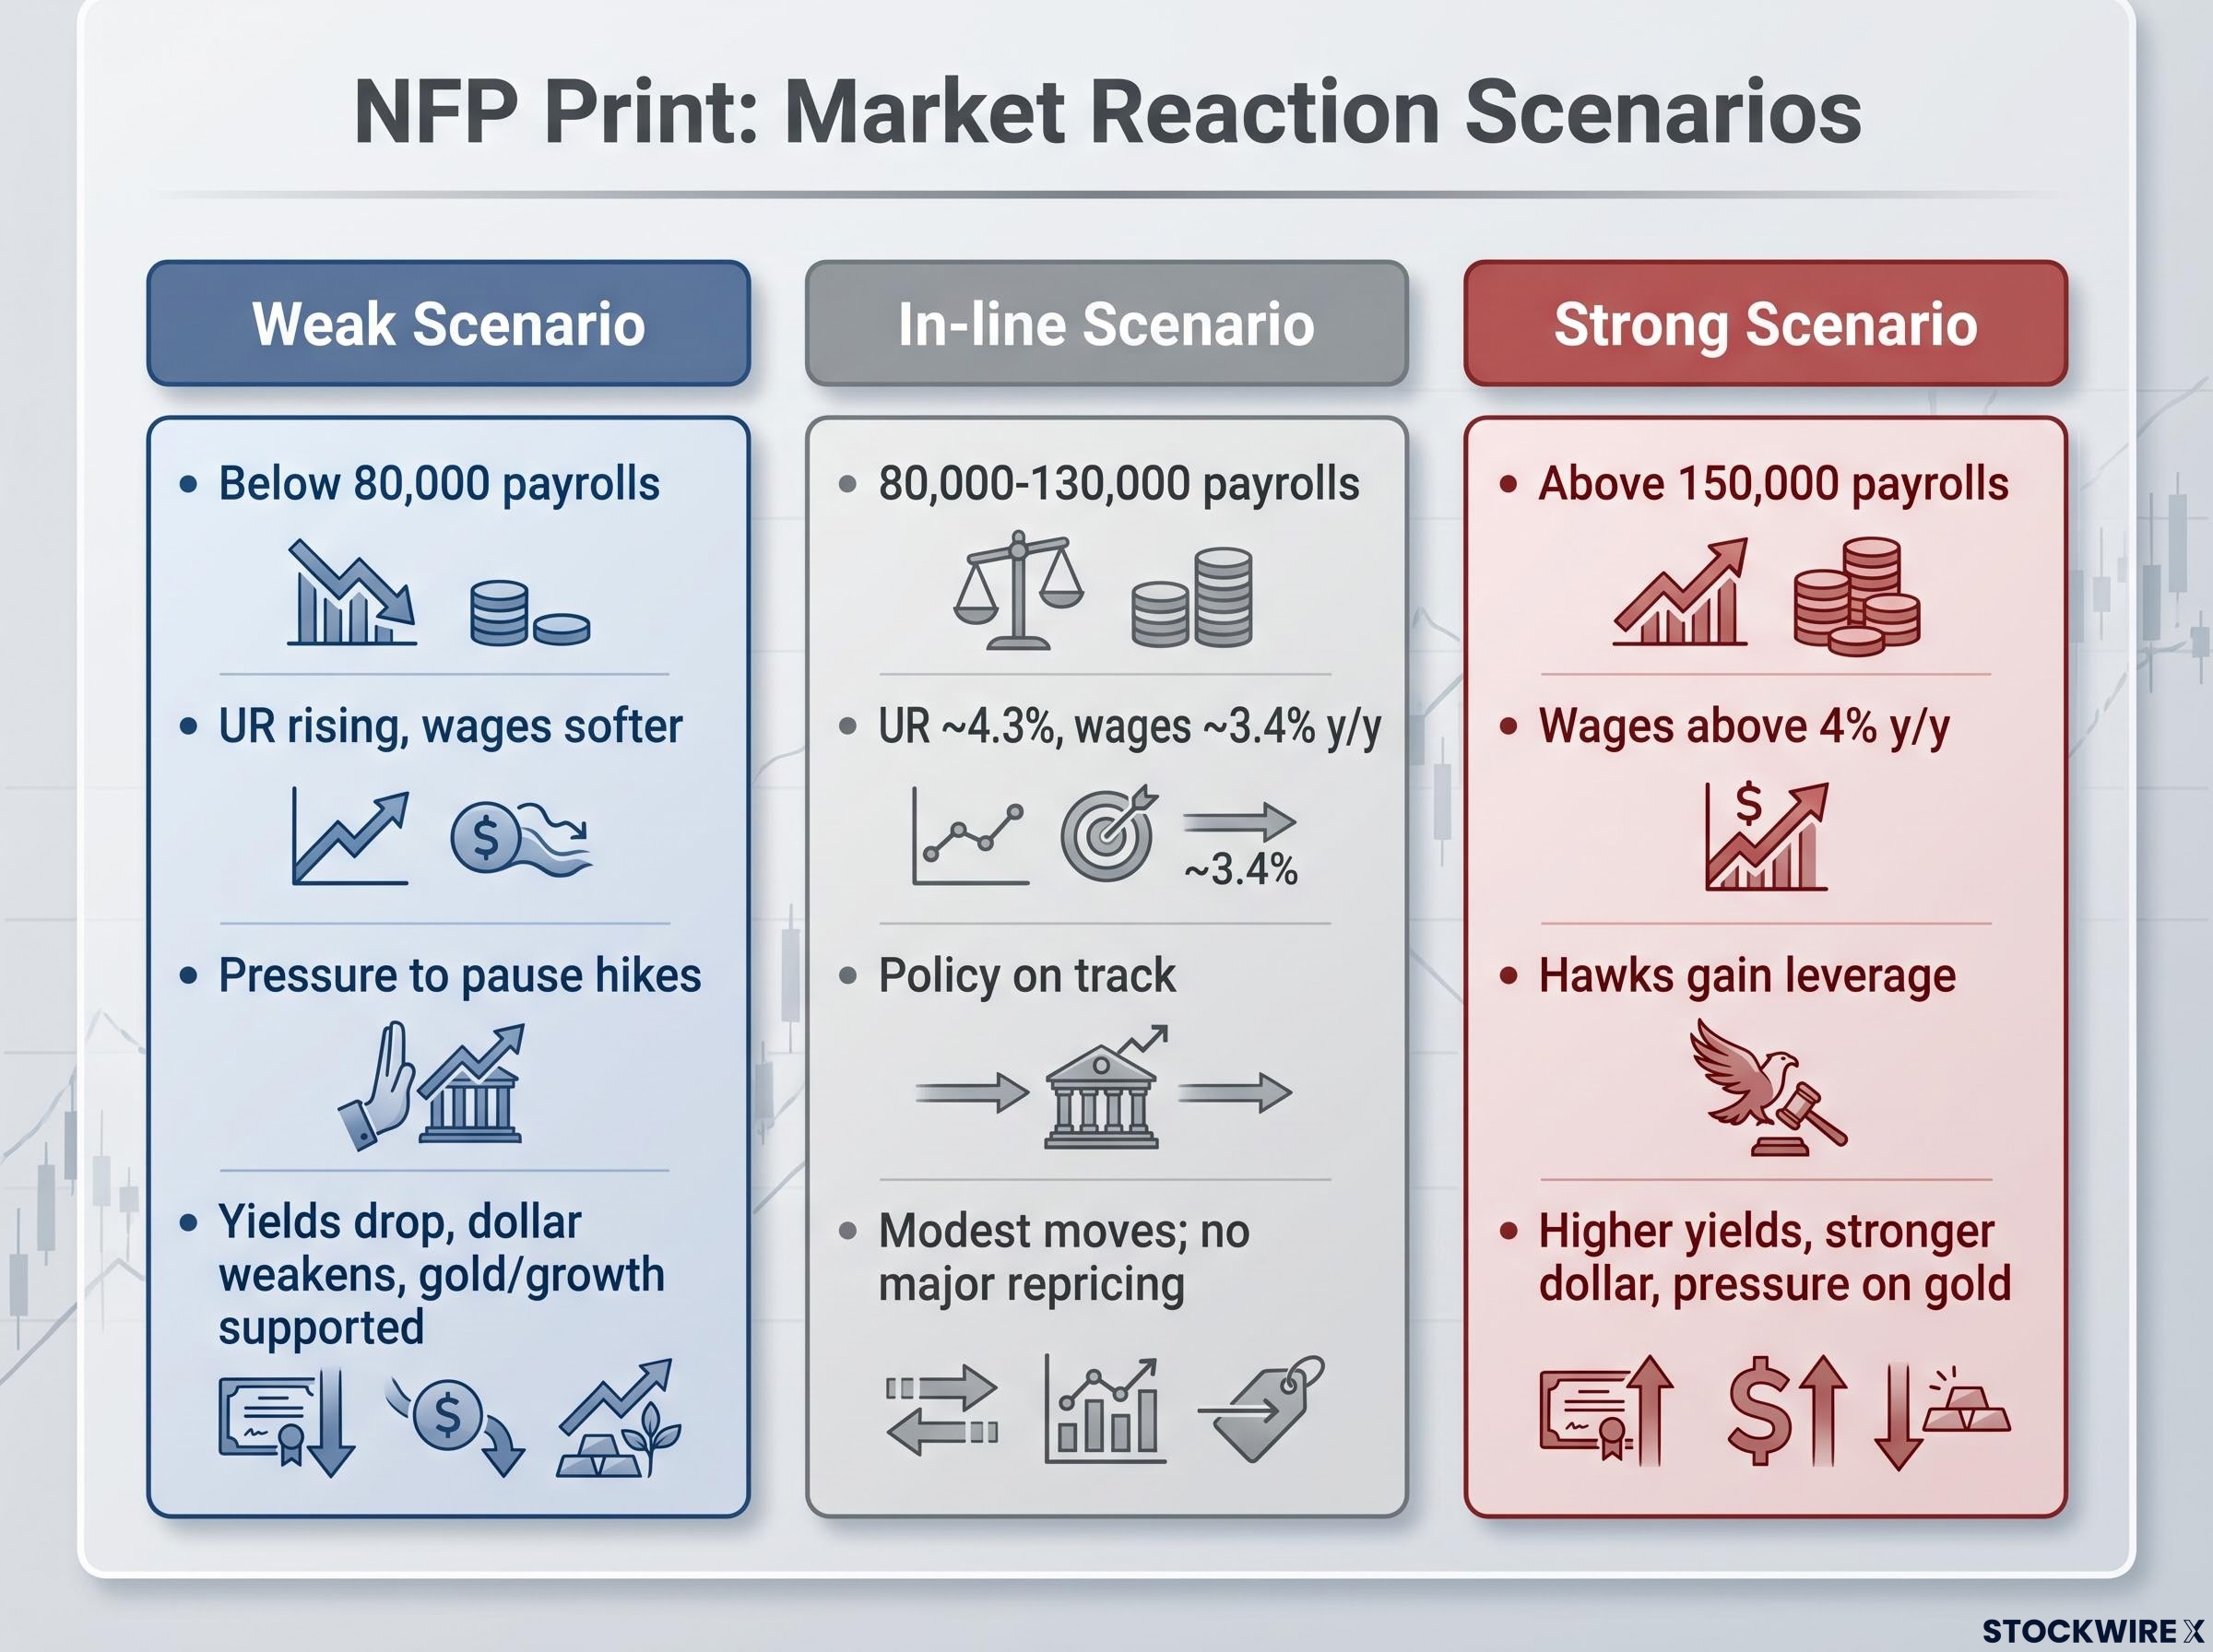
| Scenario | Payrolls range | Unemployment / wages | Likely Fed read | Typical market reaction |
|---|---|---|---|---|
| Weak | Below 80,000 | UR rising, wages softer | Cooling evident; pressure to pause hikes | Yields drop, dollar weakens, gold and growth stocks supported |
| In-line | 80,000-130,000 | UR ~4.3%, wages ~3.4% y/y | Policy on track; higher-for-longer maintained | Modest moves; no major repricing |
| Strong | Above 150,000 | Wages above 4% y/y | Labour market still hot; hawks gain leverage | Higher yields, stronger dollar, pressure on gold and long-duration equities |
These thresholds are not arbitrary. Each maps to a specific shift in the Fed’s stated reaction function, which means knowing them transforms a headline number into a policy signal you can act on.
Markets do not react to a jobs number in isolation. The transmission runs through a specific chain: jobs data reprices Fed rate expectations first, which moves short-end Treasury yields and the dollar. Equities and gold follow as investors update discount rates and recession probabilities. Understanding that chain is the difference between reacting and positioning.
On the equity side, the bifurcation matters. A weak print helps rate-sensitive growth and tech names through lower implied discount rates, pulling forward eventual easing hopes. But if the weakness reads as recessionary rather than cooling, cyclicals and small caps suffer even as yields fall. Prior upside NFP surprises correlated with equity weakness precisely because they boosted rate-hike expectations and strengthened the dollar.
In fixed income, a downside surprise lowers the expected policy path and supports Treasury and high-grade bond prices. An upside surprise does the opposite: the expected terminal rate steepens, short-end yields rise, and longer-duration holdings come under pressure. The 2-year and 10-year Treasury yields are the intraday instruments to watch. The 2-year yield is the clearest real-time signal of where markets think the Fed is going; watch it move in the minutes after the print, and you will know more than most commentary published in the hour that follows.
Treasury yield dynamics have shifted structurally this cycle: with the 10-year at 4.66-4.67% and the 30-year pushing 5.18%, bond market stress rather than equity drawdowns has become the primary pressure lever on policy, meaning the 2-year and 10-year moves you watch in the minutes after today’s print are not just rate signals but the mechanism through which Washington itself reads the economic situation.
Gold has faced persistent pressure from Powell’s hawkish tone in recent months. As a non-yielding asset, it struggles when real rates and the dollar rise simultaneously. A softer NFP print could ease that pressure by pulling yields and the dollar lower. But the scenario that most concerns investors positioned for eventual easing is a hawkish overshoot: strong jobs plus stubborn wages forcing another hike, pushing real yields higher, triggering a sharp gold pullback, and strengthening the dollar.
The dollar acts as a real-time policy barometer. It has benefited from comparatively higher U.S. rates and recurring jobs outperformance, and its moves ripple through commodities priced in dollars and emerging market currencies carrying dollar-denominated debt.
Today’s number is one input in a regime, not a verdict. Investors who trade the print in isolation without anchoring to the broader policy stance are making a timing bet, not a strategic positioning decision. The regime remains restrictive relative to the 2010s: higher borrowing costs, real yield available in quality fixed income, and equity valuations that require more justification than in a zero-rate environment.
The practical framework for the rest of 2026 comes down to five steps:
Today’s NFP print is a data point, not a turning point. The Fed has been explicit: clear and sustained evidence of labour market deterioration is the threshold before policy meaningfully shifts. One soft month does not satisfy that standard, even if it satisfies the market’s desire for a dovish narrative.
The genuine uncertainty is real. If today’s number comes in well below 80,000 with rising unemployment and cooling wages, that changes the conversation heading into the July FOMC in a way that a consensus-range print simply does not. But the forward variables that will matter most through the rest of 2026 are the core PCE trajectory, whether labour market cooling is orderly or accelerating, and whether the July dot plot holds the hawkish line or begins to tilt.
The gap between a single data point and a genuine policy inflection is where most retail investors misprice risk. Stay anchored to the regime, read each release against the full picture, and avoid the reflexive rotation that chases individual prints rather than the underlying policy path.
For investors who want to stress-test the assumption that Powell’s signals translate cleanly into economic outcomes, our dedicated guide to Fed policy limits examines Friedman’s long and variable lags concept and the historical episodes where the Fed’s actual control over real activity fell well short of its stated intentions.
This article is for informational purposes only and should not be considered financial advice. Investors should conduct their own research and consult with financial professionals before making investment decisions. Past performance does not guarantee future results. Financial projections are subject to market conditions and various risk factors.
The Fed's reaction function is its decision-making framework, where inflation credibility sits at the top and labour market deterioration must be clear and sustained before policy shifts. A single soft jobs print is not enough to trigger a pivot; the Fed has explicitly said it needs repeated evidence of weakness before loosening conditions.
The NFP report feeds directly into the Fed's assessment of labour market strength, which is one of its two official mandates alongside price stability. A print below 80,000 would pressure the Fed to pause hikes, while a number above 150,000 with strong wage growth reinforces the case for another increase at the July FOMC meeting.
Average hourly earnings measures the pace of wage growth across the economy, and it matters because persistent wage inflation above roughly 4% year-on-year is inconsistent with a 2% consumer price target. If labour costs stay elevated, the Fed has less justification to stop raising rates even if headline job gains slow.
A weak payrolls print typically pulls short-end Treasury yields lower as markets reduce their expected rate path, which also weighs on the dollar and relieves pressure on gold, a non-yielding asset that struggles when real rates and the dollar rise simultaneously. The 2-year Treasury yield is the clearest real-time signal to watch in the minutes after the report drops.
The practical framework involves reading all four key metrics together (headline payrolls, unemployment rate, wage growth, and revisions), tracking the July FOMC dot plot, monitoring core PCE as the Fed's preferred inflation gauge, and aligning portfolio positioning to the broader restrictive policy regime rather than reacting to any single monthly print.