Hormuz Drone Strikes Send Oil Higher Before Doha Talks
15 hrs ago
Six major US economic releases and a Federal Reserve Chair speech are landing inside a 48-hour window this week, compressed by the Independence Day holiday into Wednesday and Thursday. This is one of the most information-dense short windows of the year, and it is the kind of event risk that catches investors off-guard precisely because it sits inside a holiday week they expect to be quiet.
The compression creates a specific problem. Markets have almost no time to fully digest each release before the next one arrives, and liquidity thins heading into the long weekend. Weak jobs data and still-elevated manufacturing prices are pulling in different directions, and Fed Chair Kevin Warsh’s speech on Wednesday is the interpretive lens through which Thursday’s data will be read. If you hold US equity, currency, or bond exposure, this is not a week to approach passively.
Here is what this guide covers: every major release scheduled for 2-3 July, what each one measures in plain terms, and the four scenarios Thursday could produce, so you can match your positioning to the outcome you are watching for rather than reacting to it after the fact.
Wednesday’s three releases individually carry moderate weight. Together, they set the interpretive frame for everything that follows on Thursday. By the time markets close on 2 July, you will already have a read on consumer sentiment, employer hiring intentions, and the Fed’s current thinking. That combination shapes how Thursday’s payrolls number will land.
Here is what drops on Wednesday and what to watch for in each:
The combination of a marginal confidence improvement and a notable drop in job openings tells you the US economy is softening gradually rather than sharply. That context matters because it shapes how markets respond to any Thursday surprise, amplifying downside misses more than upside beats.
Most retail investors focus on the data itself and overlook the interpretive frame set by central bank communication. This week, that frame could matter more than the numbers.
The practical consequence of long and variable lags in monetary policy is that Warsh’s words on Wednesday are pricing a reaction function that may not fully transmit to the real economy for 12-18 months, which is part of why the speech’s framing of the growth-inflation trade-off carries such weight for near-term asset prices.
Chair Warsh’s address on Wednesday 2 July is positioned directly before the week’s most important data releases. That timing is not coincidental. It makes the speech the market’s guide for how to weight a jobs miss against a prices beat, or vice versa.
The tension Warsh faces: softening labour indicators versus sticky upstream manufacturing costs. How he frames this trade-off is what markets will be trading on before a single payrolls number has been published.
If Warsh signals tolerance for weaker labour data, perhaps by emphasising that the Fed has room to respond if the economy slows further, markets may look through a soft non-farm payrolls (NFP) print to earlier rate cuts. A dovish-tilted speech would mean that even a weak payrolls number could support risk assets, because the market’s fear of the Fed staying too tight gets removed before Thursday opens.
If Warsh leans hawkish, emphasising that upstream cost pressures require patience, weak growth combined with tight policy equals higher volatility and risk-off conditions on Thursday.
For your currency exposure, this matters immediately. The speech can reset USD expectations and therefore AUD/USD and other cross rates ahead of the data itself. Global rate expectations, specifically the path for US Treasuries, can cascade into other sovereign bond markets following a significant Fed speech. You do not need to predict which path Warsh takes, but you need to understand that both are live possibilities before Thursday opens.
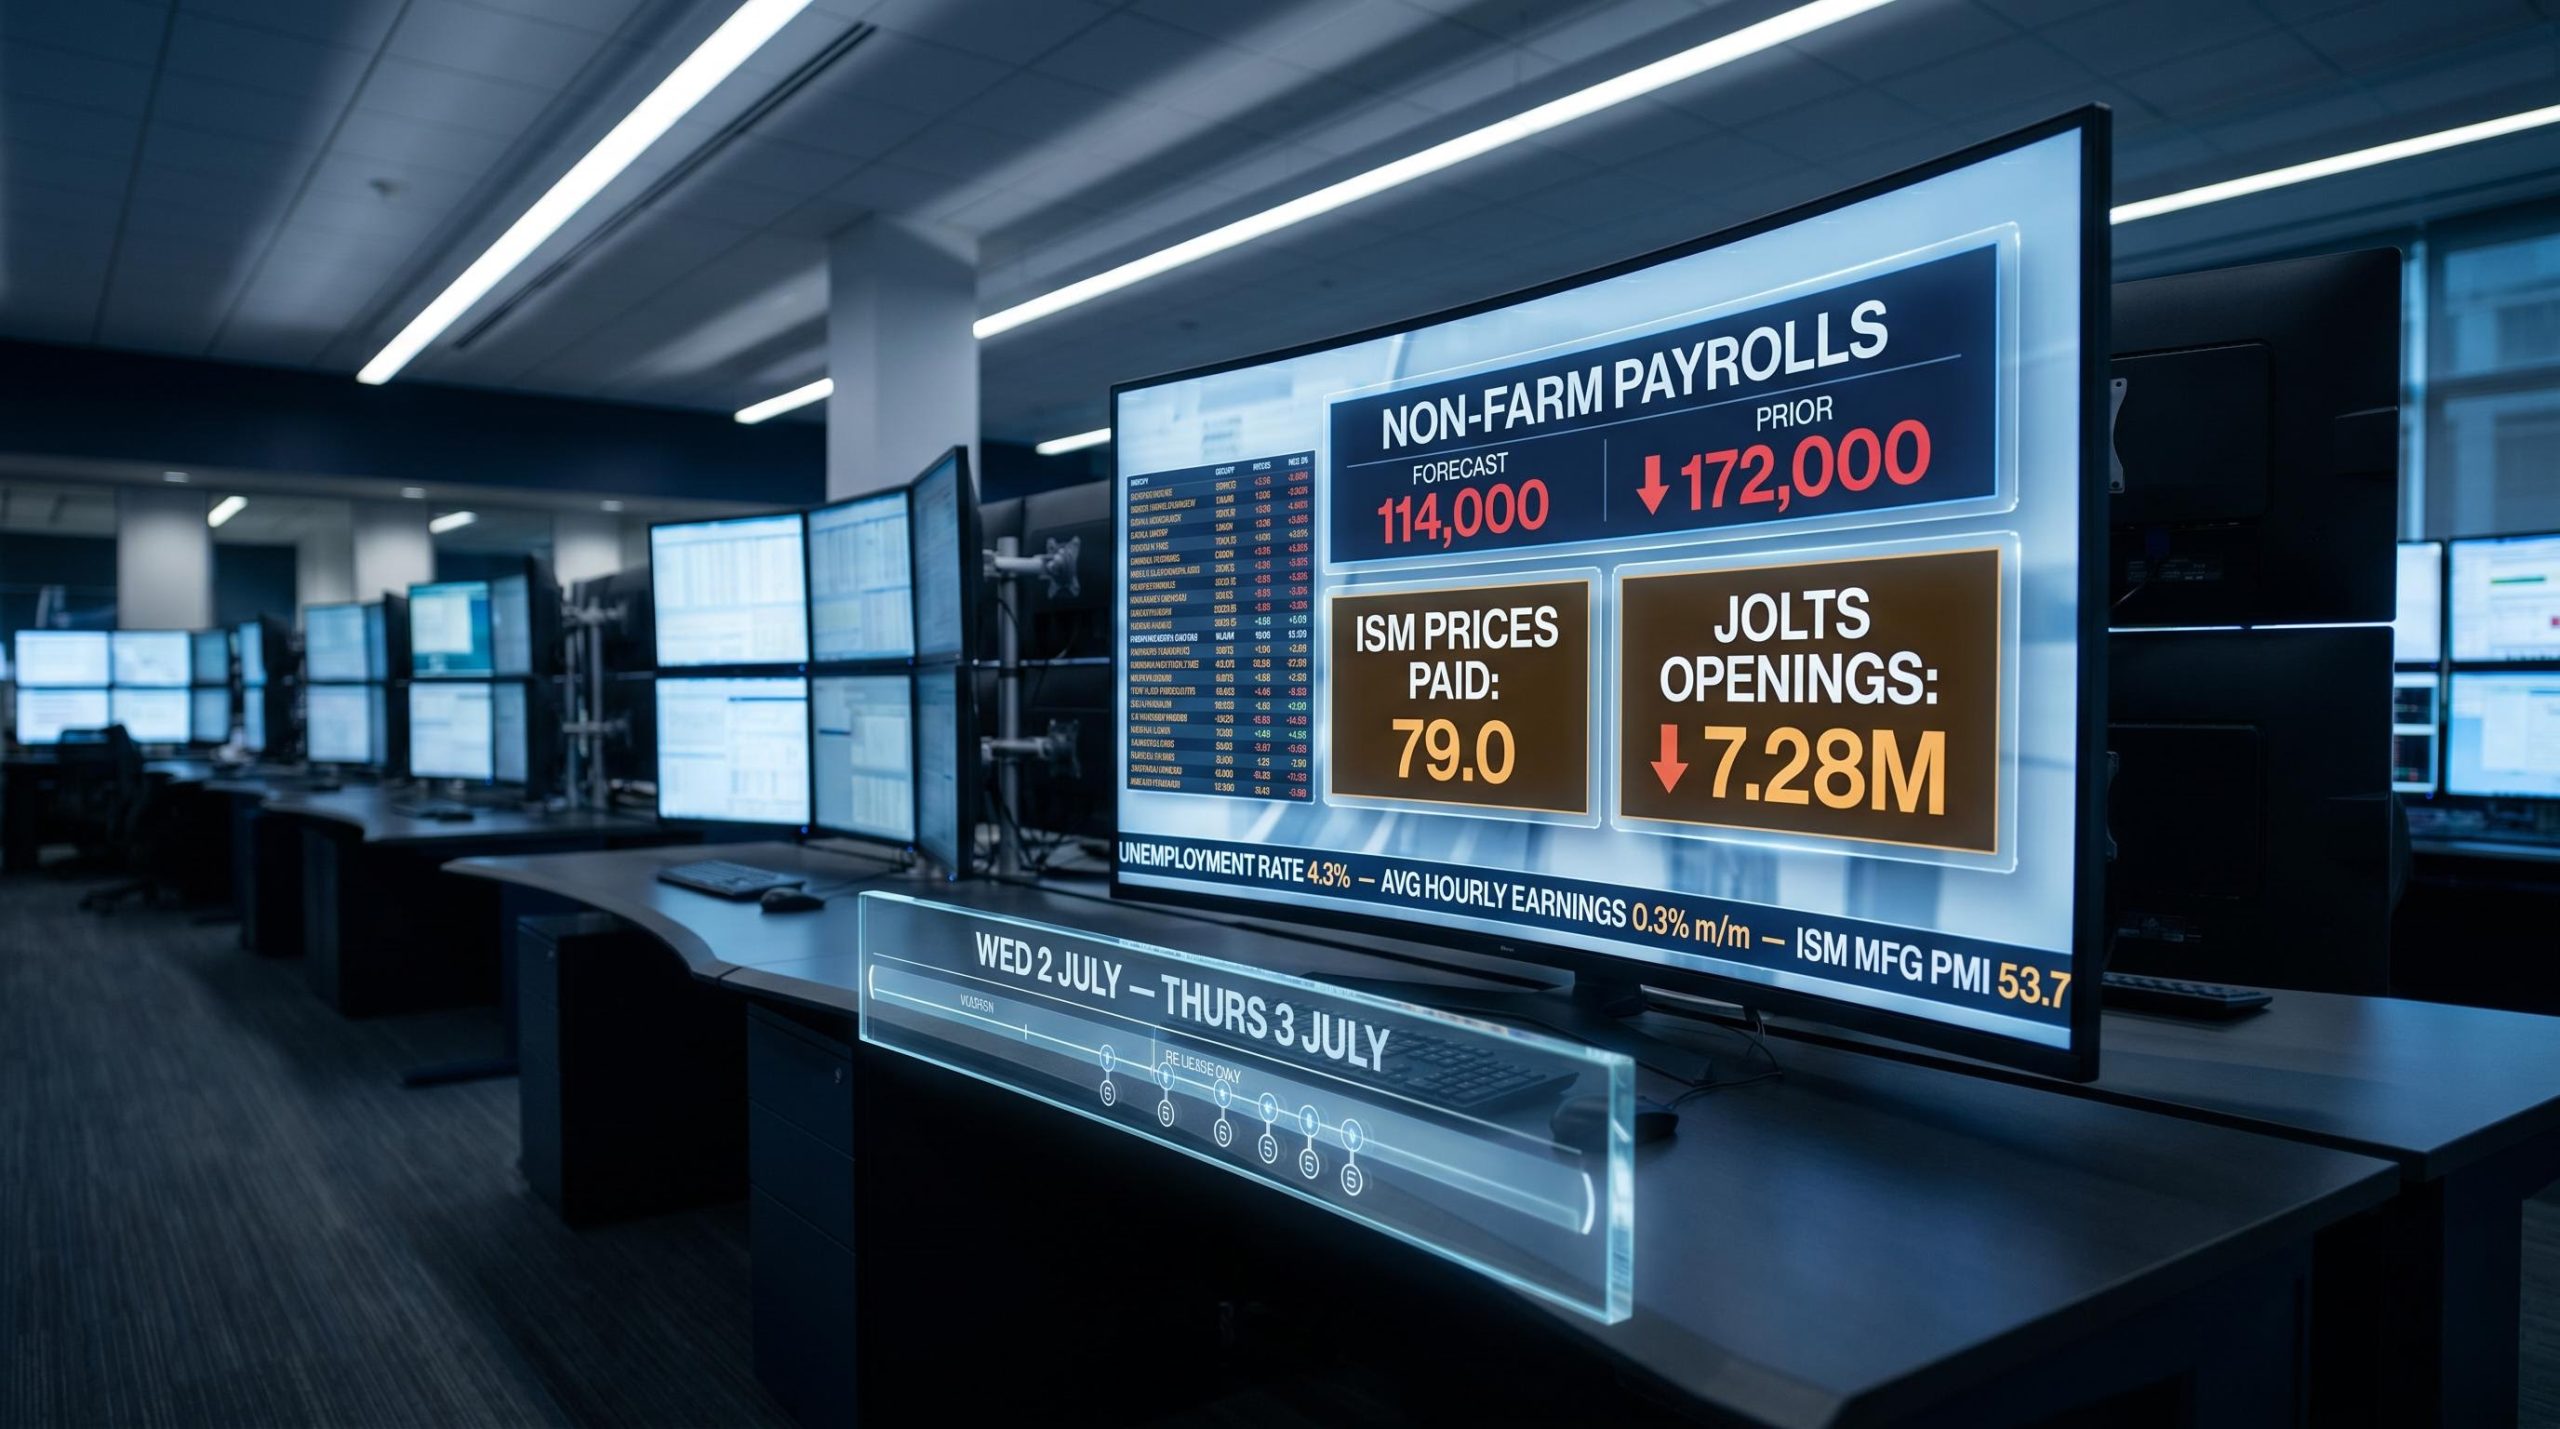
Non-farm payrolls (NFP) measures the total number of paid workers in the US economy, excluding farm employees, government workers, private household employees, and employees of non-profit organisations. It is released monthly by the Bureau of Labor Statistics and is the single most market-moving regular data point in the US, capable of shifting equity, bond, and currency markets simultaneously within minutes.
The June forecast of 114,000 new jobs versus the prior reading of 172,000 is not a neutral baseline. It represents a meaningful deceleration. The gap tells you the labour market is cooling faster than the headline unemployment rate suggests.
The unemployment rate forecast of 4.3% (unchanged) sounds stable, but headline stability can mask underlying weakness. If unemployment holds steady because participation is falling, meaning people stop looking for work altogether, that is a weaker signal than the number implies. Watch participation rate data alongside the headline.
Average hourly earnings are forecast at 0.3% month-on-month, matching the prior reading. That pace annualises to roughly 3.6%, which remains above the level typically associated with 2% inflation. For rate decisions, this matters: wages growing at this pace keep wage-driven inflation on the radar even if job creation slows.
Beyond the headline, composition signals tell you more than the top-line number alone. Private versus government hiring, sector concentration (healthcare and education versus cyclicals), and average hours worked all shape whether markets read the print as orderly softening or something more concerning.
| Metric | Prior reading | Forecast | What a beat or miss signals |
|---|---|---|---|
| Non-farm payrolls | 172,000 | 114,000 | Below 100,000 signals clear labour market cooling; above 150,000 eases recession concerns but revives hawkish rate expectations |
| Unemployment rate | 4.3% | 4.3% | Stability is only reassuring if participation holds; falling participation masks weakness |
| Average hourly earnings (m/m) | 0.3% | 0.3% | Below 0.2% supports disinflation and rate cuts; above 0.4% complicates easing, especially alongside hot ISM prices |
Knowing what to look for beyond the headline gives you a framework to interpret market moves in real time rather than waiting for analyst commentary the next morning.
For readers who want to go deeper on the specific dynamics shaping Thursday’s number, our full explainer on this week’s NFP risk profile examines the World Cup hiring distortions in leisure and hospitality that could produce a compositionally misleading headline, along with the asymmetric downside risk from crowded dollar positioning.
The ISM Manufacturing PMI (Purchasing Managers’ Index) measures activity across the US manufacturing sector. A reading above 50 signals expansion; below 50 signals contraction. The June forecast of 53.7 versus a prior of 54.0 suggests manufacturing is still expanding, just marginally softer. The new orders sub-index within the report is a leading indicator: strong new orders signal forward momentum in production and employment, while soft new orders flag a potential slowdown later in the year even if the headline holds above 50.
That said, the headline PMI is not the figure that matters most this week.
The ISM Manufacturing Prices sub-index, forecast at 79.0 versus a prior of 82.1, is the release most investors are underweighting this week. A reading near 80 represents historically elevated upstream cost pressure, not normalisation. This is the central tension of the entire data window.
Here is why it could override everything else. If NFP prints weak (soft labour) and ISM prices stay near 79 (hot upstream costs), markets encounter a stagflation-like mix: softer growth alongside persistent cost pressures. That combination is uncomfortable for both equities and bonds. Equities face margin pressure from rising input costs and weaker revenue from slowing growth. Bonds face limited room for central banks to ease aggressively, because cutting rates into elevated manufacturing inflation risks reigniting broader price pressures.
The four key sub-indices worth watching within the ISM report:
An ISM prices reading near 79 removes the Fed’s ability to cut rates aggressively even if jobs data weakens. If you are positioned for a “soft labour equals easy Fed” trade, this is the data point that could prevent that trade from playing out as expected this week.
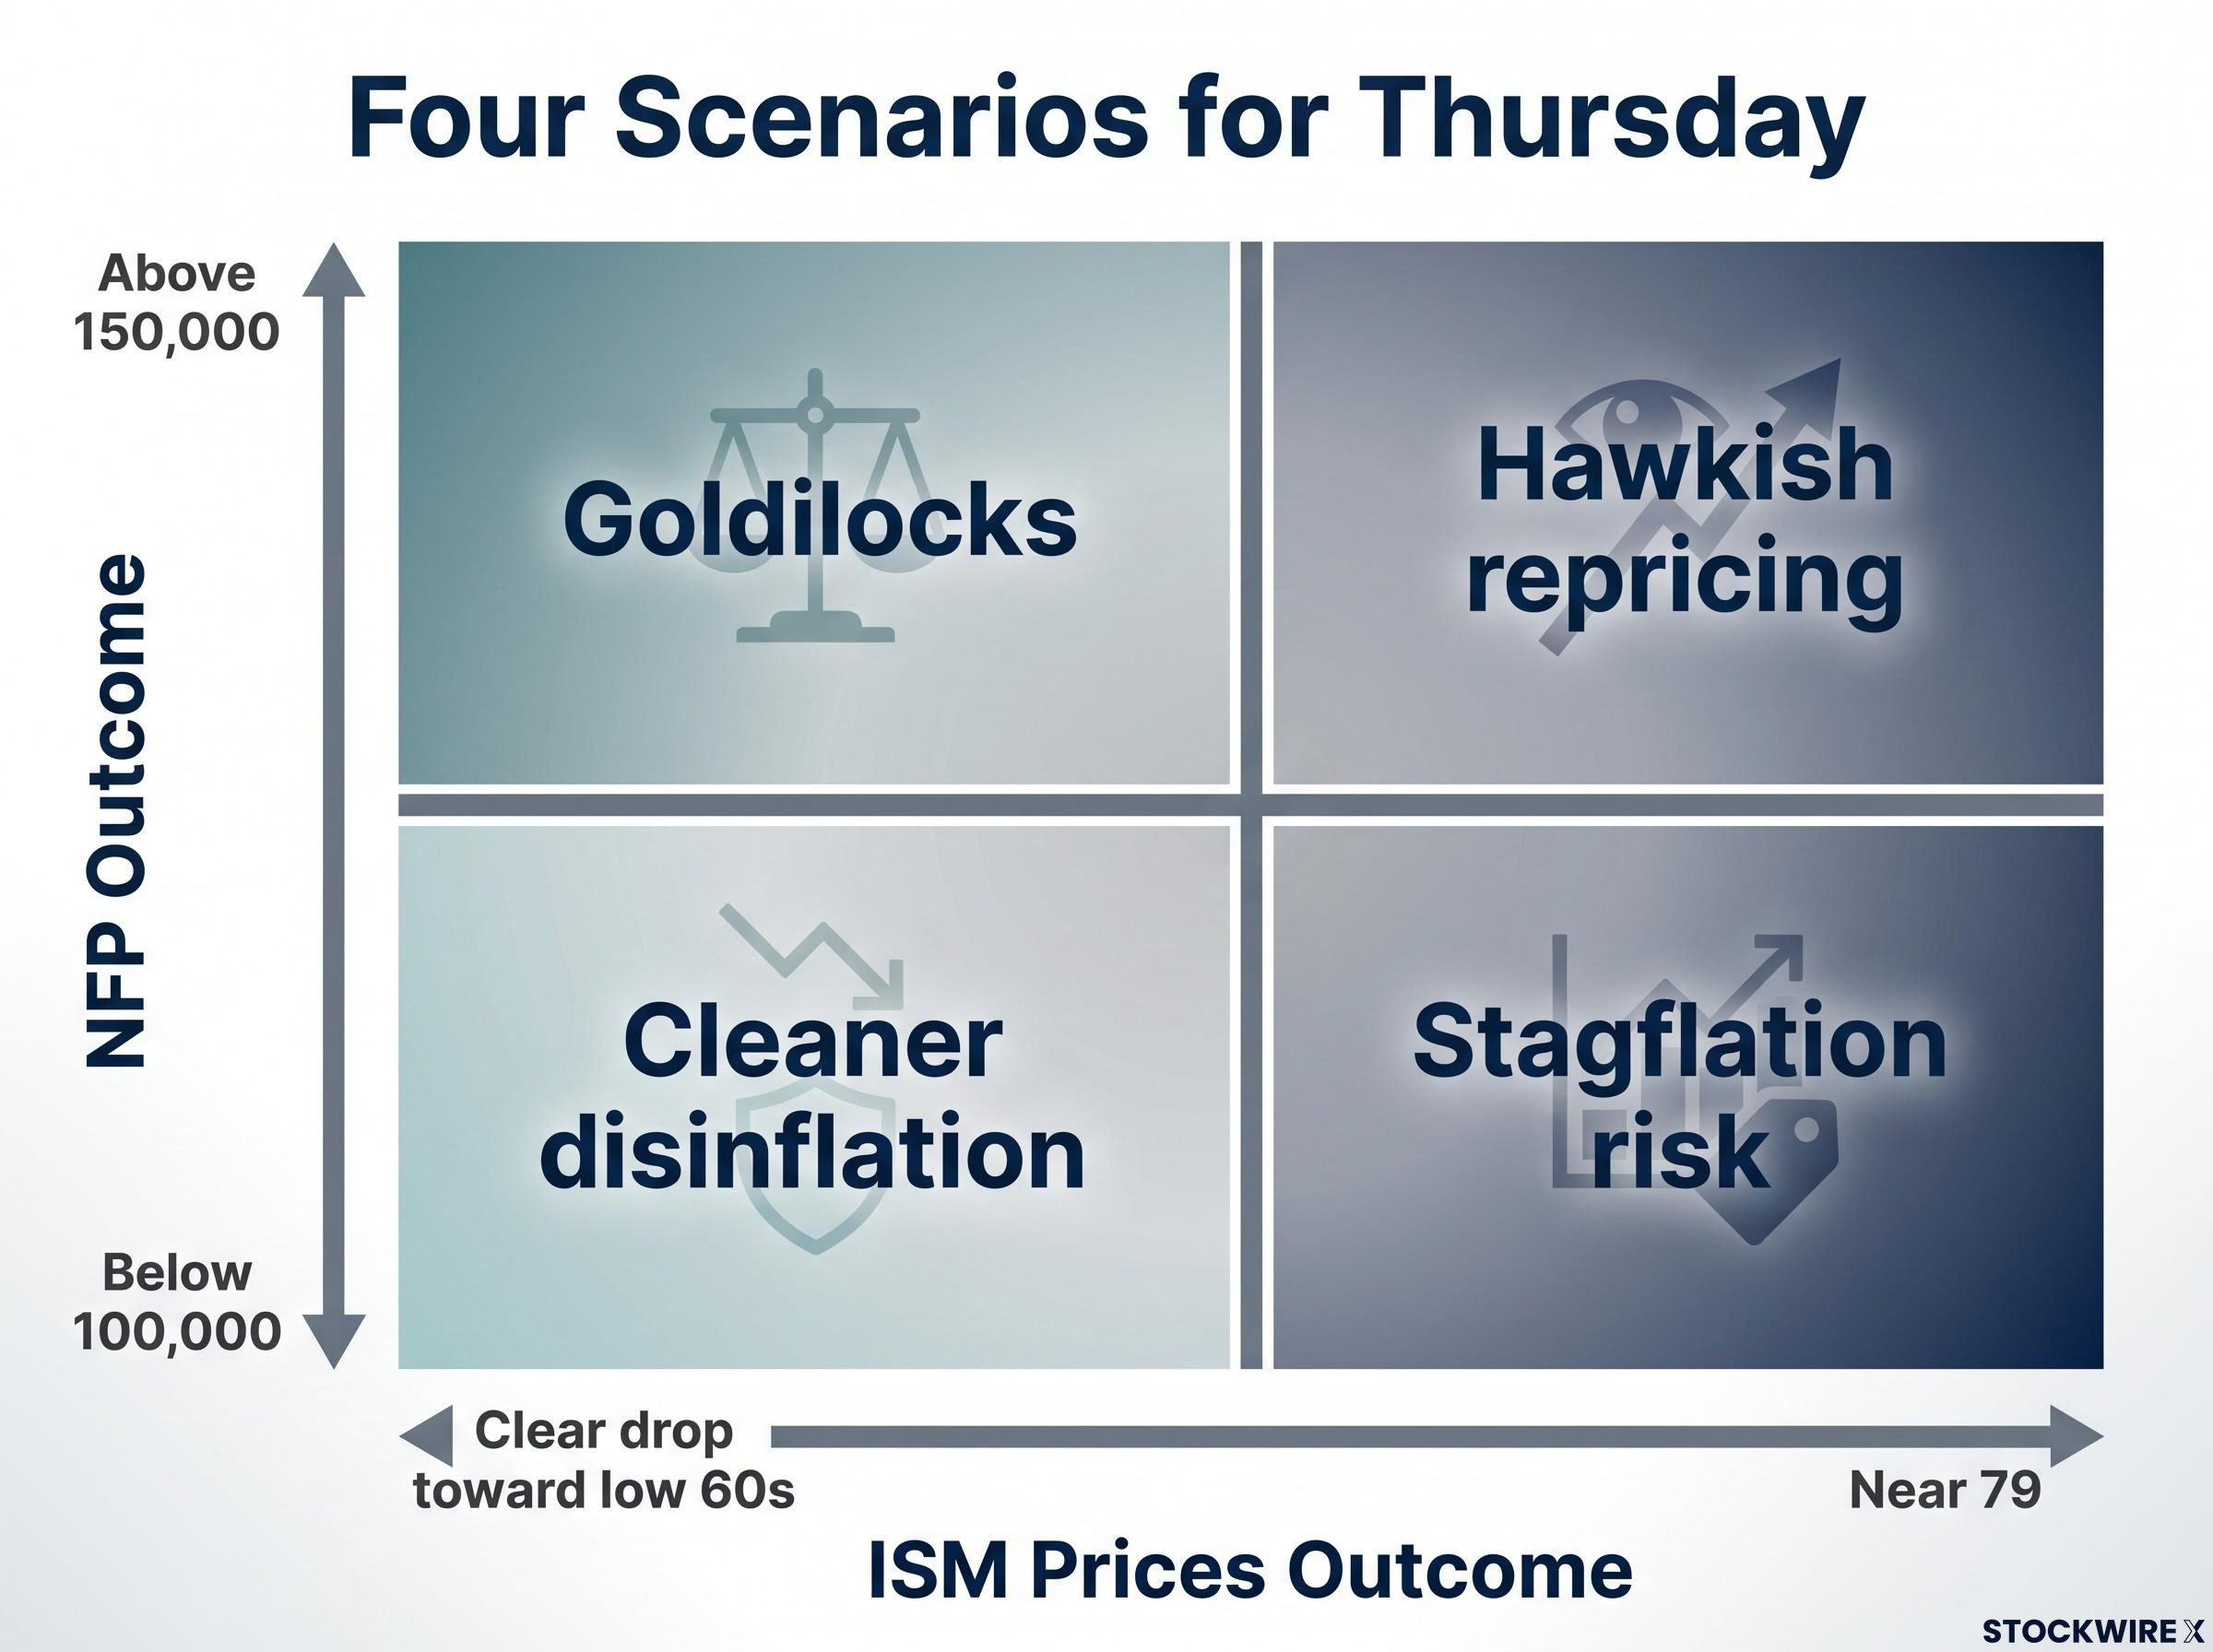
The two most important variables on Thursday are the NFP print and the ISM prices reading. Together, they produce four distinct outcome scenarios. This is a decision tool, not a prediction. Your job is to know in advance which combination would be bullish, bearish, or ambiguous for your specific exposure.
| Scenario | NFP outcome | ISM prices outcome | Likely market narrative | Key asset class implication |
|---|---|---|---|---|
| Soft growth, hot prices | Below 100,000 | Near 79 | Stagflation risk | Bonds rally but duration upside limited; equities and credit under pressure; AUD mixed as USD pulled two ways |
| Soft growth, cooling prices | Below 100,000 | Clear drop toward low 60s | Cleaner disinflation | Bond-friendly; risk assets benefit after initial volatility; most constructive scenario for rate-cut positioning |
| Resilient growth, hot prices | Above 150,000 | Near 79 | Hawkish repricing | Rotation within equities (value and financials outperform duration-sensitive growth); USD strength weighs on AUD |
| Resilient growth, cooling prices | Above 150,000 | Clear drop toward low 60s | Goldilocks | Broadly supportive for risk assets; AUD may benefit from USD softening |
All four scenarios imply some repricing. Only one, resilient growth plus cooling prices, is clearly benign for risk assets.
China’s June PMI data adds a supporting layer worth factoring in:
These readings provide a demand backstop for resources names regardless of US macro direction. They do not override the US scenarios above, but they modify the downside for commodity-linked equities in risk-off outcomes.
Positioning defensively before Thursday is not about predicting which scenario plays out. It is about knowing which of your holdings would be most exposed to each one, so you are acting on a plan rather than reacting to a surprise.
Investors wanting to build a more complete framework before Thursday lands will find our deep-dive into the stagflation versus soft landing debate covers the six major institutional positioning strategies, from Goldman Sachs to PIMCO, that have emerged in response to sub-2% GDP growth alongside elevated PCE inflation.
This section is your practical checklist. Five focus areas, each with a specific action to review before markets open on Wednesday.
The equity valuation dislocations that a prolonged hold produces across growth, technology, and small-cap names are already measurable at historically rare discount levels, which means your sector positioning before Thursday is not only a short-term macro call but also a re-entry or exit decision on valuations that the Fed’s rate path has distorted.
Wednesday sets the tone; Thursday is where the repricing happens. Acting on a plan before the data lands beats reacting to it after.
For additional domestic context: Australian private sector credit rose 0.7% month-on-month in May 2026, above the 0.6% forecast, signalling firm domestic conditions even if global volatility spikes. Australian building approvals data (forecast 0.2% month-on-month versus prior minus 3.4%) also drops on Wednesday, worth monitoring if you hold housing-related equities. And the Eurozone core CPI flash estimate (forecast 2.5% year-on-year) provides context on relative inflation divergence: if Europe is closer to its inflation target while US manufacturing prices stay elevated, USD strength could persist through the week.
This week is not a one-off data dump. The NFP trajectory, wage growth persistence, and ISM prices trend are the three variables that will shape Fed rate decisions for the remainder of the year. That makes early July 2026 a genuine inflection point rather than routine data.
The collective signal from 2-3 July will tell you whether the US is heading toward an orderly soft landing, a stagflationary grind, or a sharper slowdown. That question shapes the global investment backdrop through the second half of the year, across equities, bonds, currencies, and commodities.
If you have built your scenario framework this week, you are better equipped to read subsequent releases, the August NFP, the September FOMC meeting, without being surprised by directional continuations or reversals. The work you do before Wednesday opens pays dividends well beyond the holiday week.
This article is for informational purposes only and should not be considered financial advice. Investors should conduct their own research and consult with financial professionals before making investment decisions. Past performance does not guarantee future results. Financial projections are subject to market conditions and various risk factors.
The major releases are concentrated on 2-3 July and include Conference Board Consumer Confidence, JOLTS job openings, Fed Chair Warsh's speech on Wednesday, followed by non-farm payrolls, the unemployment rate, average hourly earnings, and the ISM Manufacturing PMI with its prices sub-index on Thursday.
The June forecast of 114,000 new jobs, down from a prior reading of 172,000, signals a meaningful deceleration in US labour market momentum, indicating the economy is cooling faster than the headline unemployment rate of 4.3% suggests.
Forecast at 79.0, the ISM prices sub-index represents historically elevated upstream cost pressure; if it stays near 80 while payrolls print weak, markets face a stagflation-like mix that limits the Fed's ability to cut rates aggressively even as growth slows.
Investors should review US equity exposure for sensitivity to a binary macro outcome, check AUD/USD and currency hedging status, assess rate-sensitive holdings like REITs and utilities, and evaluate resources positions in light of China's stable June PMI data, all before markets open on Wednesday 2 July.
Warsh's Wednesday address sets the interpretive frame for Thursday's data: a dovish signal on weaker labour conditions could support risk assets even if payrolls disappoint, while a hawkish lean emphasising sticky manufacturing costs would amplify volatility and risk-off pressure when Thursday's numbers land.