ASX 200 Chart at a Supply Zone Test as NFP Week Looms
2 hrs ago

The June jobs report lands on Thursday instead of Friday this week, and the scheduling shift is the least interesting thing about it. With the Federal Reserve having stripped back its communication playbook to the point where markets receive little in the way of verbal preparation, this single data release must carry interpretive weight that would ordinarily be spread across a week of official commentary.
Markets are currently assigning roughly a 28-30% probability to a rate increase, with the 29 July FOMC meeting as the next live decision point. That is a finely balanced probability, not a one-sided bet, which means Thursday’s numbers can genuinely move the needle in either direction. The dollar has made a notable upside push in recent sessions but technical readings suggest it has stretched into mildly overbought territory, and the asymmetry of the setup becomes clear.
Here is the consensus forecast, the distortions that could make the headline misleading, the three outcome scenarios and what each does to dollar and rate pricing, and the specific framework for reading a jobs report when the Fed is no longer doing your interpretive work for you.
The Bureau of Labor Statistics releases the June employment situation report at 8:30 AM ET on Thursday 3 July 2026, one day earlier than usual because the Independence Day federal holiday falls on Friday. The timing change is procedural. The stakes are not.
The Warsh-led Federal Reserve has moved away from scripted messaging and extensive forward guidance, shifting toward an approach where incoming economic data must speak for itself rather than being pre-interpreted by officials. That means markets must infer the Fed’s reaction function directly from the numbers rather than from prepared speeches or dot-plot narratives. The next decision point is the 28-29 July FOMC meeting, where the federal funds rate sits at 3.50-3.75% and the probability of a hike remains in the region of 28-30%.
The Warsh Fed statement from June delivered a 130-word policy release with zero forward guidance and only 18 dot plot projections, a deliberate overhaul that transferred the interpretive burden for every subsequent data release directly to markets.
The FOMC meeting calendar confirms the July 28-29 session as the next scheduled decision point, with the federal funds rate currently set at a target range of 3.50-3.75% following the Committee’s December 2025 action.
For anyone with dollar, rate, or equity exposure, Thursday’s number lands without the interpretive cushion that prior Fed regimes provided. Every surprise will hit harder. Three practical consequences flow from this low-guidance environment:
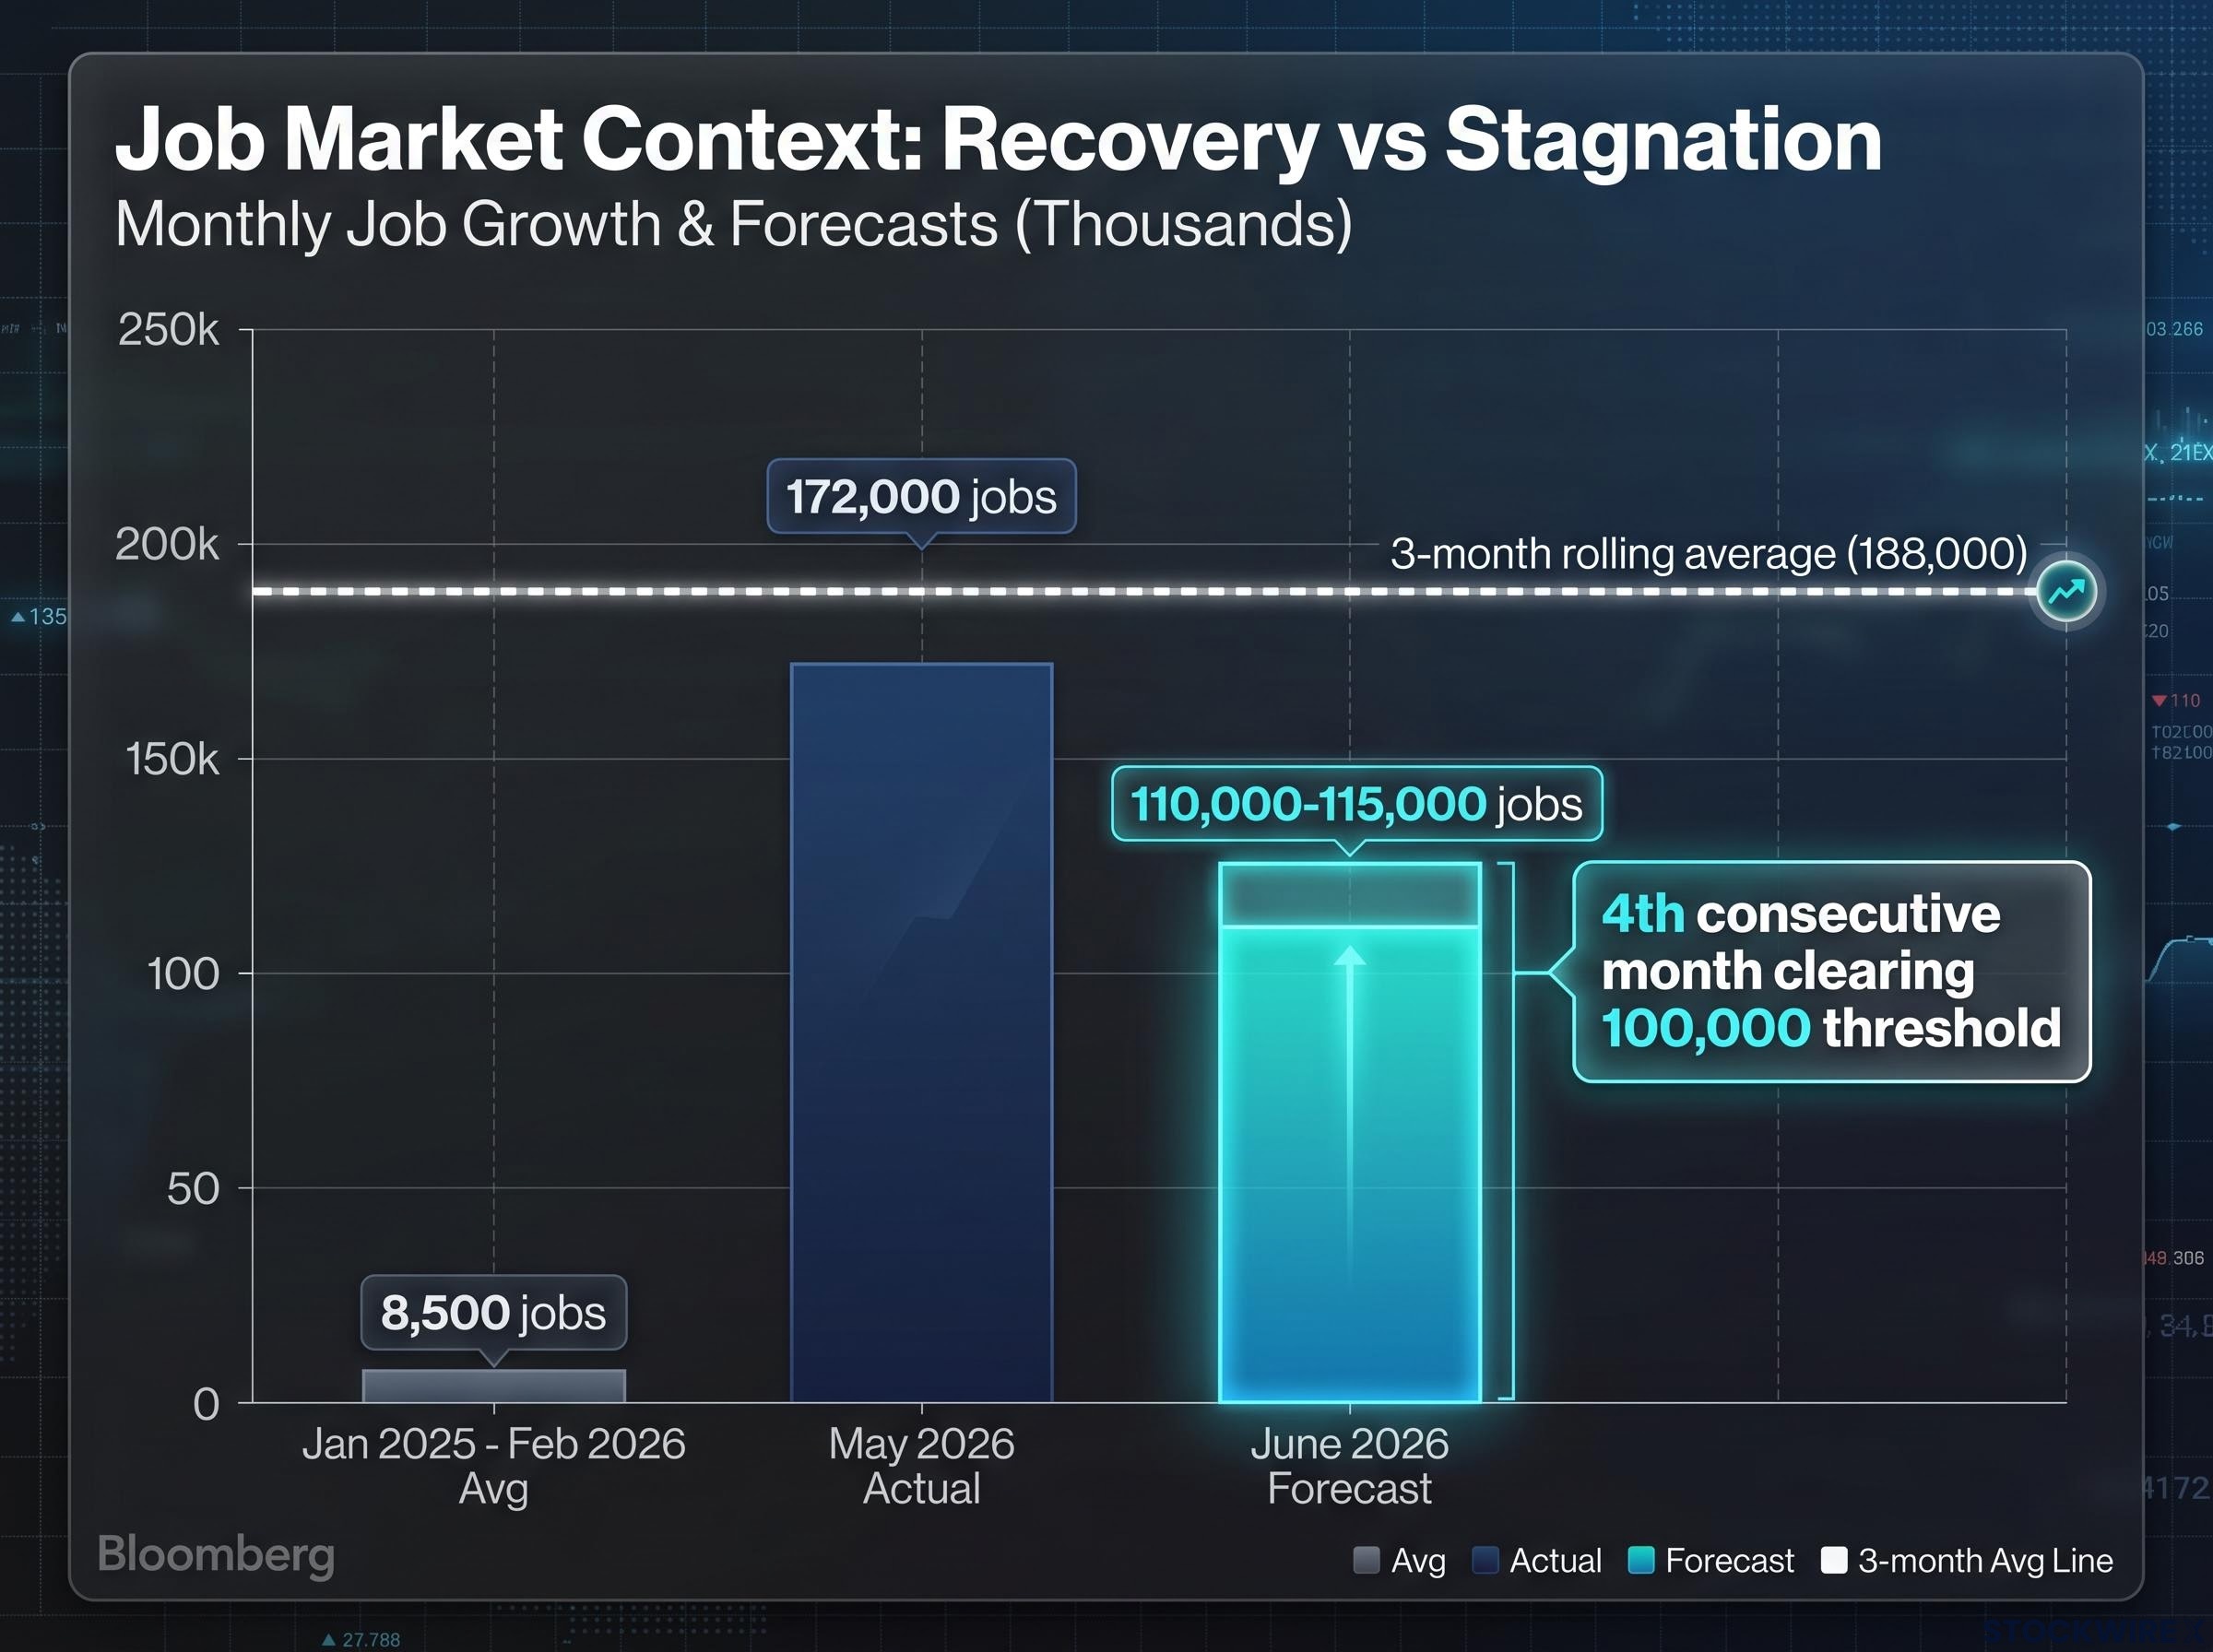
June non-farm payrolls are expected to come in somewhere around 110,000-115,000 jobs, which would fall short of both May’s 172,000 outturn and the three-month rolling average of 188,000. Read in isolation, it looks like a step-down.
Read in context, the picture changes. From January 2025 through February 2026, monthly payroll growth averaged a meagre 8,500 jobs. A result near 115,000 would constitute the fourth consecutive month clearing the 100,000 threshold, which reflects a genuine recovery in hiring momentum from a period of near-stagnation rather than any deterioration from strength.
The May payrolls surprise, which printed at 172,000 against an 85,000 consensus, was accompanied by a 64,000 upward revision to April, confirming that spring 2026 labour market strength was materially underestimated at first release and raising the baseline against which June must now be judged.
| Metric | June 2026 Forecast | May 2026 Actual |
|---|---|---|
| NFP headline | ~115,000 | 172,000 |
| Unemployment rate | 4.3% | 4.3% |
| Wage growth (MoM) | 0.3% | 0.3% |
| Wage growth (YoY) | 3.5% | 3.5% |
Forecasters expect the jobless rate to remain stable at 4.3%, with wages ticking up by 0.3% on the month and holding at 3.5% on an annual basis. These are holding-pattern numbers. Knowing where 115,000 sits in the longer arc prevents a mis-read of a consensus-inline result as a disappointment when the headline hits your screen.
The same headline number can tell two very different stories depending on where the jobs came from. That distinction matters more than usual this month.
The US, Canada, and Mexico are co-hosting the 2026 FIFA World Cup, with matches and related activity ramping through June and July. May’s strong 172,000 print may have been partly inflated by event-related hiring rather than underlying labour demand. If June’s step-down toward 110,000-115,000 is concentrated in those same event-driven categories, it should be treated as compositional payback, not a genuine weakening in demand.
The sectors most likely to carry this distortion:
A soft headline concentrated in obvious World Cup-sensitive categories is noise. A broad-based slowdown across unrelated sectors is a signal. The distinction matters because acting on noise is exactly where retail positioning goes wrong around major data releases.
Signals of real deterioration to watch for:
Most trading desks will parse the sector breakdown immediately after the headline. Understanding this framework before Thursday means you assess the report on the same terms as institutional participants.
The dollar’s starting position shapes every outcome. Having pushed meaningfully higher in recent sessions, it now sits in mildly overbought territory, a technical backdrop that creates an asymmetric setup where a downside surprise has more room to run than an upside beat of comparable scale.
DXY technical positioning tells a more precise story: the index closed above both its 50-day and 200-day moving averages in late June, confirming a medium-term trend shift toward dollar strength that makes the overbought reading a cap on upside extension rather than a reversal signal.
| Scenario | Headline Range | July Hike Probability | Dollar Reaction |
|---|---|---|---|
| Strong beat | Above 150,000 + firmer wages | Moves toward mid-40s% | Extends gains; overbought cap limits follow-through |
| Consensus range | 100,000-130,000, steady unemployment | Holds near ~30% | Choppy, range-bound; focus shifts to CPI/PCE |
| Clear miss | Below 90,000 or rising unemployment | Drops toward mid-teens% | Gives back recent gains as crowded longs unwind |
A strong beat with firmer wages pushes the re-acceleration narrative and lifts July hike odds, but the overbought starting point caps how far the dollar can extend before profit-taking kicks in. A consensus-range result changes little; July odds hold, the dollar chops, and attention shifts to upcoming inflation prints.
The asymmetric risk sits with the miss scenario. With the dollar mildly overbought and long positioning crowded, weak data likely generates a larger move than a beat of equal magnitude. For anyone holding dollar-sensitive positions, the scenario that matters most is not the most likely one, but the one that represents the biggest gap between current positioning and the incoming data.
Revisions to May’s 172,000 are an independent swing factor. A significant downward revision could move pricing even if June’s headline lands in line with expectations.
In the current Warsh Fed environment, where official guidance has been deliberately pared back, the granular detail inside each report carries far greater market-moving potential than it did when officials routinely pre-framed data for participants. Previously, verbal guidance from officials often pre-digested data surprises before markets had to process them. That buffer is gone.
This means the initial post-8:30 AM ET price move is often driven by positioning clearance rather than considered macro inference. The spike is about liquidity, not consensus. Respect it, but do not assume it is telling you the correct direction.
The framework for Thursday morning comes down to three steps:
“Does this move July 29?” That is the single filter question that should govern your interpretation of every line in Thursday’s report.
One nuance worth noting: a rise in the participation rate that mechanically lifts unemployment slightly can actually be a positive signal. It means more workers are entering the labour force rather than demand deteriorating. That distinction is the kind of internals-level reading that separates signal from noise in a low-guidance world. The reader who understands the full report framework will consistently identify the real signal before the market consensus settles on its narrative.
The most probable outcome, a near-consensus print of 110,000-115,000 with 4.3% unemployment and unchanged wages, validates gradual cooling without resolving the bigger question. July hike odds hold near 30%. The dollar stays broadly range-bound after intraday noise. Nothing is settled definitively for the rate path.
That is the point. Thursday is a high-resolution data point in a sequence, not a binary verdict on the rate cycle.
Several variables remain live after Thursday regardless of the outcome:
Thursday tells you which scenario you are in. The 29 July meeting is where that scenario, combined with inflation data and any revisions, resolves into a rate decision that directly affects borrowing costs, dollar valuations, and equity multiples. Understanding that Thursday updates probabilities rather than answering the question prevents the common mistake of over-trading the initial reaction.
For investors wanting the broader macro context behind the current 28-30% July hike probability, our full explainer on how rate expectations flipped traces the complete repricing from 50-75 basis points of cuts to active hike risk across the ten-week window that preceded this report.
This article is for informational purposes only and should not be considered financial advice. Investors should conduct their own research and consult with financial professionals before making investment decisions. Past performance does not guarantee future results. Financial projections are subject to market conditions and various risk factors.
The Non-Farm Payrolls report, published monthly by the Bureau of Labor Statistics, measures the net change in employed workers across most US industries and is the single most market-moving scheduled data release for dollar, rate, and equity positioning.
The June 2026 employment situation report is scheduled for release at 8:30 AM ET on Thursday 3 July 2026, one day earlier than the usual Friday schedule because the Independence Day federal holiday falls on Friday that week.
Forecasters expect roughly 110,000-115,000 jobs added in June, with the unemployment rate holding at 4.3% and monthly wage growth of 0.3%, representing a step-down from May's 172,000 but a continuation of recovery from early 2025's near-stagnation.
The US, Canada, and Mexico are co-hosting the 2026 FIFA World Cup, which inflated May's headline with event-related hiring in leisure, hospitality, travel, and media; a June softness concentrated in those same categories is a compositional reversal, not evidence of weakening underlying demand.
With the dollar already in mildly overbought technical territory after recent gains, a clear miss below 90,000 jobs or a rise in unemployment would likely trigger a sharper reversal than an equivalent upside beat could extend gains, as crowded long positions would unwind rapidly.