
ANZ Group Holdings shares surged 4.3% in a single session on 13 August 2026, reaching A$37.97 intraday, after the bank’s third-quarter FY26 trading update delivered the one signal the market had been watching for: evidence that margins are recovering and the profit floor is rising.
The result lands at a moment when Australian bank investors are weighing whether the Big Four’s post-rate-cycle positioning is translating into actual earnings improvement. ANZ’s quarterly update, while unaudited, offers the clearest signal yet that the bank’s productivity push and Suncorp Bank integration are generating measurable returns.
Here is what the specific numbers tell you about ANZ’s trajectory, and what the market’s reaction does and does not confirm. The rally looks grounded in fundamentals, but a single quarterly update leaves several questions open.
What drove ANZ shares 4.3% higher in a single session
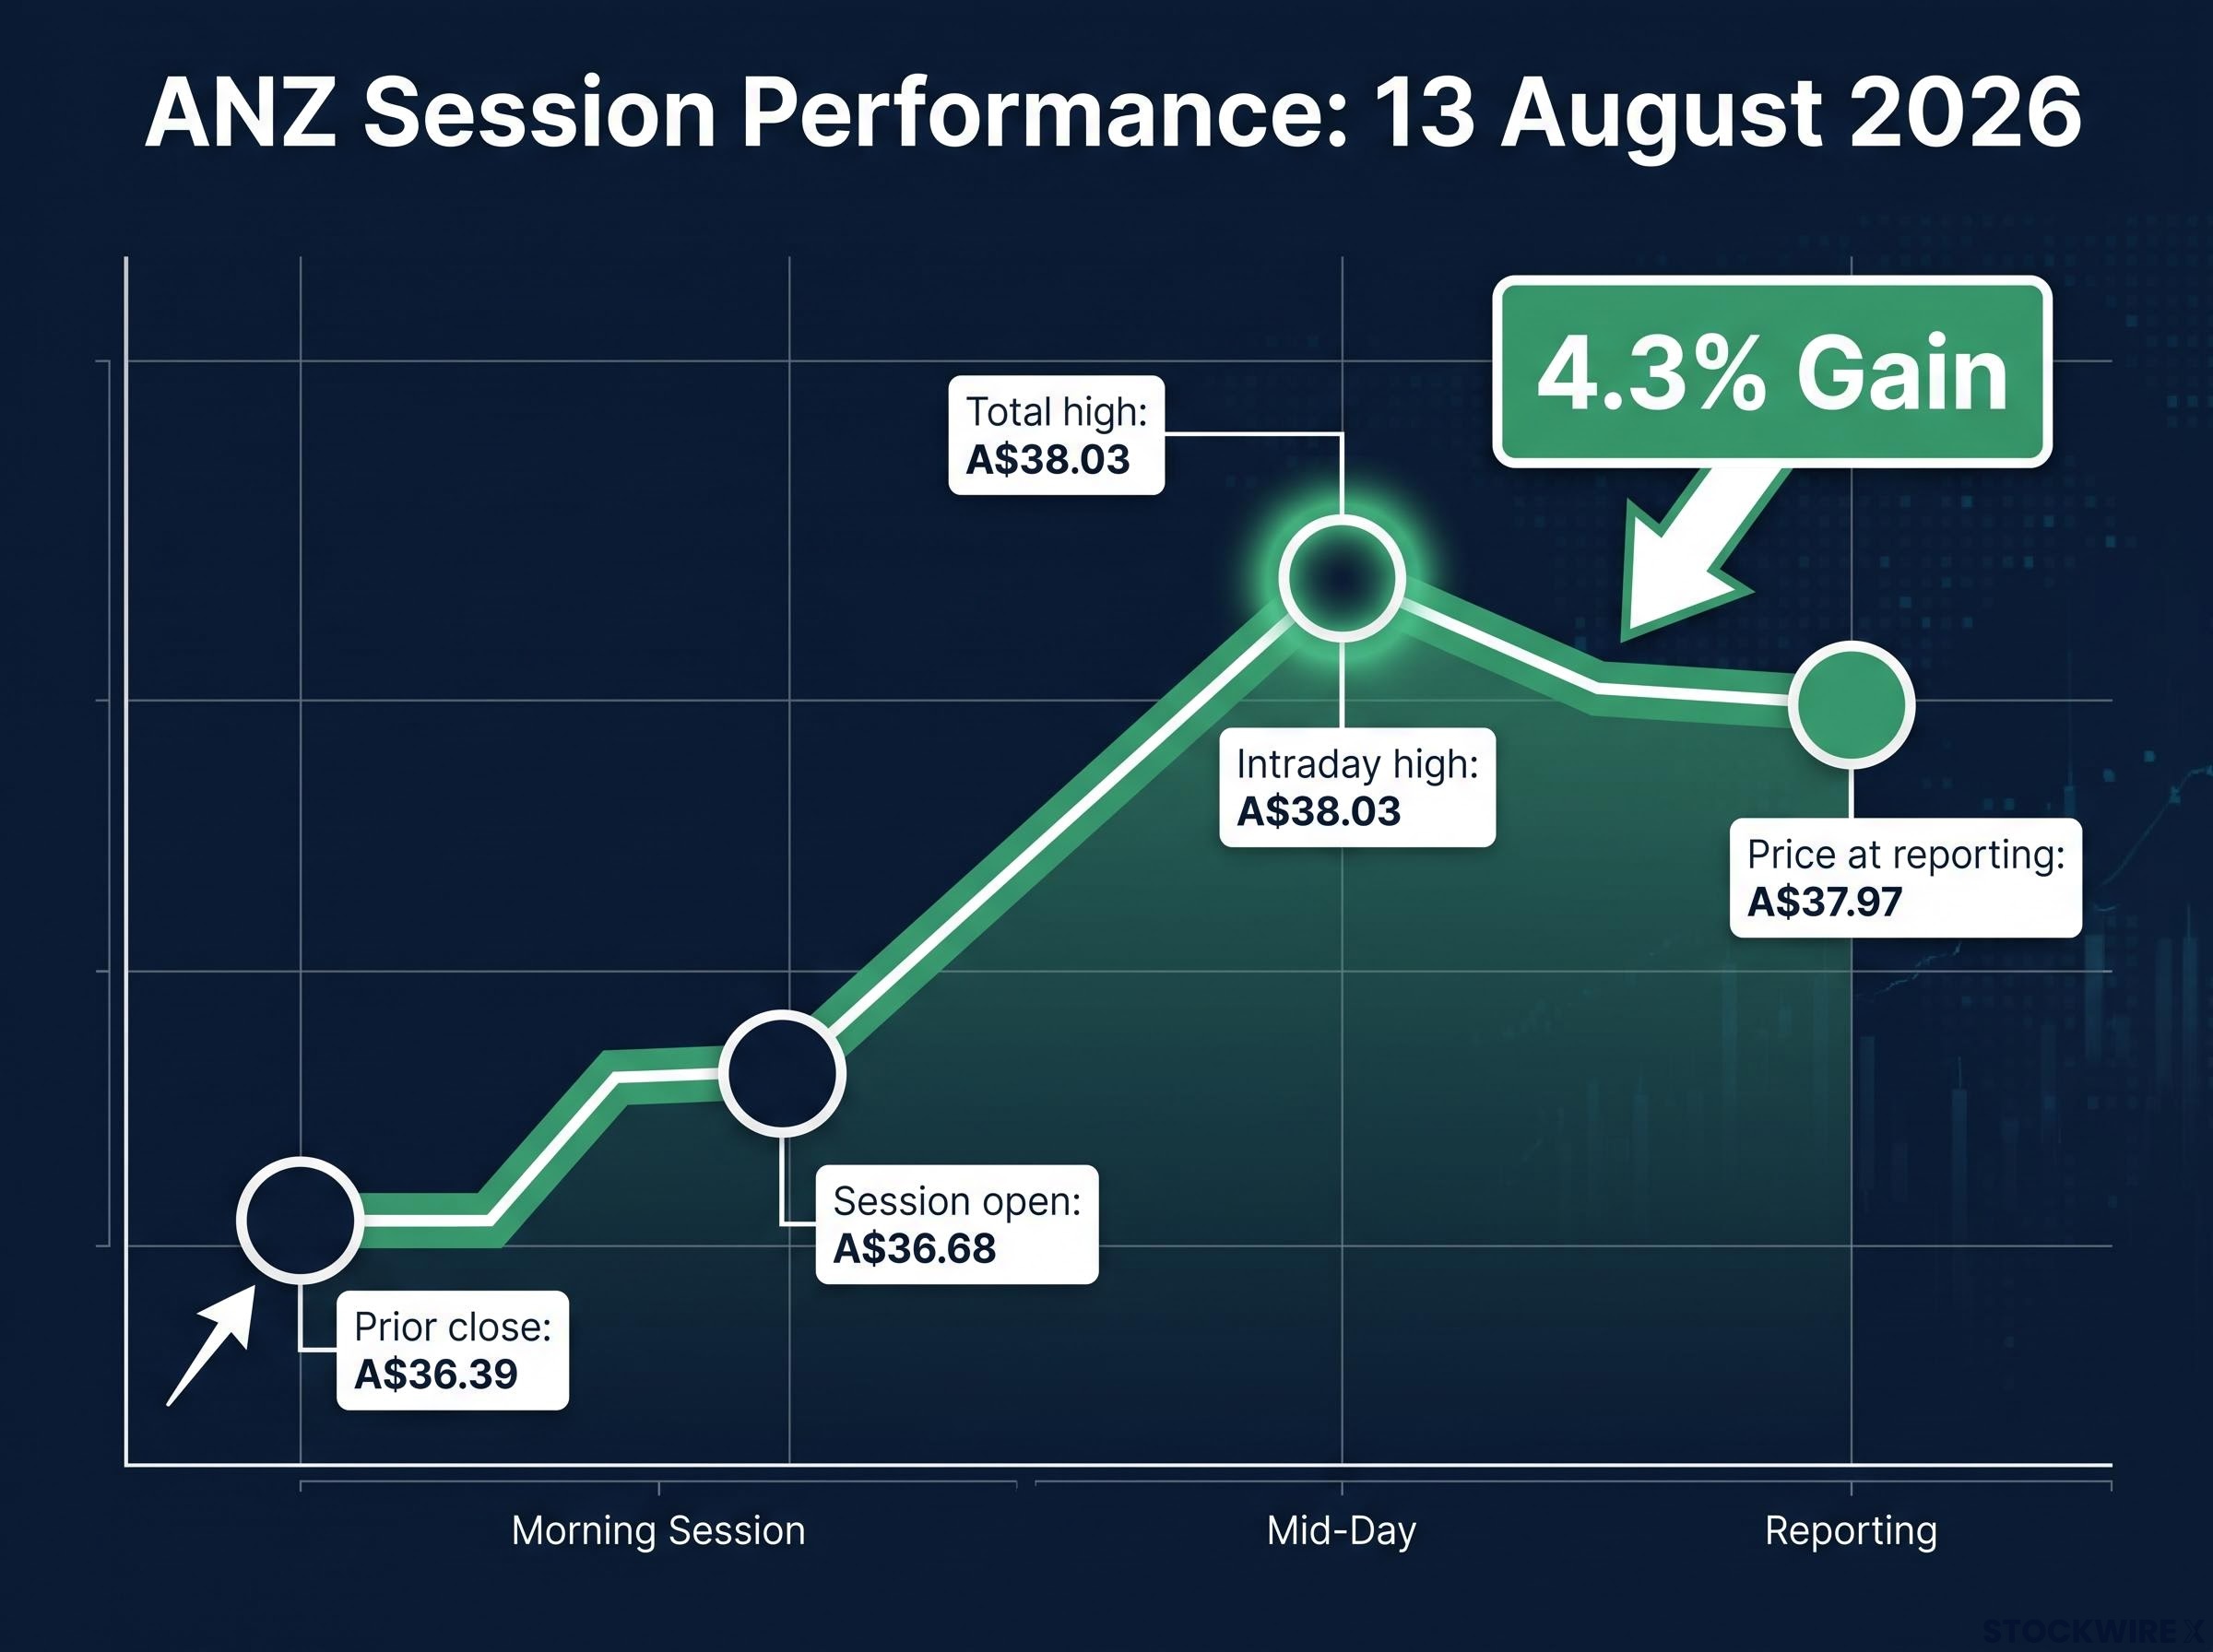
The price action told the story before the commentary did. The session began with ANZ trading at A$36.68, against a prior close of A$36.39, and the stock held its gains throughout the day. Late in the afternoon, the price climbed as far as A$38.03, marking a 4.5% advance at the peak, before easing slightly to around A$37.97 at the time of reporting, a 4.3% gain that put ANZ sixth on the ASX 200 leaderboard for the session.
A 4.3% single-session move in a Big Four bank is not routine volatility. It tells you the market had priced in a weaker result and was forced to reprice quickly when the data came in ahead of expectations.
Two catalysts drove the buying: a net interest margin (NIM) improvement that signalled the bank’s core lending operations are capturing more margin per dollar lent, and a quarterly cash profit that came in above the first-half average. Investor concern about a post-budget decline in mortgage applications was set aside entirely in the session’s reaction, which is itself a signal worth noting.
The broader context for the session’s 4.3% gain matters: analysis of sector valuation heading into August results had flagged NIM guidance, loan growth, and capital ratios as the three variables most likely to move ASX bank shares, and ANZ’s Q3 update delivered on all three fronts simultaneously.
- Prior close: A$36.39
- Session open: A$36.68
- Intraday high: A$38.03 (4.5% gain)
- Price at reporting: A$37.97 (4.3% gain)
- Calendar year-to-date gain: 4.2%
- 12-month appreciation: 19.1%
When big ASX news breaks, our subscribers know first
Cash profit rises, margins improve: what the Q3 numbers actually show
Start with the margin, because that is where the earnings story begins. The group NIM widened by 1 basis point to reach 1.54%, and once the markets division is removed from the calculation, the gain was 4 basis points, a more meaningful read on the underlying retail and business banking franchise. Stripping out markets, net interest income advanced 2% in Q3, which confirms the margin improvement is feeding directly into the income line.
The margin gains contributed to a quarterly cash profit of A$1.9 billion, which came in 1% ahead of the 1H FY26 quarterly average. At the revenue level, operating income of approximately A$5,607 million was broadly unchanged against the 1H average of A$5,602 million. Cash return on tangible equity (RoTE), the percentage return the bank generates on its equity base after stripping out intangible assets, sat at 11.54%, down 2 basis points on the first-half average.
| Metric | Q3 FY26 result | 1H FY26 average | Change |
|---|---|---|---|
| Cash profit | A$1.9 billion | A$1.88 billion | +1% |
| Operating income | A$5,607 million | A$5,602 million | Flat |
| Group NIM | 1.54% | 1.53% | +1 basis point |
| NIM excl. markets | — | — | +4 basis points |
| Cash RoTE | 11.54% | 11.56% | -2 basis points |
Reading the cost line beyond the headline number
The quarter’s total expenses were 1% higher, but that figure carries a significant distortion: it absorbs a NZD$125 million pre-tax legal provision tied to a New Zealand class action whose ruling was handed down on 5 May 2026 and which ANZ is contesting on appeal. Once that one-off item is excluded, the underlying cost base actually contracted by 3%, driven by simplification initiatives and a tightening of third-party expenditure.
Full-year FY26 cost guidance was left unchanged by ANZ, a signal that management views the cost trajectory as intact and on target. The 3% decline in underlying costs is the figure that matters for assessing whether the bank’s cost discipline is real or whether the headline was flattering a messy quarter. In this case, it looks real.
ASX bank stock valuation frameworks that rely on price-to-earnings ratios alone tend to misread quarters like this one, where a single legal provision inflates the cost line and obscures the underlying cost trajectory; balance sheet metrics such as CET1 ratios and NIM trends provide the more stable read.
What ANZ’s capital position signals about dividend capacity and risk buffer
The Common Equity Tier 1 (CET1) ratio, the primary measure of a bank’s core capital relative to its risk-weighted assets, finished the quarter at 12.51%, having strengthened by 12 basis points relative to the March 2026 quarter and by 57 basis points against the June 2025 quarter.
A 57-basis-point year-on-year improvement in CET1 tells you the bank’s capital buffer is strengthening, not just holding.
What makes this figure more significant is that it arrived alongside balance sheet growth, not balance sheet shrinkage.
- CET1 ratio: 12.51% (up 12 basis points quarter-on-quarter; up 57 basis points year-on-year)
- Customer deposits: A$786 billion (up 2% on March 2026 quarter)
- Total loans and advances: A$846 billion (up 3% on March 2026 quarter)
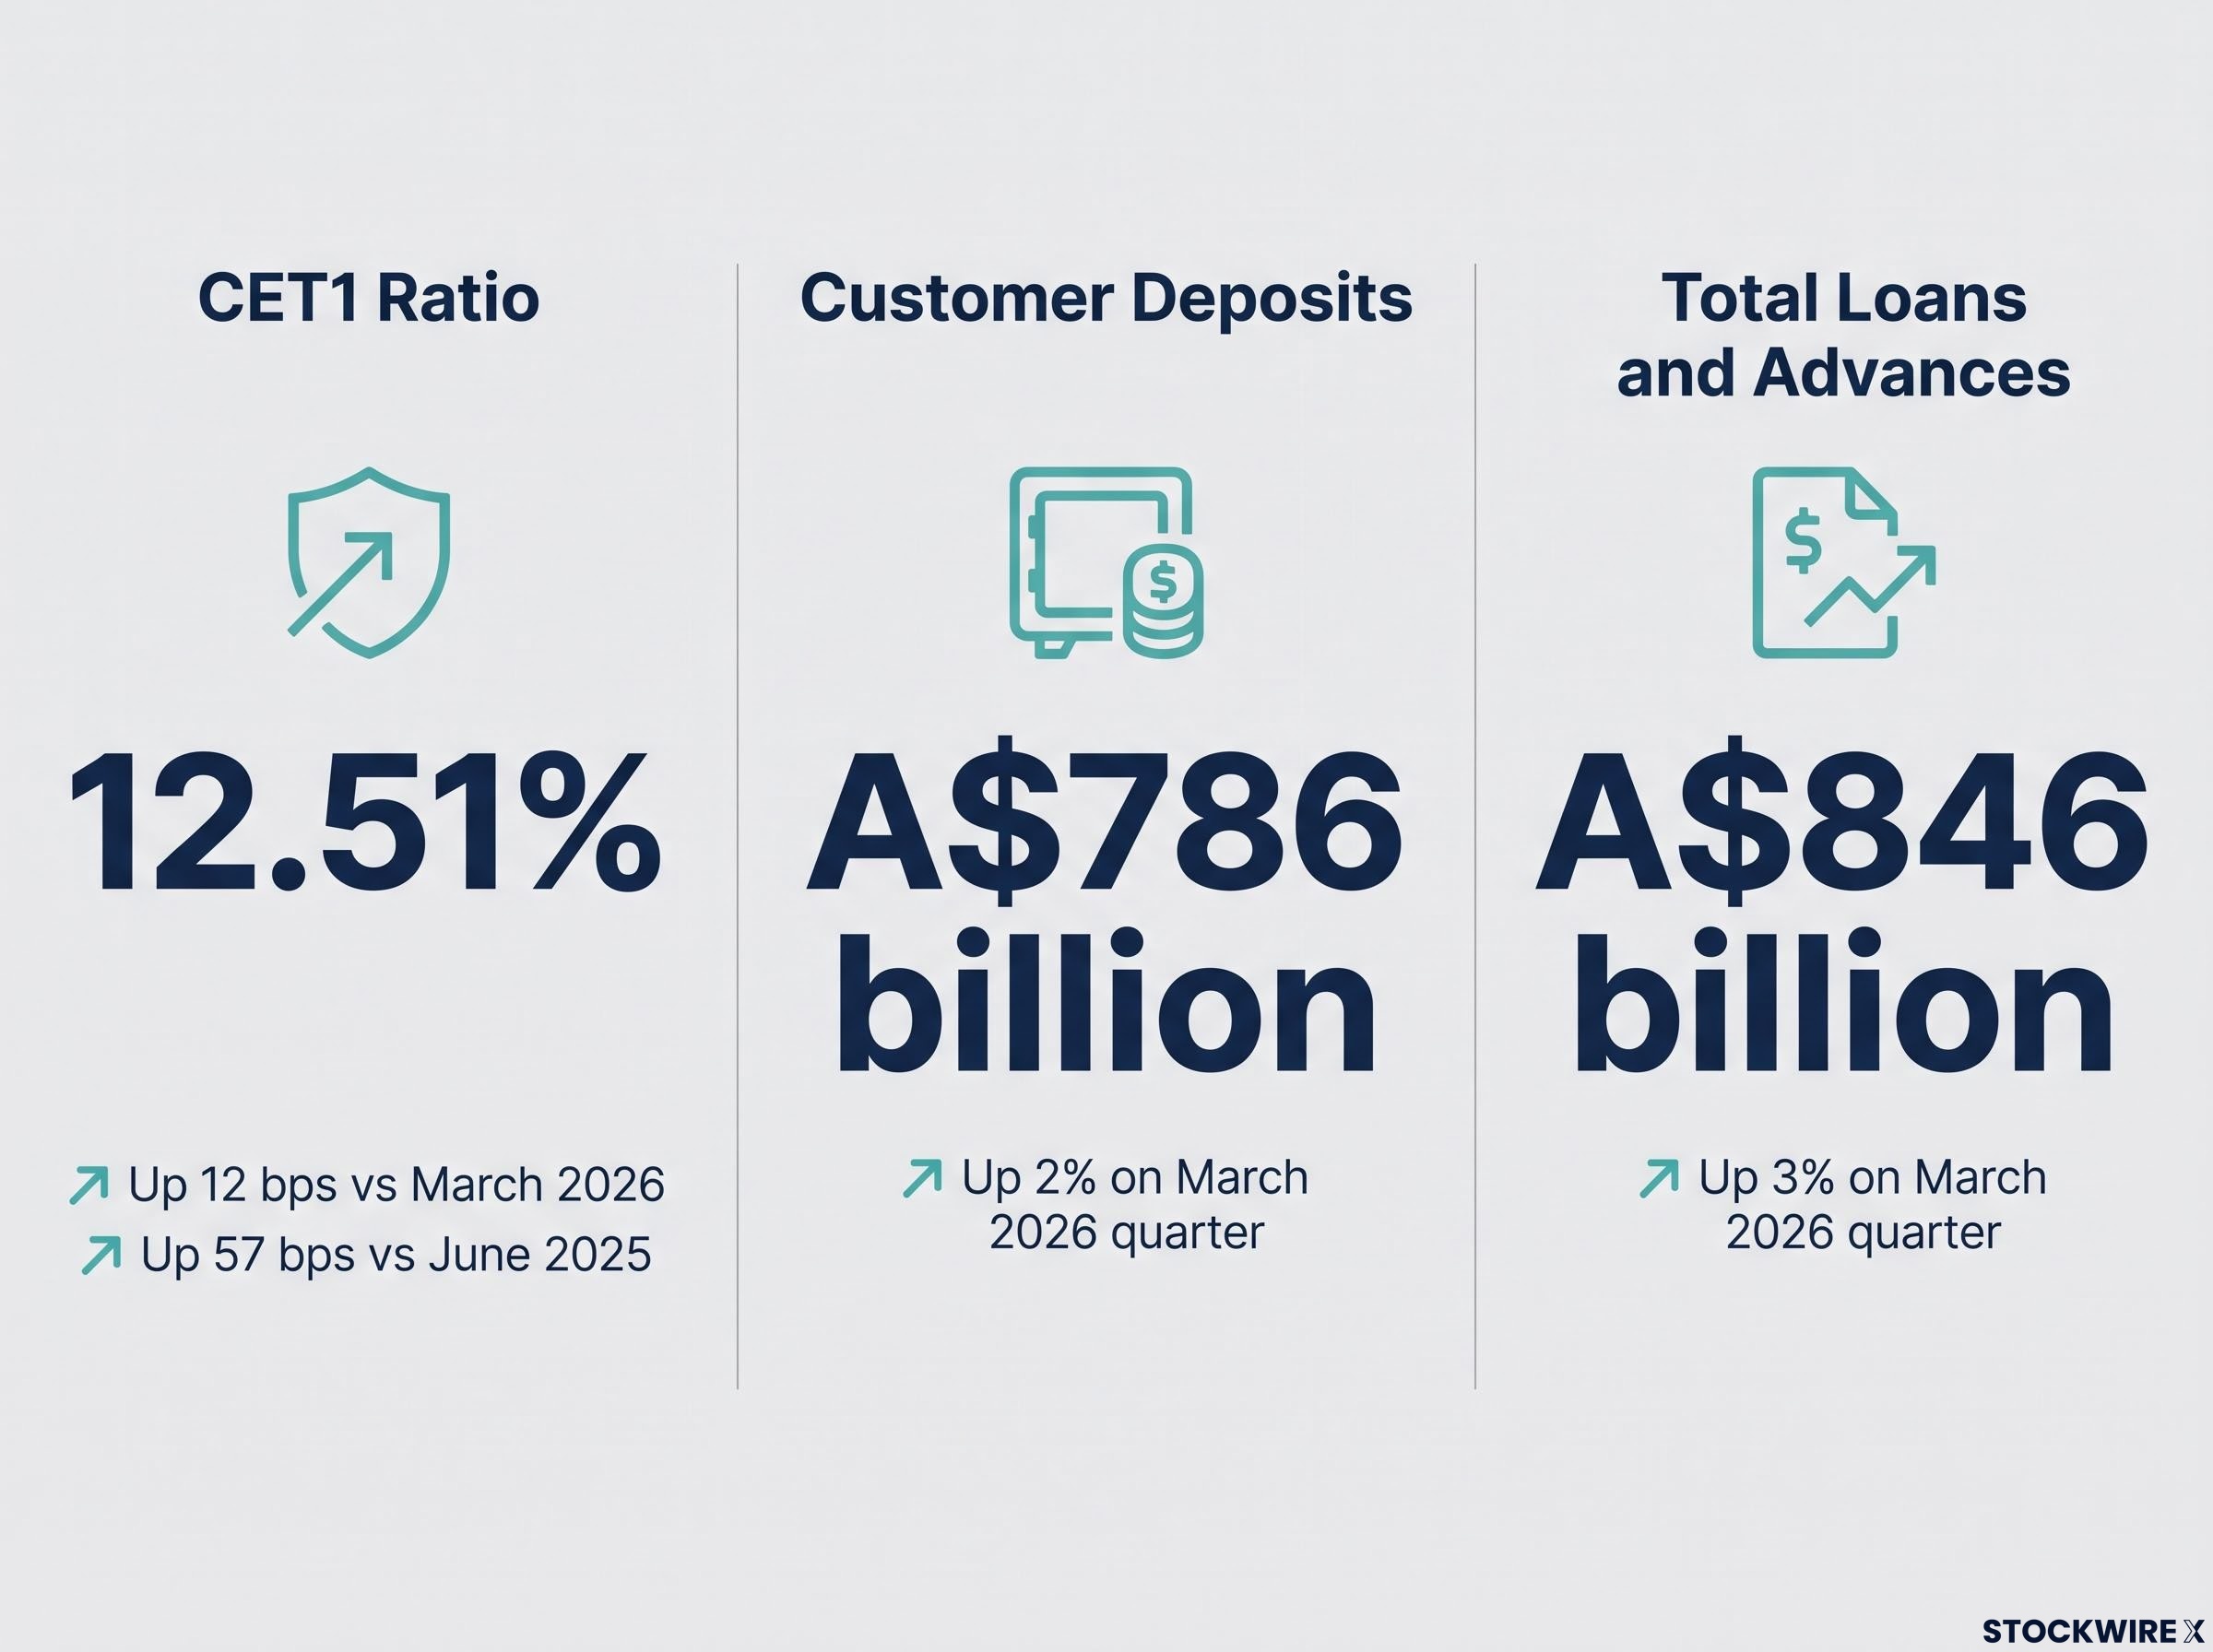
A CET1 ratio rising while the loan book grows by 3% tells you that ANZ is not stretching its capital base to chase volume. It is growing within its risk envelope. For context, major Australian bank CET1 ratios generally sit in the low-teens, and ANZ’s 12.51% is consistent with that peer range. The combination of capital strength and loan book expansion reduces the probability of a capital raise that would dilute existing shareholders, and supports the bank’s capacity to sustain and grow dividends.
APRA’s APS 110 capital adequacy standard sets the minimum CET1 requirements and buffer ranges for Australian authorised deposit-taking institutions, establishing the regulatory floor against which ANZ’s 12.51% ratio is measured.
Understanding NIM and why a 1 basis point move matters at ANZ’s scale
One basis point sounds trivial. It is not, at this scale.
- What NIM measures: Net interest margin is the difference between what a bank earns on loans and what it pays on deposits and funding, expressed as a percentage of average interest-earning assets. It is the single most direct measure of a bank’s core lending profitability.
- Why the ex-markets figure matters more: ANZ reports NIM two ways, with and without its markets division. The markets division contributed A$507 million in income during Q3, but that revenue is more volatile and structurally different from lending margin income. Including it smooths and distorts the group NIM as an indicator of how the core bank is performing. The ex-markets NIM is the cleaner read for retail investors.
Why the markets division is stripped out for NIM analysis
The markets division trades fixed income, currencies, and commodities. Its income swings quarter to quarter based on trading conditions, not on the spread between deposit rates and loan rates. At A$507 million in Q3, markets income is material enough to move the group NIM figure in ways that obscure what is happening in the retail and business banking operations. That is why analysts focus on the ex-markets NIM as the stability indicator.
ANZ’s group NIM of 1.54% sits within the 1.4-1.6% range characteristic of Australian major bank peers. The 4-basis-point improvement in NIM excluding markets is the operationally significant figure. When a bank with A$846 billion in loans improves its core margin by 4 basis points, the compounding effect on full-year net interest income is material. This distinction matters: if you can identify whether ANZ’s earnings improvement is structural (margin-driven) rather than cyclical (volume-driven), you can better assess whether the current share price represents fair value.
The 4-basis-point ex-markets improvement is meaningful precisely because prior analysis had documented a NIM gap to peers of 33-35 basis points, with every basis point of recovery feeding directly into the income line at a loan book scale of A$846 billion.
The RBA’s August 2026 monetary policy statement sets out the cash rate path and inflation outlook that directly shapes the lending rate environment in which ANZ’s margin recovery is occurring, providing the macroeconomic backdrop behind the NIM improvement.
CEO Nuno Matos reaffirms targets: what progress on Suncorp and the tech platform means for investors
In his commentary on the Q3 result, Nuno Matos reiterated that ANZ is tracking to deliver on its full-year RoTE and cost-to-income commitments. The specific milestones that underpin that claim are worth treating as a checklist rather than a blanket reassurance.
- Full-year cost reduction target: 5% year-on-year (reaffirmed; guidance unchanged)
- Suncorp Bank integration: targeted at 57% completion by end of FY26
- ANZ single customer front-end platform: targeted at 45% completion by end of FY26
Nuno Matos confirmed the bank remains on course for full-year targets, with the Q3 cost decline and margin improvement providing the data points that make those targets look achievable rather than aspirational.
Q3 saw the home lending book move back into system growth, business banking volumes build further, and the new leadership team advance what management has described as a cultural reset programme across the organisation. These are positive signals.
The risk side of the ledger is not empty. The bank is working through a series of deliverables under its Root Cause Remediation Plan, focused on strengthening non-financial risk management. This is the kind of regulatory remediation programme that can absorb management attention and generate unexpected costs, and investors should keep it in view alongside the positive operational narrative.
This article is for informational purposes only and should not be considered financial advice. Investors should conduct their own research and consult with financial professionals before making investment decisions. Past performance does not guarantee future results.
What the correction changes, and what it does not
The Q3 result has genuinely resolved several questions. Margin direction is positive. Cost discipline, excluding the legal provision, is real. Capital strength is improving alongside loan book growth.
What Q3 resolved:
- NIM is expanding on the core book (4 basis points ex-markets)
- Underlying costs are falling (3% decline excluding the NZD$125 million provision)
- CET1 is rising while the balance sheet grows (12.51%, up 57 basis points year-on-year)
What remains open:
- Full-year cost outcome against the 5% reduction target
- Suncorp integration execution toward 57% completion
- New Zealand class action appeal outcome (NZD$125 million provision already booked)
- Cash RoTE of 11.54% as the figure that will anchor full-year assessment
The 12-month appreciation of 19.1% tells you there is already meaningful optimism priced into ANZ at these levels. The 4.3% session gain on 13 August 2026 was the market acknowledging that the Q3 data supports the optimistic scenario. It did not eliminate the risks entirely. For a retail investor weighing whether to add, hold, or trim at current levels, the Q3 result shifts the probability distribution toward the positive outcome without closing the remaining gaps. The specific variables above are the ones to monitor between now and the full-year result.
For investors weighing whether ANZ’s 19.1% twelve-month gain reflects durable re-rating or stretched sentiment, our full explainer on Big Four rally positioning examines the analyst consensus data and price-to-earnings comparisons that frame whether current bank valuations have room to run.