Why Imugene’s Fast Track Win in Marginal Zone Lymphoma Matters
25 mins ago
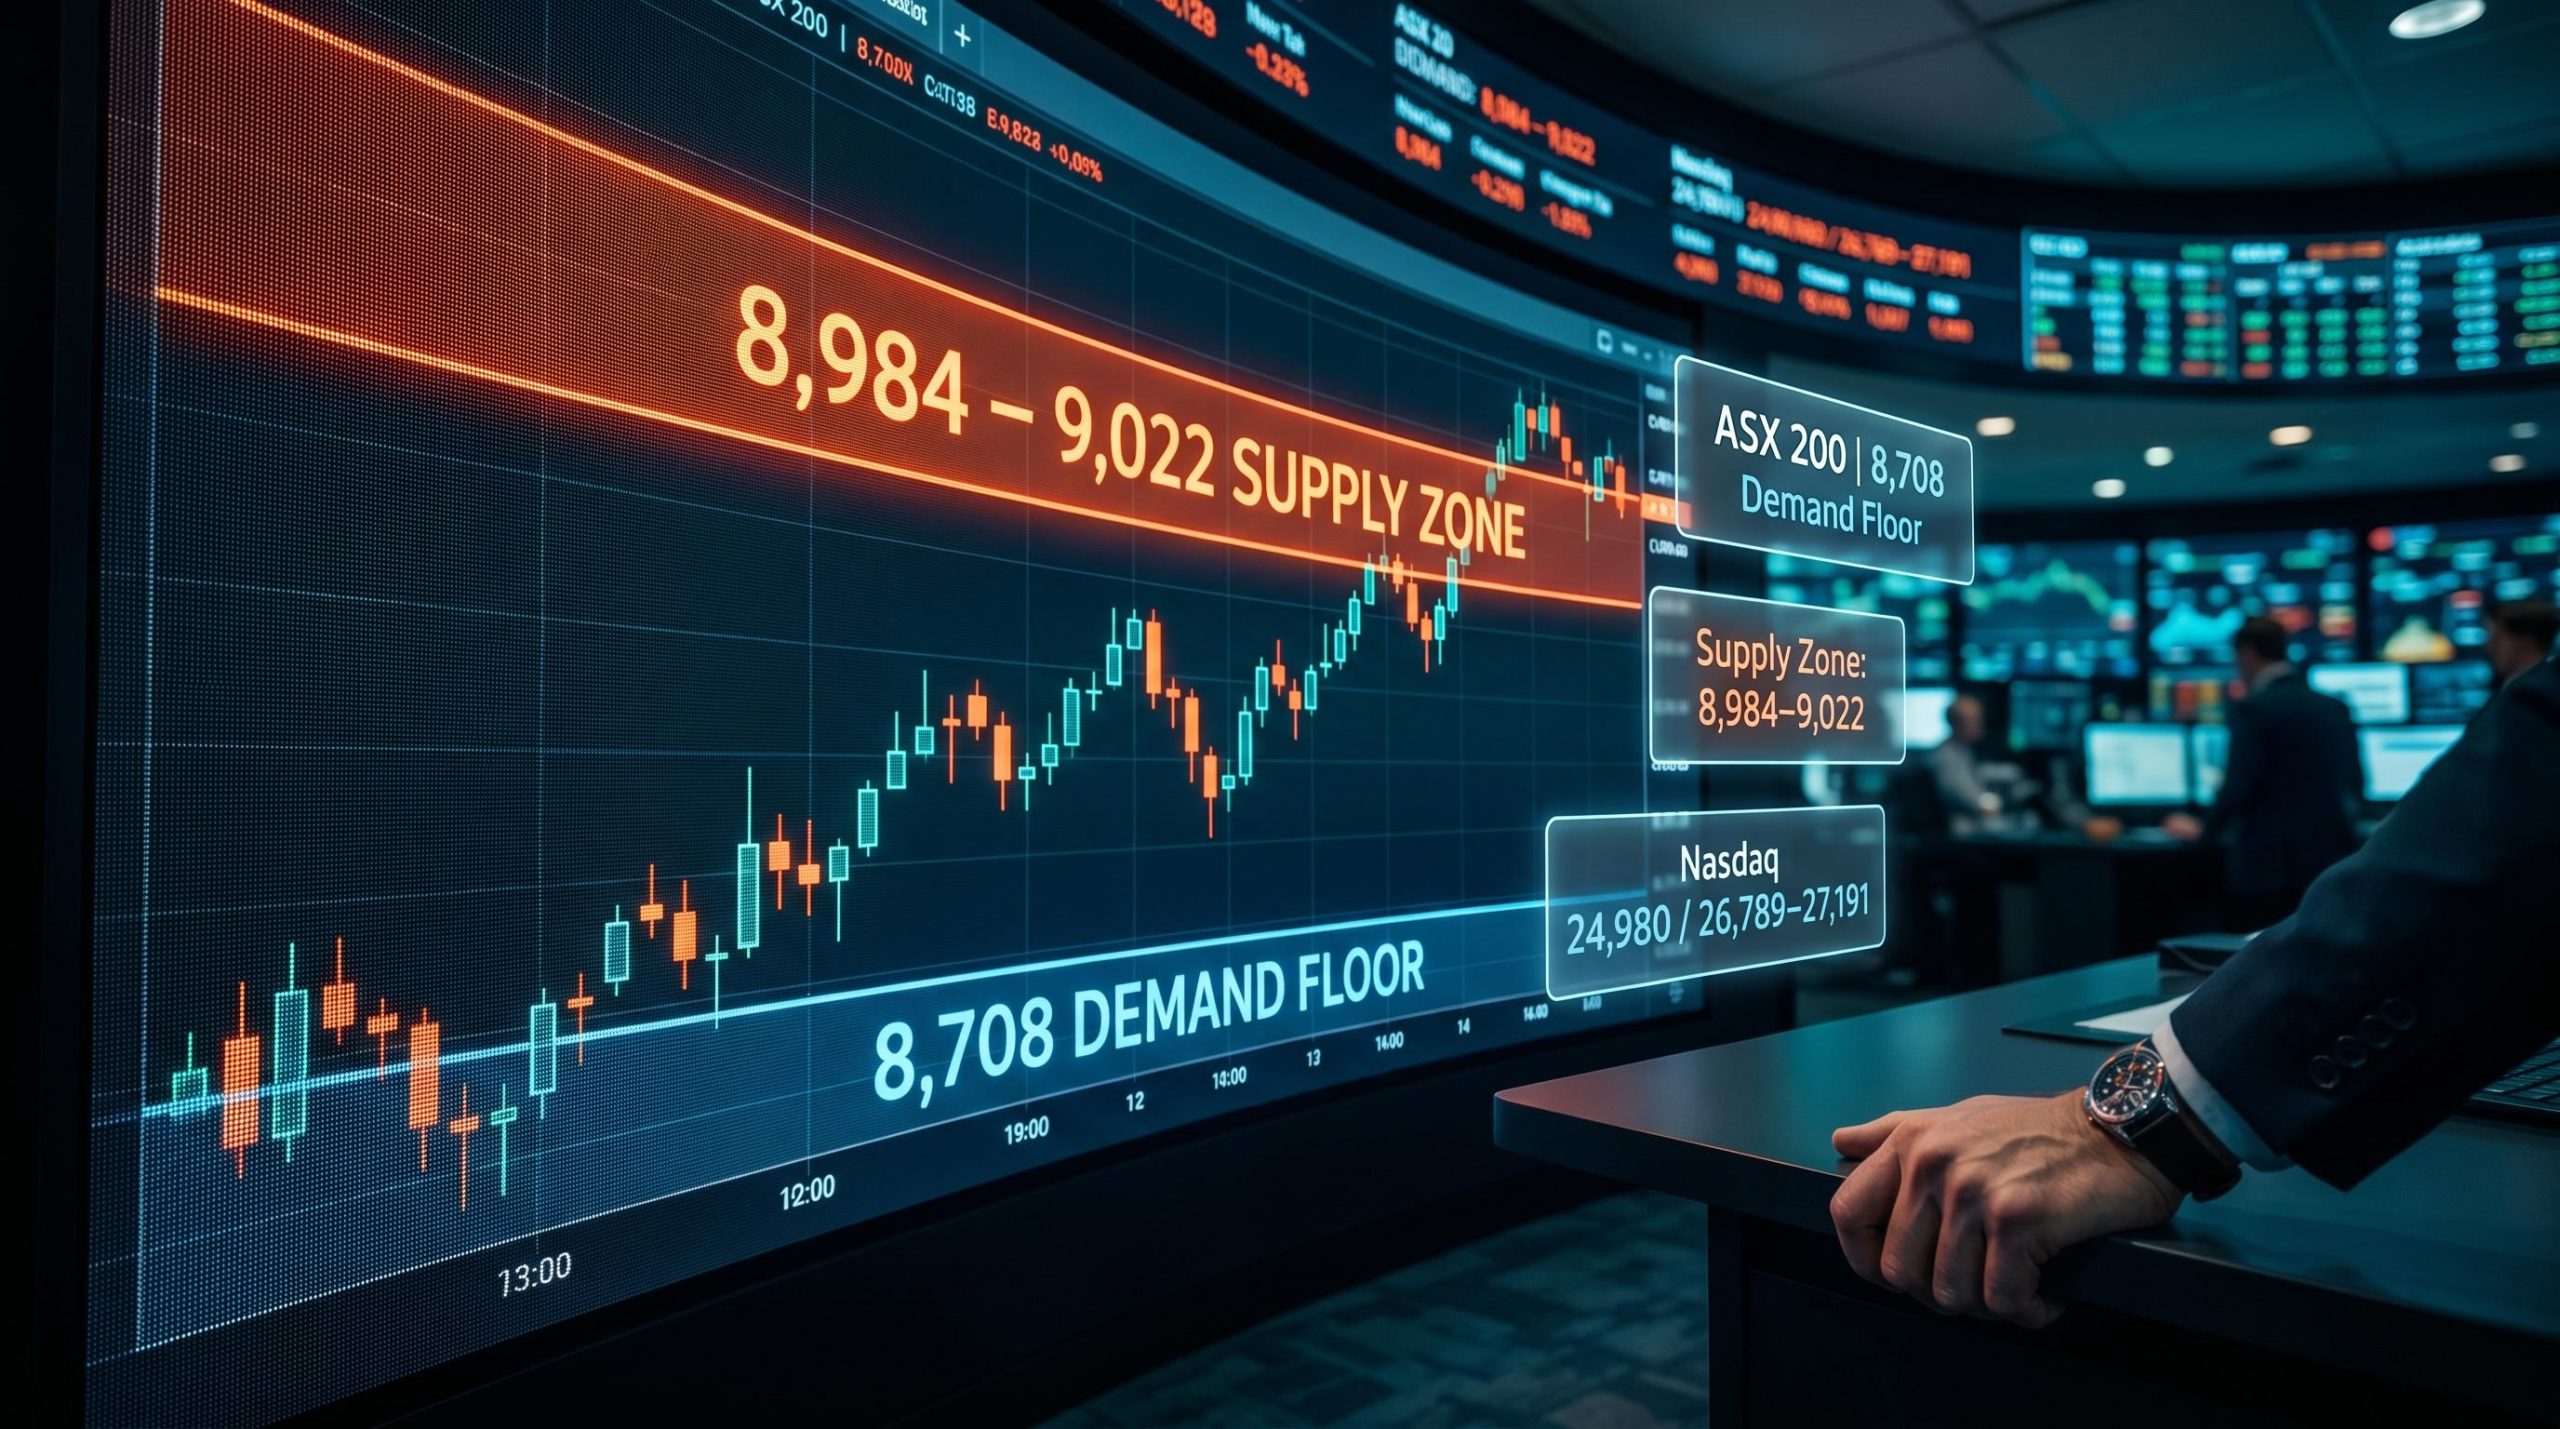
The ASX 200 is testing the 8,984 to 9,022 supply zone from below, a band where sellers have consistently materialised, while the 8,708 trough established on Friday now functions as the critical floor distinguishing a continuing uptrend from a failed rally. A supply zone that holds and a floor that breaks would redefine the advance from 8,485 as a corrective bounce rather than the opening stage of a new primary move.
This is a decision week for both Australian and US equities. The Nasdaq Composite faces its own fork between distribution and accumulation, and the resolution there will ripple directly into ASX risk appetite. Three macro catalysts land between Tuesday and Thursday: China PMIs, US non-farm payrolls, and RBA June meeting minutes, each capable of forcing the technical levels that both indices are sitting on.
Here is what the chart structure is telling you now, what the data calendar could trigger, and where the clearest signals will come from if you are sizing risk heading into the new financial year. This is a practitioner-grade watch list, not a summary.
The constructive case starts with Friday’s session. The 29 June session confirmed a higher trough at 8,708, extending the sequence of higher highs and higher lows that has been building since the 8,485 origin. That sequence is the structural backbone of the current rally, and it remains intact.
The ASX 200 vs Nasdaq divergence that defined the first half of 2026 produced a structurally important backdrop for this week’s setup: the ASX spent roughly twelve months trapped between the 8,686-8,750 supply zone and the 8,262-8,379 demand zone while the Nasdaq trended cleanly higher, meaning the current rally from 8,485 represents the ASX’s first genuine attempt to escape that range.
The long-term uptrend ribbon currently spans 8,697 to 8,747, a range that overlaps directly with the 8,708 trough. When price structure and trend dynamics point to the same level simultaneously, that alignment carries weight: the ribbon provides dynamic support at precisely the point where buyers have already demonstrated willingness to step in, reinforcing the rally’s foundation for as long as that defence holds.
Then there is the wall overhead. The 8,984 to 9,022 zone is not a price target. It is an active supply zone, a band where sellers have repeatedly entered the market and stalled prior advances. The previous rally leg from 8,561 to 8,984 covered approximately 423 points across six sessions between 9 June and 18 June 2026, a high-momentum push. The question now is whether the current leg can recreate that momentum into the same zone where it stalled before.
Three levels define the setup:
Decisive close above 9,022 = add risk. Sustained close below 8,708 = reduce risk.
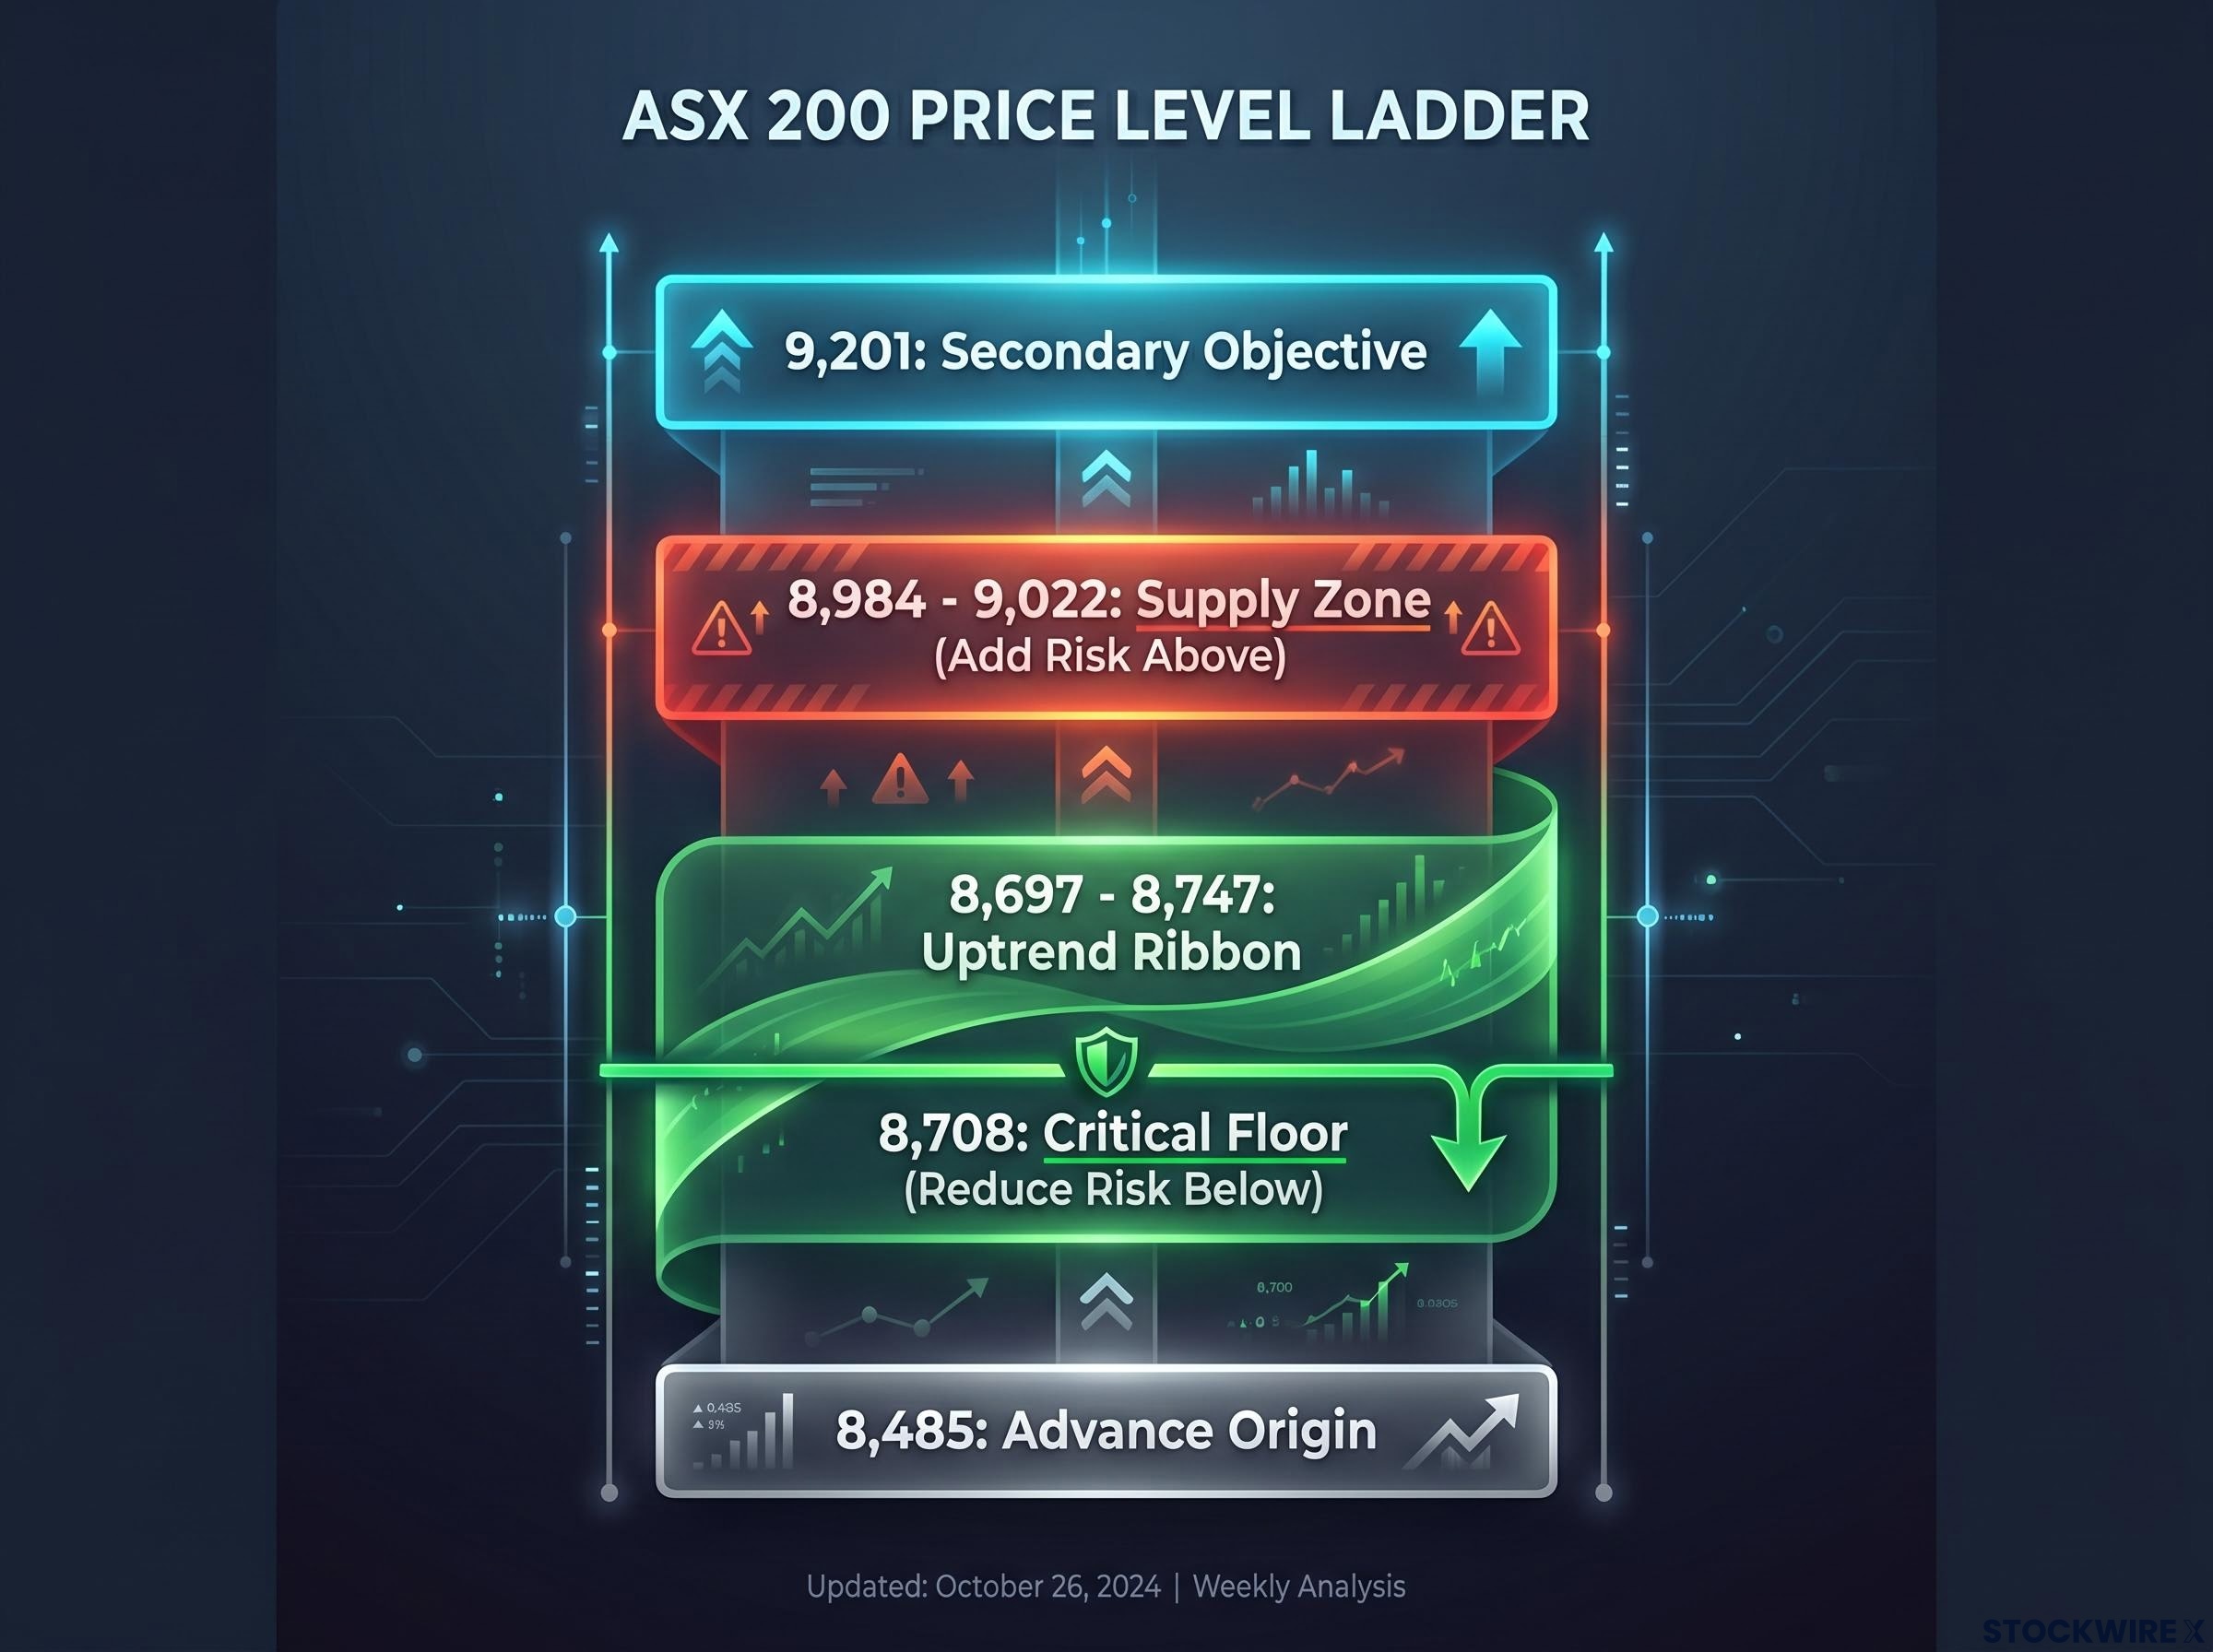
The confluence of the uptrend ribbon with the 8,708 level tells you this is a structurally supported rally. But the supply zone above means you are not yet looking at a breakout. You are watching a test.
9,201 is a second-stage objective, not a near-term call. Projecting to that level before the 8,984 to 9,022 zone has been convincingly cleared is poor technical discipline, the equivalent of celebrating a goal before the ball crosses the line. Until the supply zone breaks on a closing basis, 9,201 remains conditional.
Numbers on a chart are meaningless without understanding the crowd behaviour behind them. Supply zones form where significant selling volume previously entered the market. Sellers who bought higher are sitting on losses, and they are waiting for price to return so they can exit at break-even. That overhang of motivated sellers creates persistent resistance; every rally into that band runs into people looking to get out.
Demand zones work in reverse. They form where buyers previously stepped in at scale, creating a floor of motivated participants who will defend that level again. When price returns to a demand zone, those same buyers, or new ones drawn to the same value proposition, provide support.
| Characteristic | Supply Zone | Demand Zone |
|---|---|---|
| Formation mechanism | Heavy selling volume traps sellers who become motivated to exit at break-even | Heavy buying volume creates a floor of motivated buyers willing to defend the level |
| Typical price behaviour on first test | Rallies stall or reverse as trapped sellers unload positions | Declines slow or bounce as buyers re-enter at proven value |
| What confirms a genuine break | Closing price above the zone on elevated volume; trapped sellers absorbed | Closing price below the zone on elevated volume; buyer defence exhausted |
Once you understand that supply zones are full of trapped sellers looking to get out, the 8,984 to 9,022 level stops being a price target and becomes a crowd behaviour problem the bulls need to solve.
The ASX 200 breadth split from late May 2026, when 13 new highs against 27 new lows accompanied an index sitting 6-8% below its all-time high, illustrates the same structural tension visible in the current setup: headline index levels routinely mask constituent-level damage that only becomes apparent when supply zones cap the aggregate advance.
The confirmation standard is the closing price, not the intraday high or low. Markets routinely breach a level during a session only to reverse by the close. Those intraday wicks are noise. A genuine break requires a closing price above (or below) the zone, supported by elevated volume that indicates institutional conviction behind the move.
Friday’s Nasdaq candle illustrates why volume context matters: exceptionally heavy volume with an upper shadow showed institutions participating at scale, but the late-session selling meant the close alone could not confirm direction. Volume without directional confirmation is ambiguity, not signal.
According to technical analysis from Carl Capolingua, Lead Writer and Presenter at Market Index ChartWatch, the Nasdaq Composite has reached a juncture where the directional break will likely set the tone for global risk appetite across the following six months. The short-term trend ribbon spanning 25,794 to 25,922 is functioning as a zone of dynamic overhead supply. The principal demand reference sits at 24,980, while the 26,789 to 27,191 supply band marks the threshold a genuine breakout would need to clear.
Two scenarios carry equal weight right now:
The 27 June session closed fractionally above its midpoint, giving the candle a slight demand-side tilt, though the upper shadow points to sellers re-entering as the day progressed. Trading volume was notably heavy, consistent with large-scale stock changing hands between participants. On balance, the session resolved neither bullish nor bearish; it introduced uncertainty rather than direction.
| Scenario | Trigger level | ASX consequence |
|---|---|---|
| Demand absorbs supply (risk-on) | Nasdaq closes above 26,789-27,191 | Validates global risk appetite; strengthens case for ASX to break above 8,984-9,022 |
| Supply overwhelms demand (risk-off) | Nasdaq loses 24,980 | Signals deteriorating global risk appetite; pressures ASX toward 8,708 test |
That ambiguity is exactly why the analyst’s 50% risk allocation to US equities mirrors the ASX stance. Until the levels resolve, half-weight is the intellectually honest position.
The week builds from lower-impact releases to the single most important data point of the period: US non-farm payrolls on Thursday 3 July.
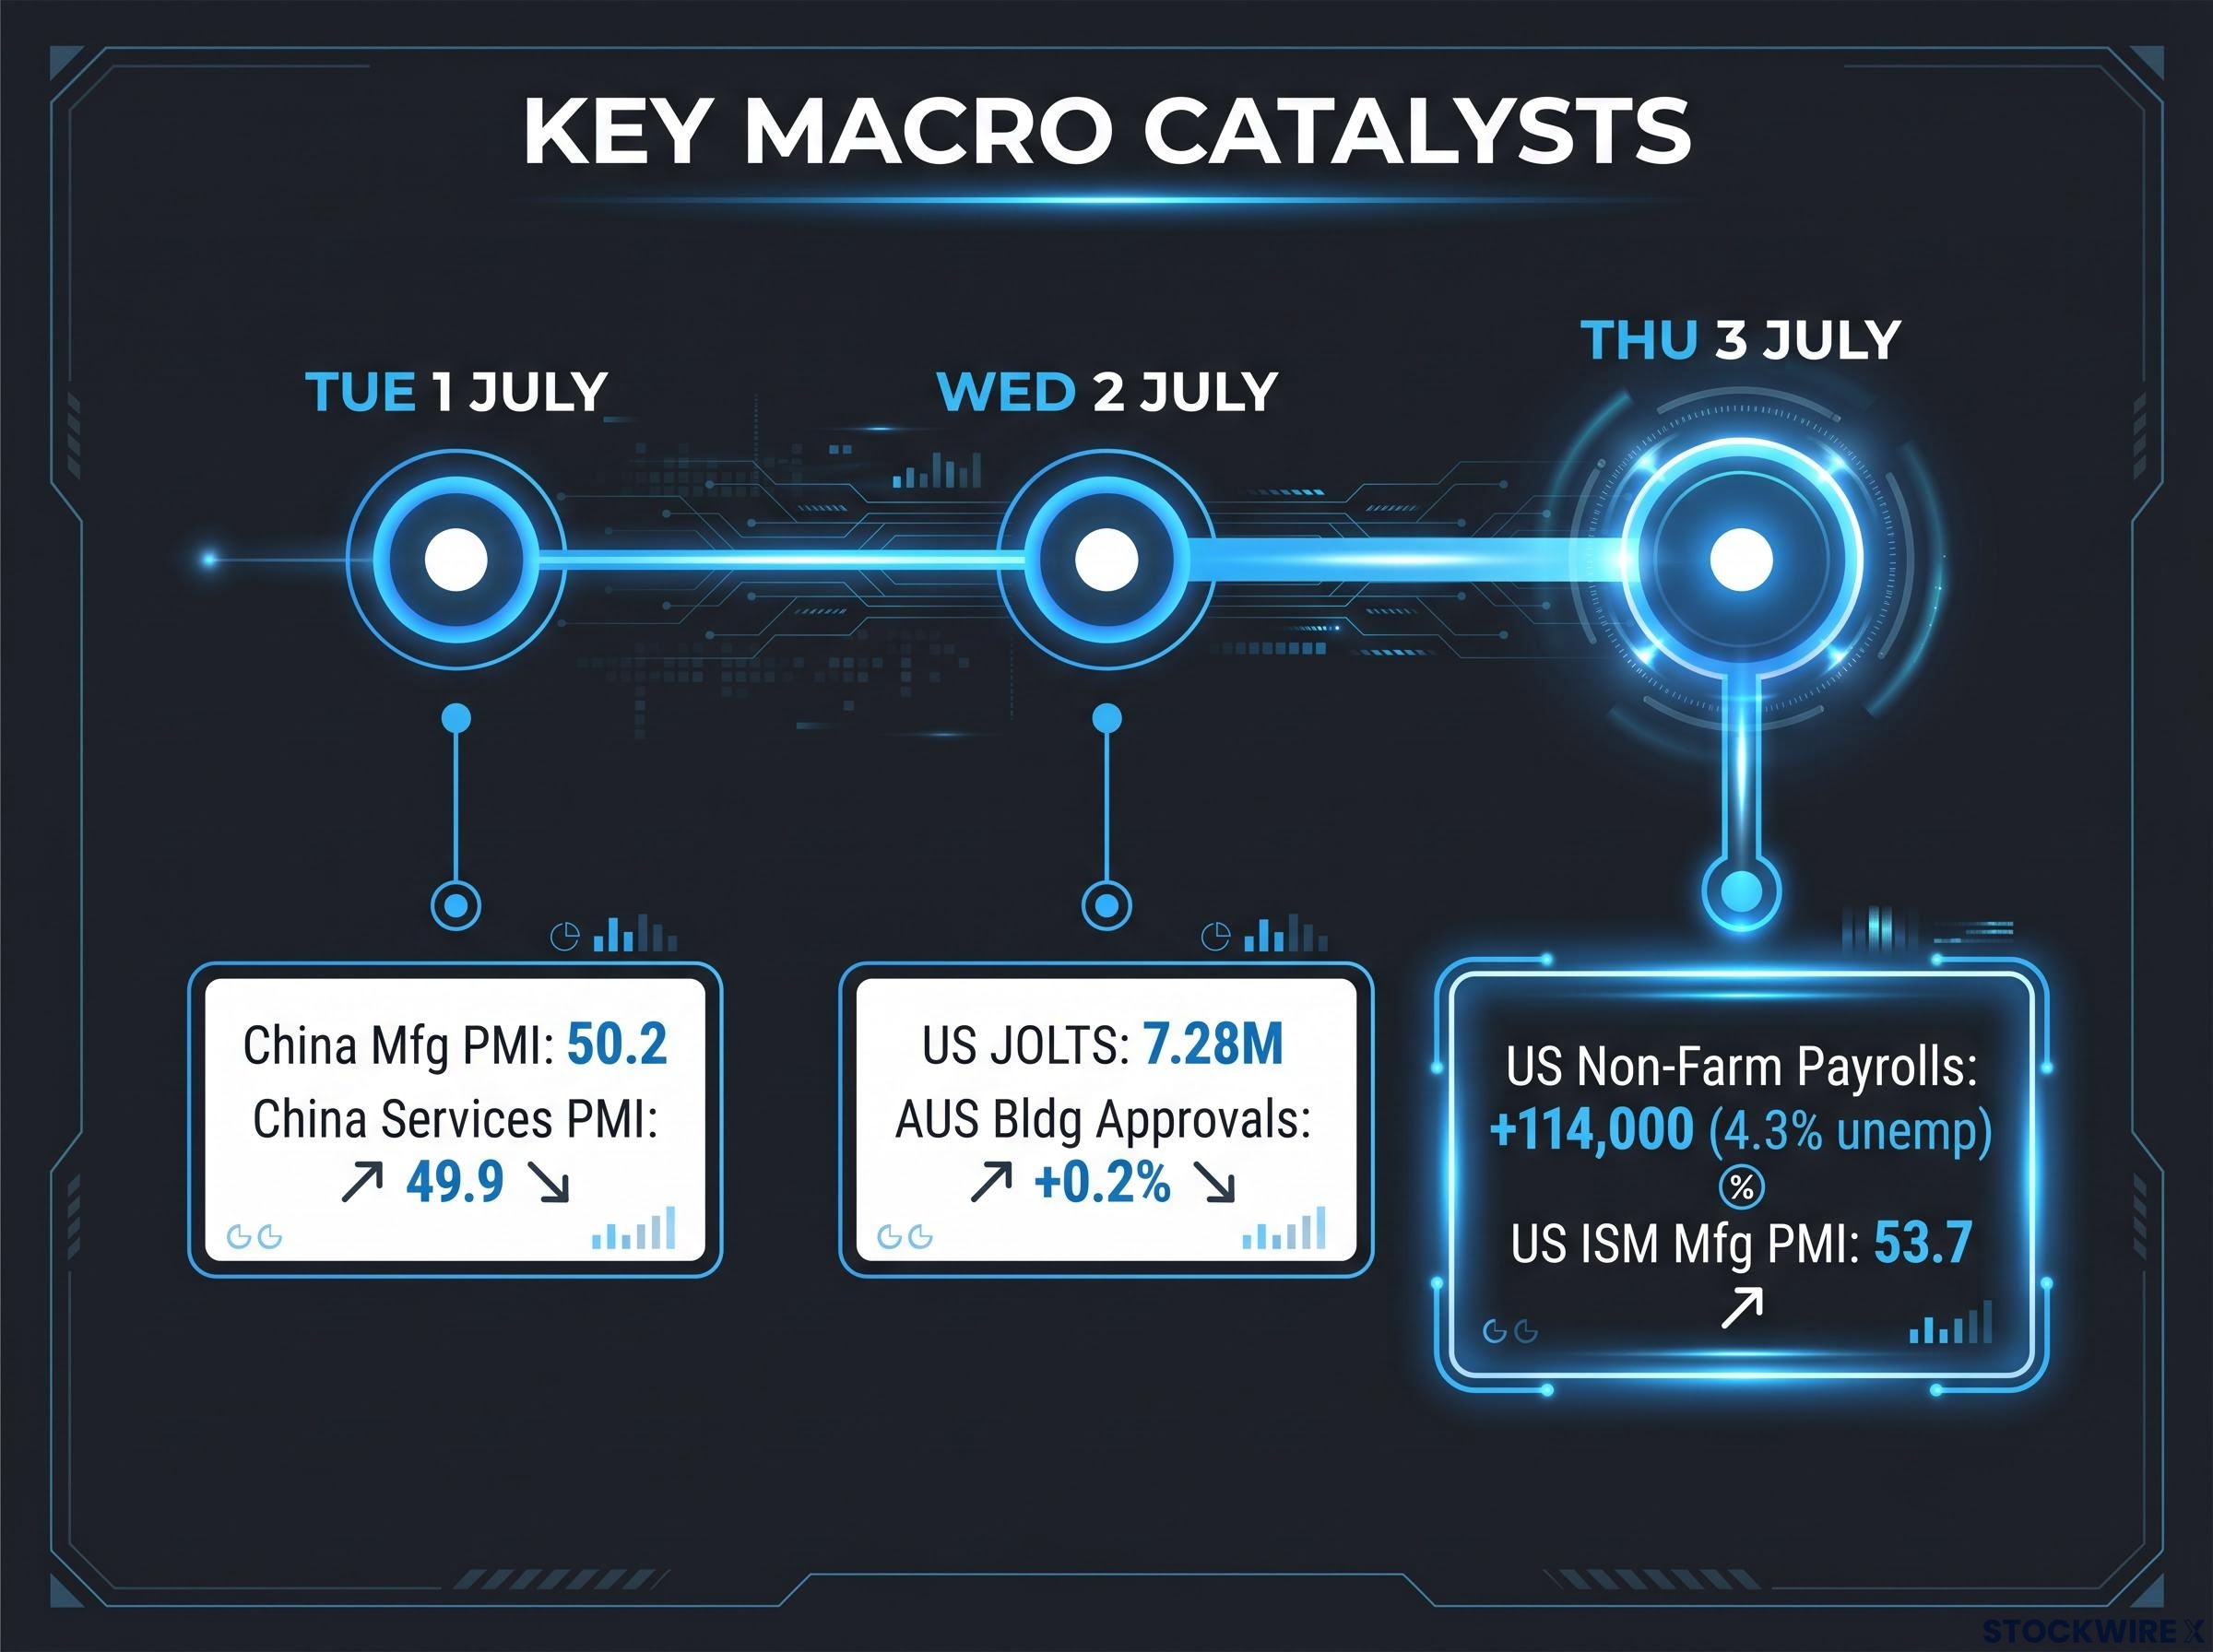
Tuesday 1 July opens the calendar with China’s June Manufacturing PMI (forecast 50.2, prior 50.0) and Services PMI (forecast 49.9, prior 50.1). Manufacturing strength above 50 is directly supportive for iron ore demand and ASX materials stocks. The services forecast sitting just below the 50-point contraction threshold, the line that separates expansion from contraction, is a subtle warning for cyclical sentiment.
Wednesday 2 July brings US Conference Board Consumer Confidence (forecast 94.2, prior 93.1), JOLTS job openings (forecast 7.28 million, prior 7.62 million), and Australia May Building Approvals (forecast +0.2%, prior -3.4%). The RBA June meeting minutes also land this week, providing context for rate path expectations. Stabilising building approvals after April’s sharp decline would support the RBA’s cautious stance.
The RBA cash rate target, held at 4.35% through the June 2026 meeting, is the direct policy anchor the June minutes will elaborate on, and any language shift around the inflation or labour market outlook could reprice rate expectations in ways that feed directly into the ASX’s rate-sensitive sectors.
| Release | Date | Forecast | Why it matters for markets |
|---|---|---|---|
| China Manufacturing PMI | Tue 1 July | 50.2 | Direct read on iron ore demand; sets ASX materials tone |
| China Services PMI | Tue 1 July | 49.9 | Below 50 flags domestic contraction; drags cyclical sentiment |
| US JOLTS Job Openings | Wed 2 July | 7.28M | Measures labour market cooling pace; context for payrolls |
| US Non-Farm Payrolls | Thu 3 July | +114,000 | Week’s single most important catalyst for all key technical levels |
| US ISM Manufacturing PMI | Thu 3 July | 53.7 | Growth vs inflation read; prices component easing modestly disinflationary |
| Australia Building Approvals | Wed 2 July | +0.2% | Stabilisation supports cautious RBA stance after April’s -3.4% |
Fed Chair Kevin Warsh is also scheduled to deliver remarks during the week, a potential source of forward guidance that could amplify or offset the payrolls reaction. And on Friday 4 July, US markets close for Independence Day, meaning Thursday’s data will be the last word before a long weekend of digestion.
May payrolls printed at +172,000. The June consensus sits at approximately +114,000, with unemployment steady at 4.3% and average hourly earnings at +0.3% month-on-month. Three outcomes matter:
A payrolls print around 114,000 with contained unemployment and wages gives the Fed the Goldilocks read it needs for gradual easing. That is the scenario most likely to give ASX bulls the risk-on wind required to push through 8,984 to 9,022.
A large downside miss raises recession fears, activates the supply-overwhelms-demand scenario on the Nasdaq, and tests 8,708 on the ASX and 24,980 on the Nasdaq. A strong upside surprise is not automatically bullish either; it reignites hawkish Fed repricing, pressuring rate-sensitive growth stocks and long-duration names on the Nasdaq. Both tails are negative for equities, which is why the Goldilocks middle path carries disproportionate weight.
The asymmetric risk profile around Thursday’s number is explored in depth in the June NFP preview, which documents how the Warsh Fed’s removal of forward guidance has transferred the full interpretive burden onto the payrolls print itself, making sector composition and internals more market-moving than they have been in years.
The analyst’s risk allocation, approximately 50% of maximum permitted level across both Australian and US equities, is not caution for its own sake. It is a calibrated response to a specific setup: long-term uptrends intact on both indices, but short-term equilibrium with genuine downside scenarios on both sides.
Two clear decision points will likely be forced by this week’s data:
This decision point lands exactly at the start of the 2026/27 financial year for Australian investors. Starting the new year at half-weight risk with clear triggers on both sides is not a passive stance; it is the most disciplined response available when the chart structure and the macro calendar are simultaneously demanding resolution.
The framework is not a prediction of which direction wins. It is a pre-mapped response that lets you act on the signal rather than scramble after consensus forms.
A bullish resolution looks like this: the ASX closes decisively above 9,022 on volume, the Nasdaq clears 26,789 to 27,191, payrolls deliver a Goldilocks print, and the path to ASX 9,201 opens. Both indices resume their longer-term uptrends with buyers confirmed as the dominant force.
A bearish resolution looks like this: the Nasdaq loses 24,980, the ASX retreats through 8,708, and the move from 8,485 is recast as a countertrend rally rather than a new primary leg. The long-term uptrend ribbon fails, and the structural read shifts from “buyers in control” to “sellers reasserting.”
ASX 200 concentration risk amplifies the stakes of a supply zone failure at 8,984-9,022: with financials and materials accounting for more than 50% of the index by market-cap weight, a broad index retreat driven by commodity and bank sector pressure hits Australian portfolios harder than the headline percentage move suggests.
The analyst has characterised the Nasdaq’s directional break as shaping the subsequent six-month trajectory. That framing tells you this is not a routine data week. The resolution of these levels will shape what kind of market environment Australian investors are operating in through the end of 2026. The chart will not wait for certainty. Investors who have pre-mapped their response will be better positioned than those who wait for consensus after the fact.
This article is for informational purposes only and should not be considered financial advice. Investors should conduct their own research and consult with financial professionals before making investment decisions. Past performance does not guarantee future results. Financial projections are subject to market conditions and various risk factors.
A supply zone is a price band where significant selling volume previously entered the market, creating an overhang of motivated sellers who are waiting to exit at break-even. On the ASX 200, the 8,984-9,022 band is the current dominant supply zone, where sellers have repeatedly capped prior advances.
A sustained closing break below 8,708 would signal the rally from 8,485 is a countertrend bounce rather than a new primary leg, as that level is both the current higher trough and sits within the long-term uptrend ribbon where dynamic support is concentrated.
A payrolls print near the 114,000 consensus with contained unemployment and wages would deliver the Goldilocks read most likely to give ASX bulls the risk-on conditions needed to push through the 8,984-9,022 supply zone, while a large miss or strong upside surprise both carry negative implications for equities.
The Nasdaq Composite is sitting at its own fork between distribution and accumulation, and its directional break is expected to shape global risk appetite for the following six months. A Nasdaq close above 26,789-27,191 strengthens the case for the ASX to break higher, while a loss of 24,980 pressures the ASX toward the 8,708 support test.
China's Manufacturing PMI is a direct read on iron ore demand, and a result above 50 is supportive for ASX materials stocks, which along with financials account for more than 50% of the index by market-cap weight. The Services PMI forecast of 49.9 sits just below the contraction threshold, introducing a subtle warning for broader cyclical sentiment.