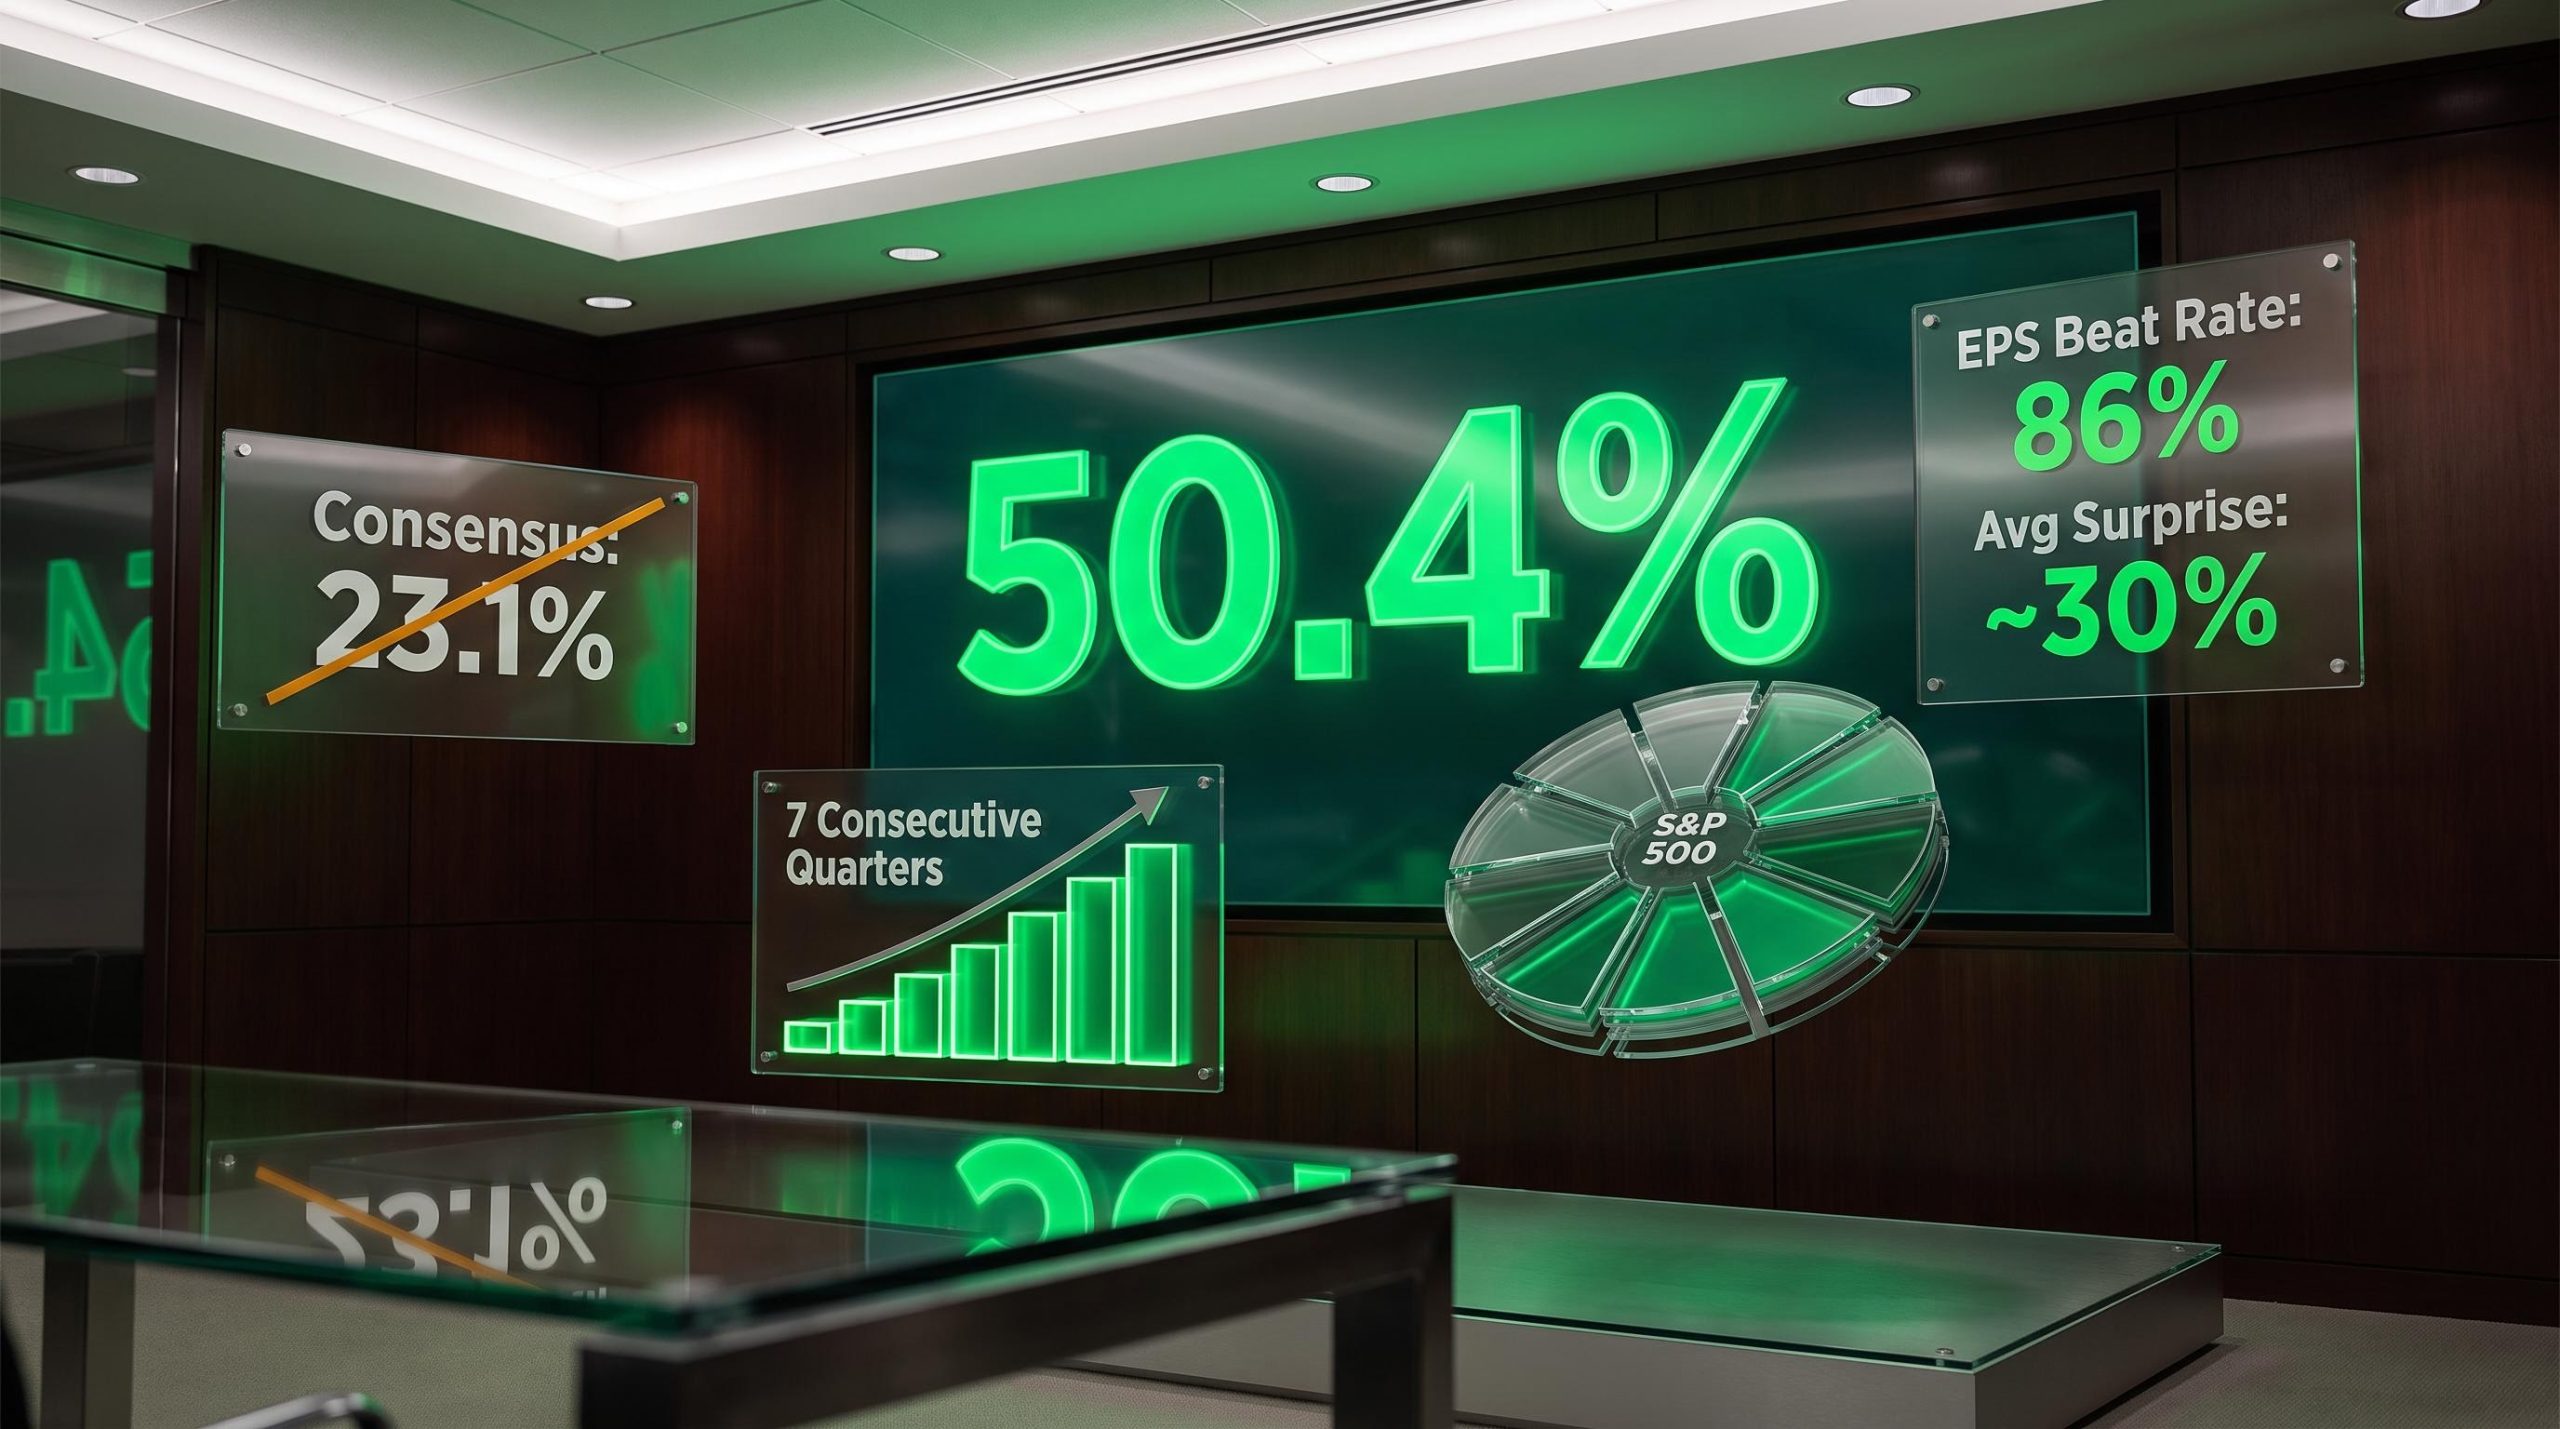
“Analysts projected 23.1% earnings growth for the S&P 500 heading into Q2 2026. The blended result, with roughly 88% of constituents having now reported, came in at approximately 50.4%. That is not a beat. That is a diagnostic failure in how the market’s best-resourced forecasting machinery read corporate profit momentum.\n\nThe quarter’s results are largely finalised as of mid-August 2026, which means this is not a partial sample subject to meaningful revision. Coverage of Q2 has leaned heavily on a single theme: AI investment by hyperscalers lifting a handful of mega-cap technology names. That angle captures part of what happened, but the broader dataset points to something more significant and harder to dismiss.\n\nThe data available right now gives you a cleaner picture of whether current equity valuations rest on genuine broad-based profitability or a narrower foundation than the AI headlines imply. Here is what the sector participation rates, the exclusion analyses, and the international evidence actually show.\n\n## What the headline numbers actually reveal\n\nThe scale of Q2 2026 is difficult to contextualise without placing it against the benchmarks that preceded it. At 50.4% blended earnings growth, the index is on track for its strongest year-over-year result since Q2 2021, when the post-pandemic rebound drove 91.6% growth from a deeply depressed base. The current quarter also extends the run to seven consecutive periods of double-digit growth, with two of those now clearing the 20% threshold.\n\n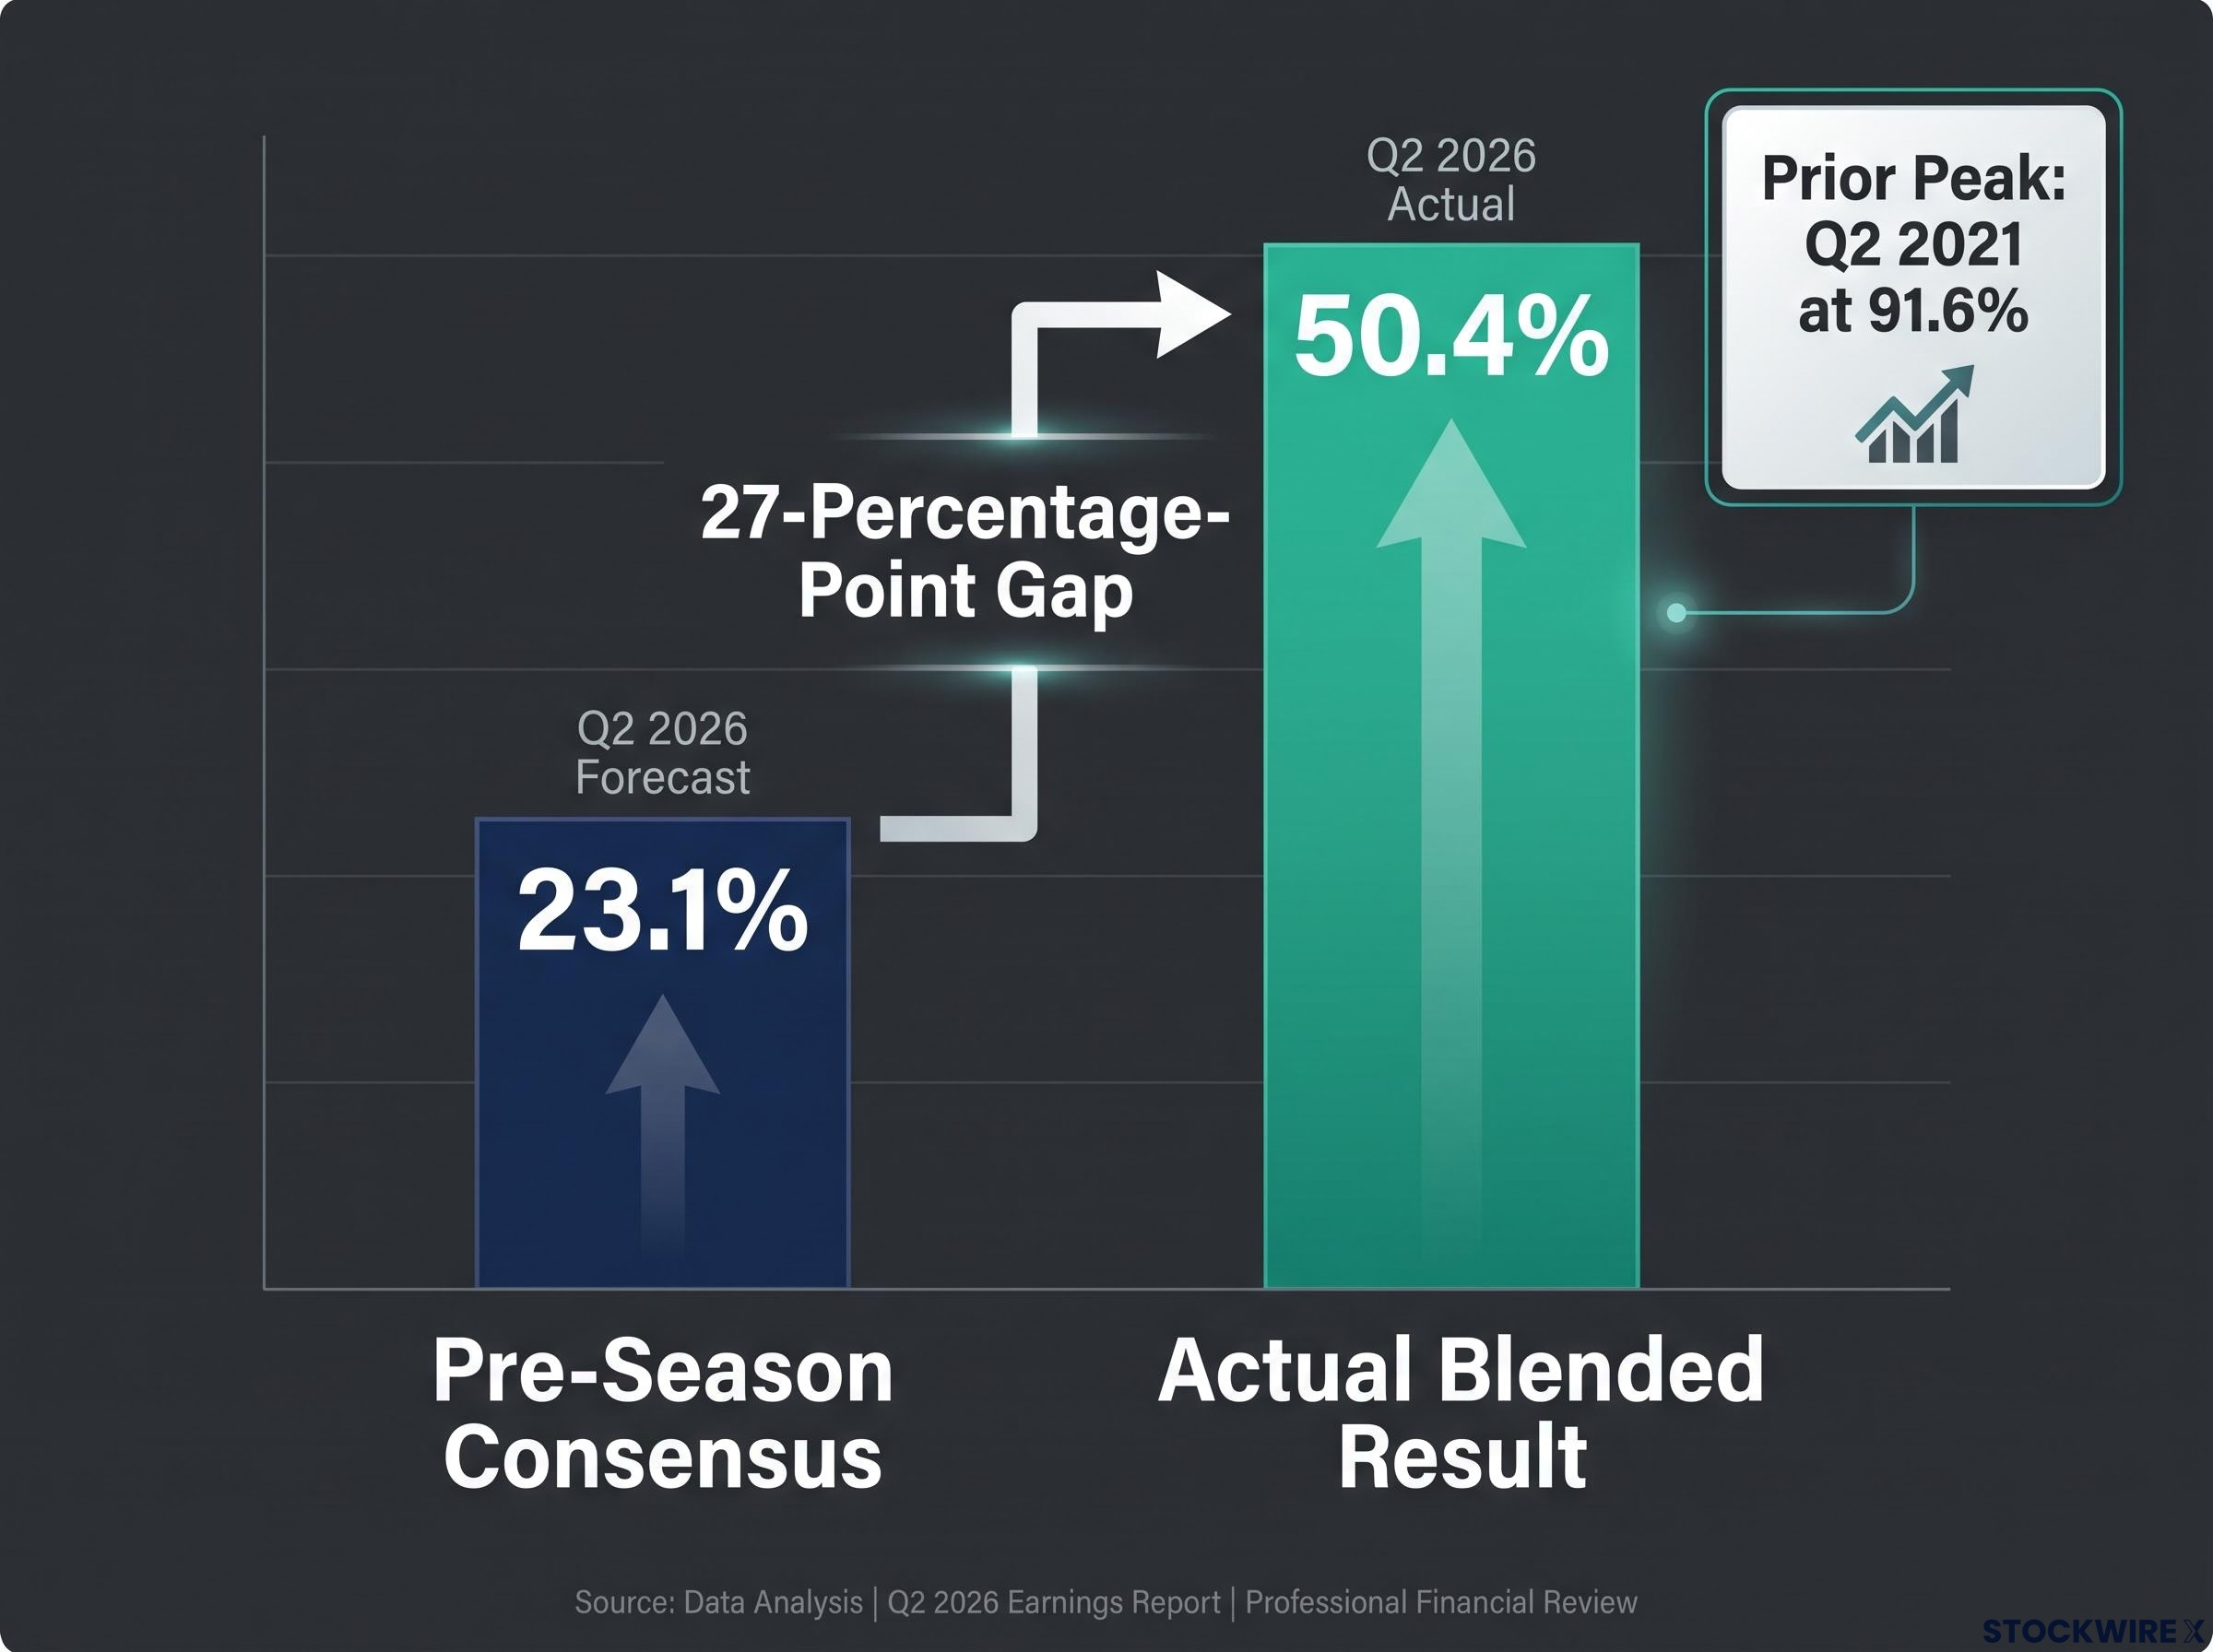 \n\nThe beat rates sharpen the picture. 86% of reporting companies delivered a positive earnings-per-share (EPS) surprise, which measures whether a company’s actual profit exceeded what analysts had forecast. Revenue beat rates came in at approximately 76-77%. The average EPS surprise magnitude was roughly 30% above consensus, against a long-term historical average of approximately 5%.\n\n
| Metric | Q2 2026 Value | Benchmark | Benchmark Value | Significance |
|---|---|---|---|---|
| Blended earnings growth | ~50.4% | Q2 2021 (prior peak) | 91.6% | Highest growth since pandemic recovery |
| Pre-season consensus | 23.1% | Actual blended result | ~50.4% | Actual roughly doubled projections |
| EPS beat rate | 86% | 5- and 10-year averages | Below 86% | Well above historical norms |
| Revenue beat rate | ~76-77% | Historical average | Lower | Top-line strength corroborates bottom-line |
| Average EPS surprise | ~30% above consensus | Long-term average surprise | ~5% | Six times the normal surprise magnitude |
| Consecutive double-digit growth quarters | 7th | Q1 2026 growth | ~27-29% | 2nd consecutive quarter above 20% |
\n
\n\n> A 27-percentage-point gap between consensus and actual earnings at the index level is not a rounding problem. It tells you that analyst models systematically underestimated corporate profit power this quarter, and collective errors at this scale typically precede reassessment of the broader earnings trajectory, not just individual company estimates.\n\n## Sector participation rates tell a different story than the AI headlines\n\nAn 86% beat rate across an index of 500 companies is, by definition, a breadth indicator. One or two outsized results cannot mechanically produce that aggregate figure. If Alphabet and Amazon together drove the entire surprise, the remaining 498 companies would still need to have largely met or exceeded expectations to produce a beat rate of that magnitude. The arithmetic itself constrains how concentrated the story can be.\n\nBarclays corroborates this structural reading: approximately 85% of companies beat consensus expectations, with an average EPS surprise of approximately 30%, per their Q2 earnings commentary.\n\nThe sector data makes the breadth visible. 10 of 11 S&P 500 sectors reported positive year-over-year earnings growth. Sector-level data from FactSet and Fisher Investments analysis shows that 8 of 11 sectors posted double-digit growth for the quarter.\n\nTechnology-linked sectors with strong results:\n\n- Information Technology\n- Communication Services\n\nCyclical sectors with strong results:\n\n- Industrials\n- Financials\n- Energy\n- Materials\n- Consumer Staples\n\nHealth Care was among the weaker performers, which is actually useful information: it confirms that the headline number is not artificially inflated by uniformly strong results everywhere.\n\nThe participation of cyclical sectors matters more than the technology results for evaluating whether this is a genuine economic story. Industrials, Financials, Energy, and Materials earn their profits from real economic activity, not from AI capital expenditure flows. When those sectors are posting double-digit growth alongside technology, the earnings cycle has roots that extend well beyond a single theme.\n\n## Earnings growth after removing the largest AI-linked companies\n\nThe most direct way to test whether the earnings story collapses without AI-adjacent mega-caps is to remove them and see what remains. FactSet documented three exclusion scenarios in its S&P 500 Earnings Season Update from 24 July 2026, and each functions as a progressively stricter stress test.\n\n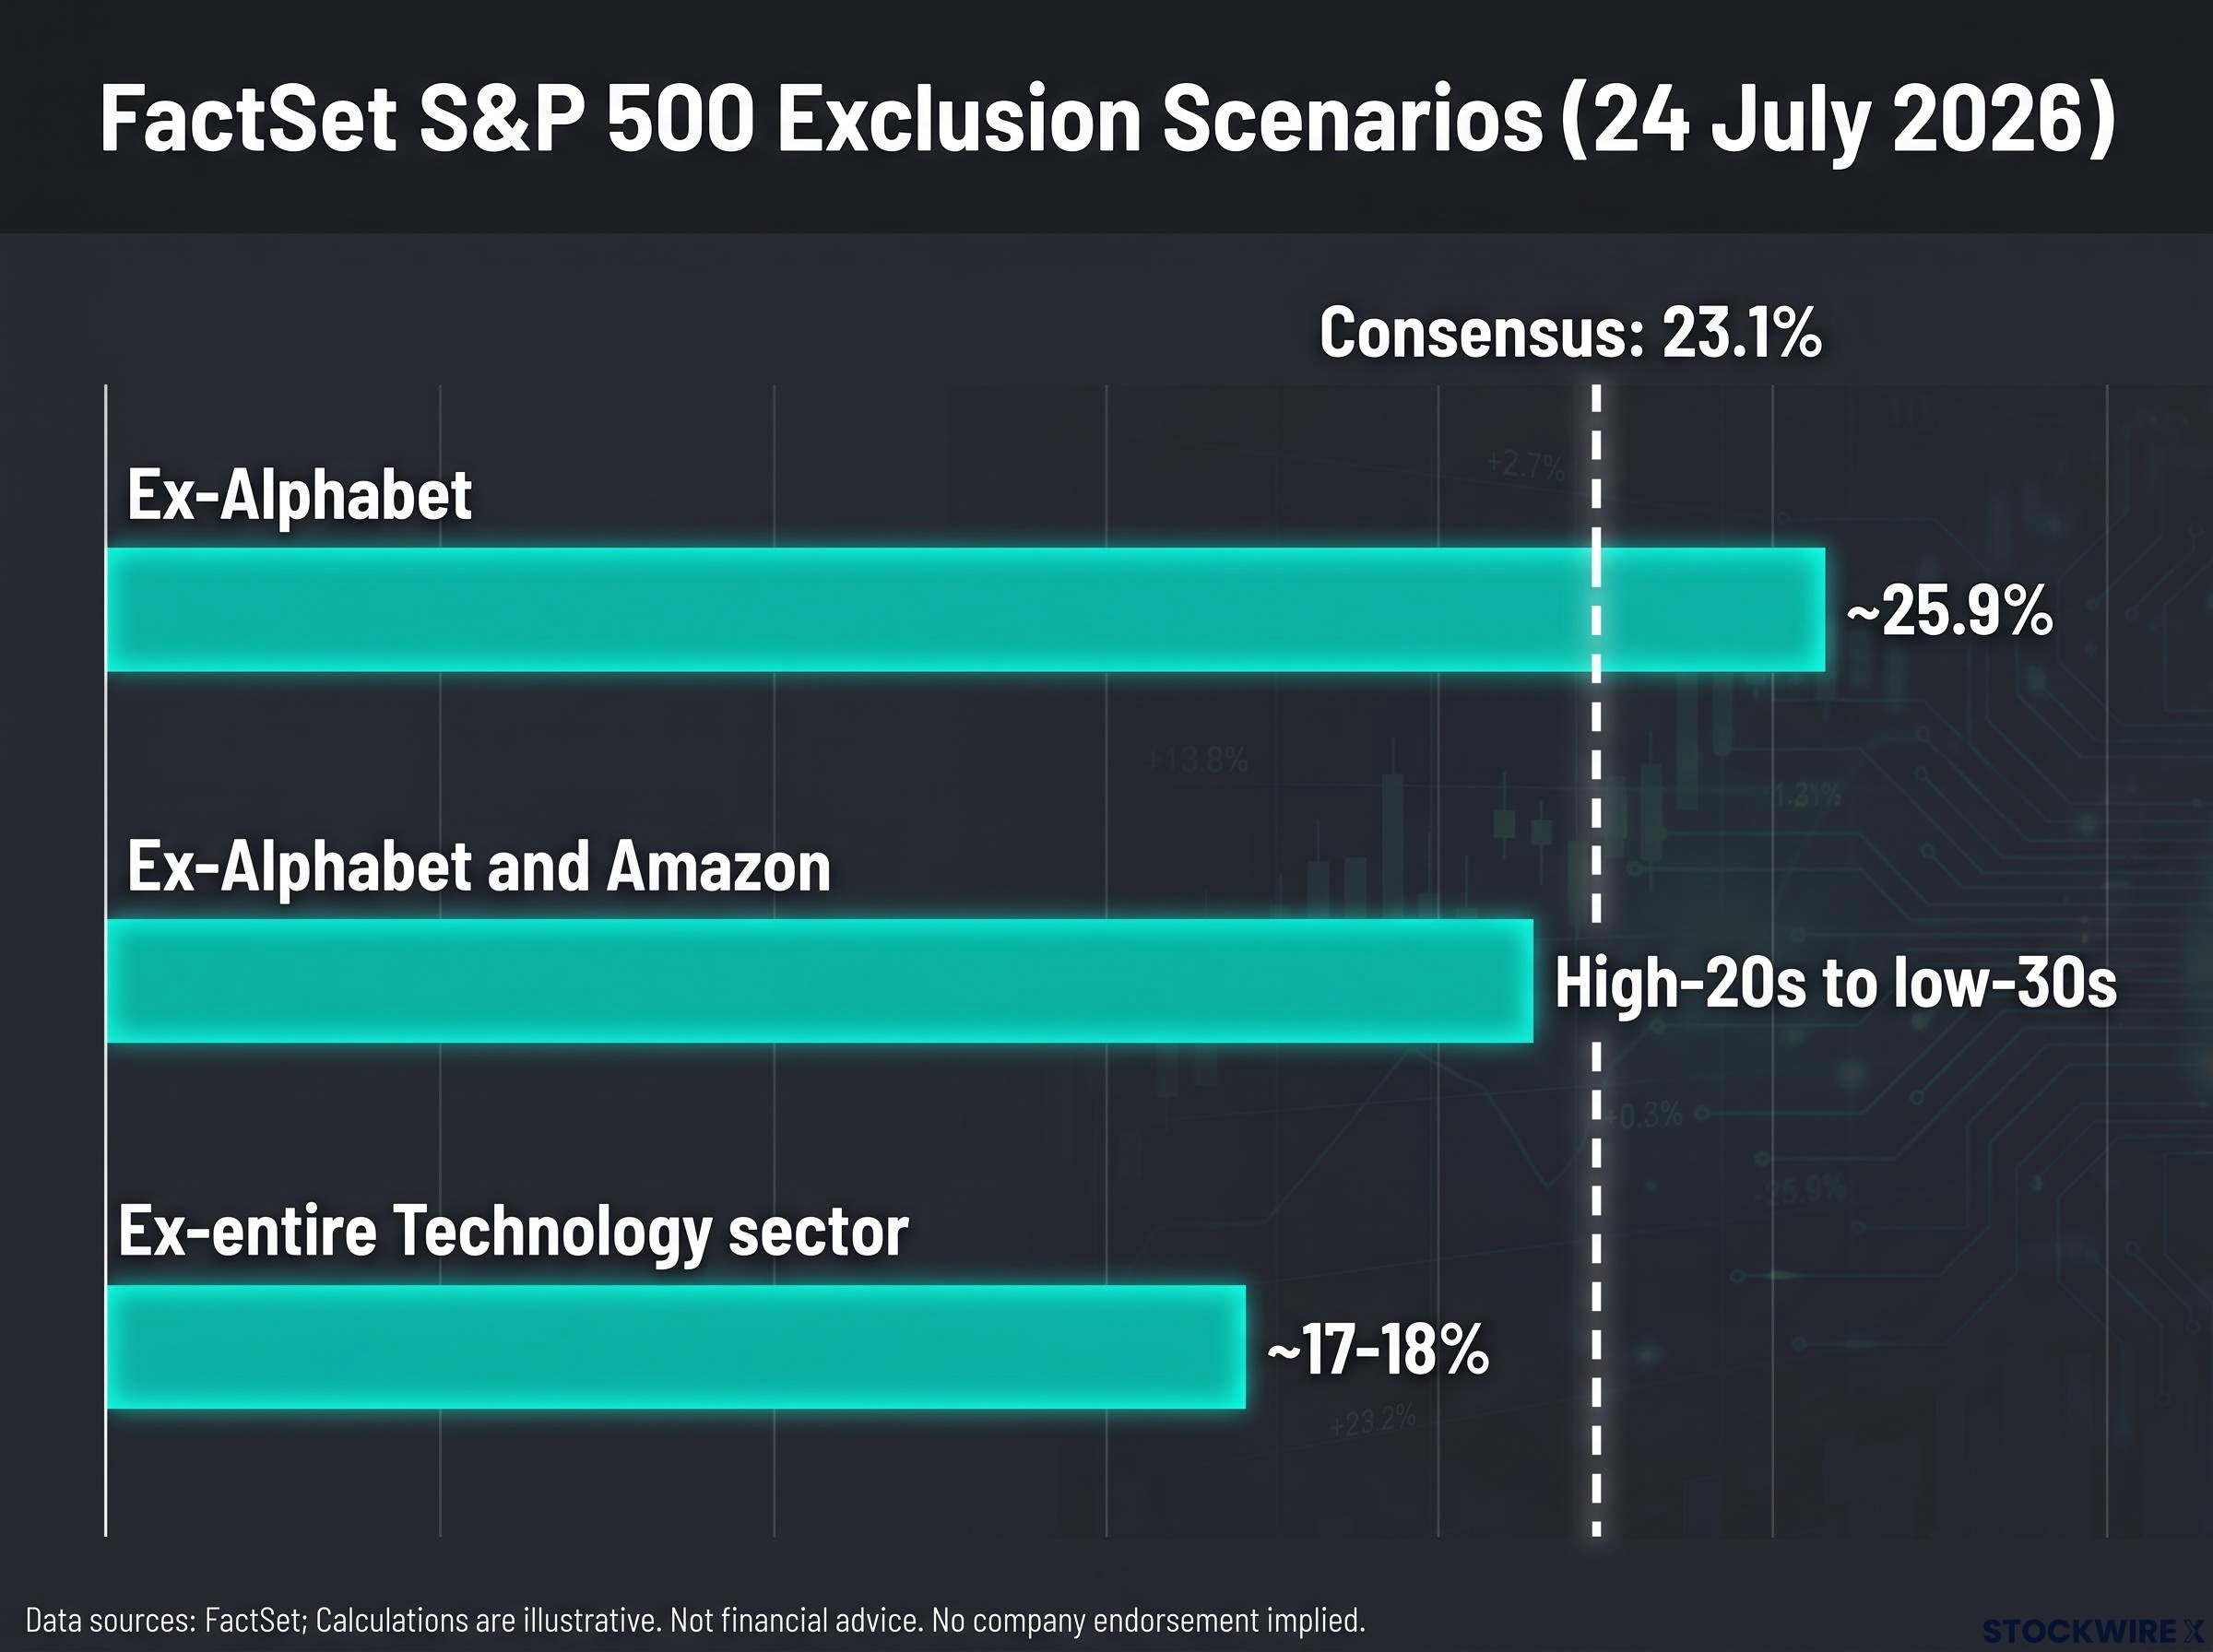 \n\n
\n\n
| Exclusion Applied | Resulting Blended Growth | vs. Pre-Season Consensus (23.1%) | Interpretation |
|---|---|---|---|
| Ex-Alphabet | ~25.9% (from ~37.9%) | Still above consensus | Second consecutive quarter above 20% |
| Ex-Alphabet and Amazon | High-20s to low-30s | Still above consensus | Well above what analysts projected for the full index |
| Ex-entire Technology sector | ~17-18% | Below consensus | High-teens growth with double-digit revenue growth across the remainder |
\n
\n\nWatch what happens as each layer is removed. Strip out Alphabet, and the index still grows above 25%. Strip out both Alphabet and Amazon, and growth remains in the high-20s to low-30s range. Even removing the entire Technology sector leaves the rest of the S&P 500 delivering approximately 17-18% earnings growth with double-digit revenue growth underneath it.\n\n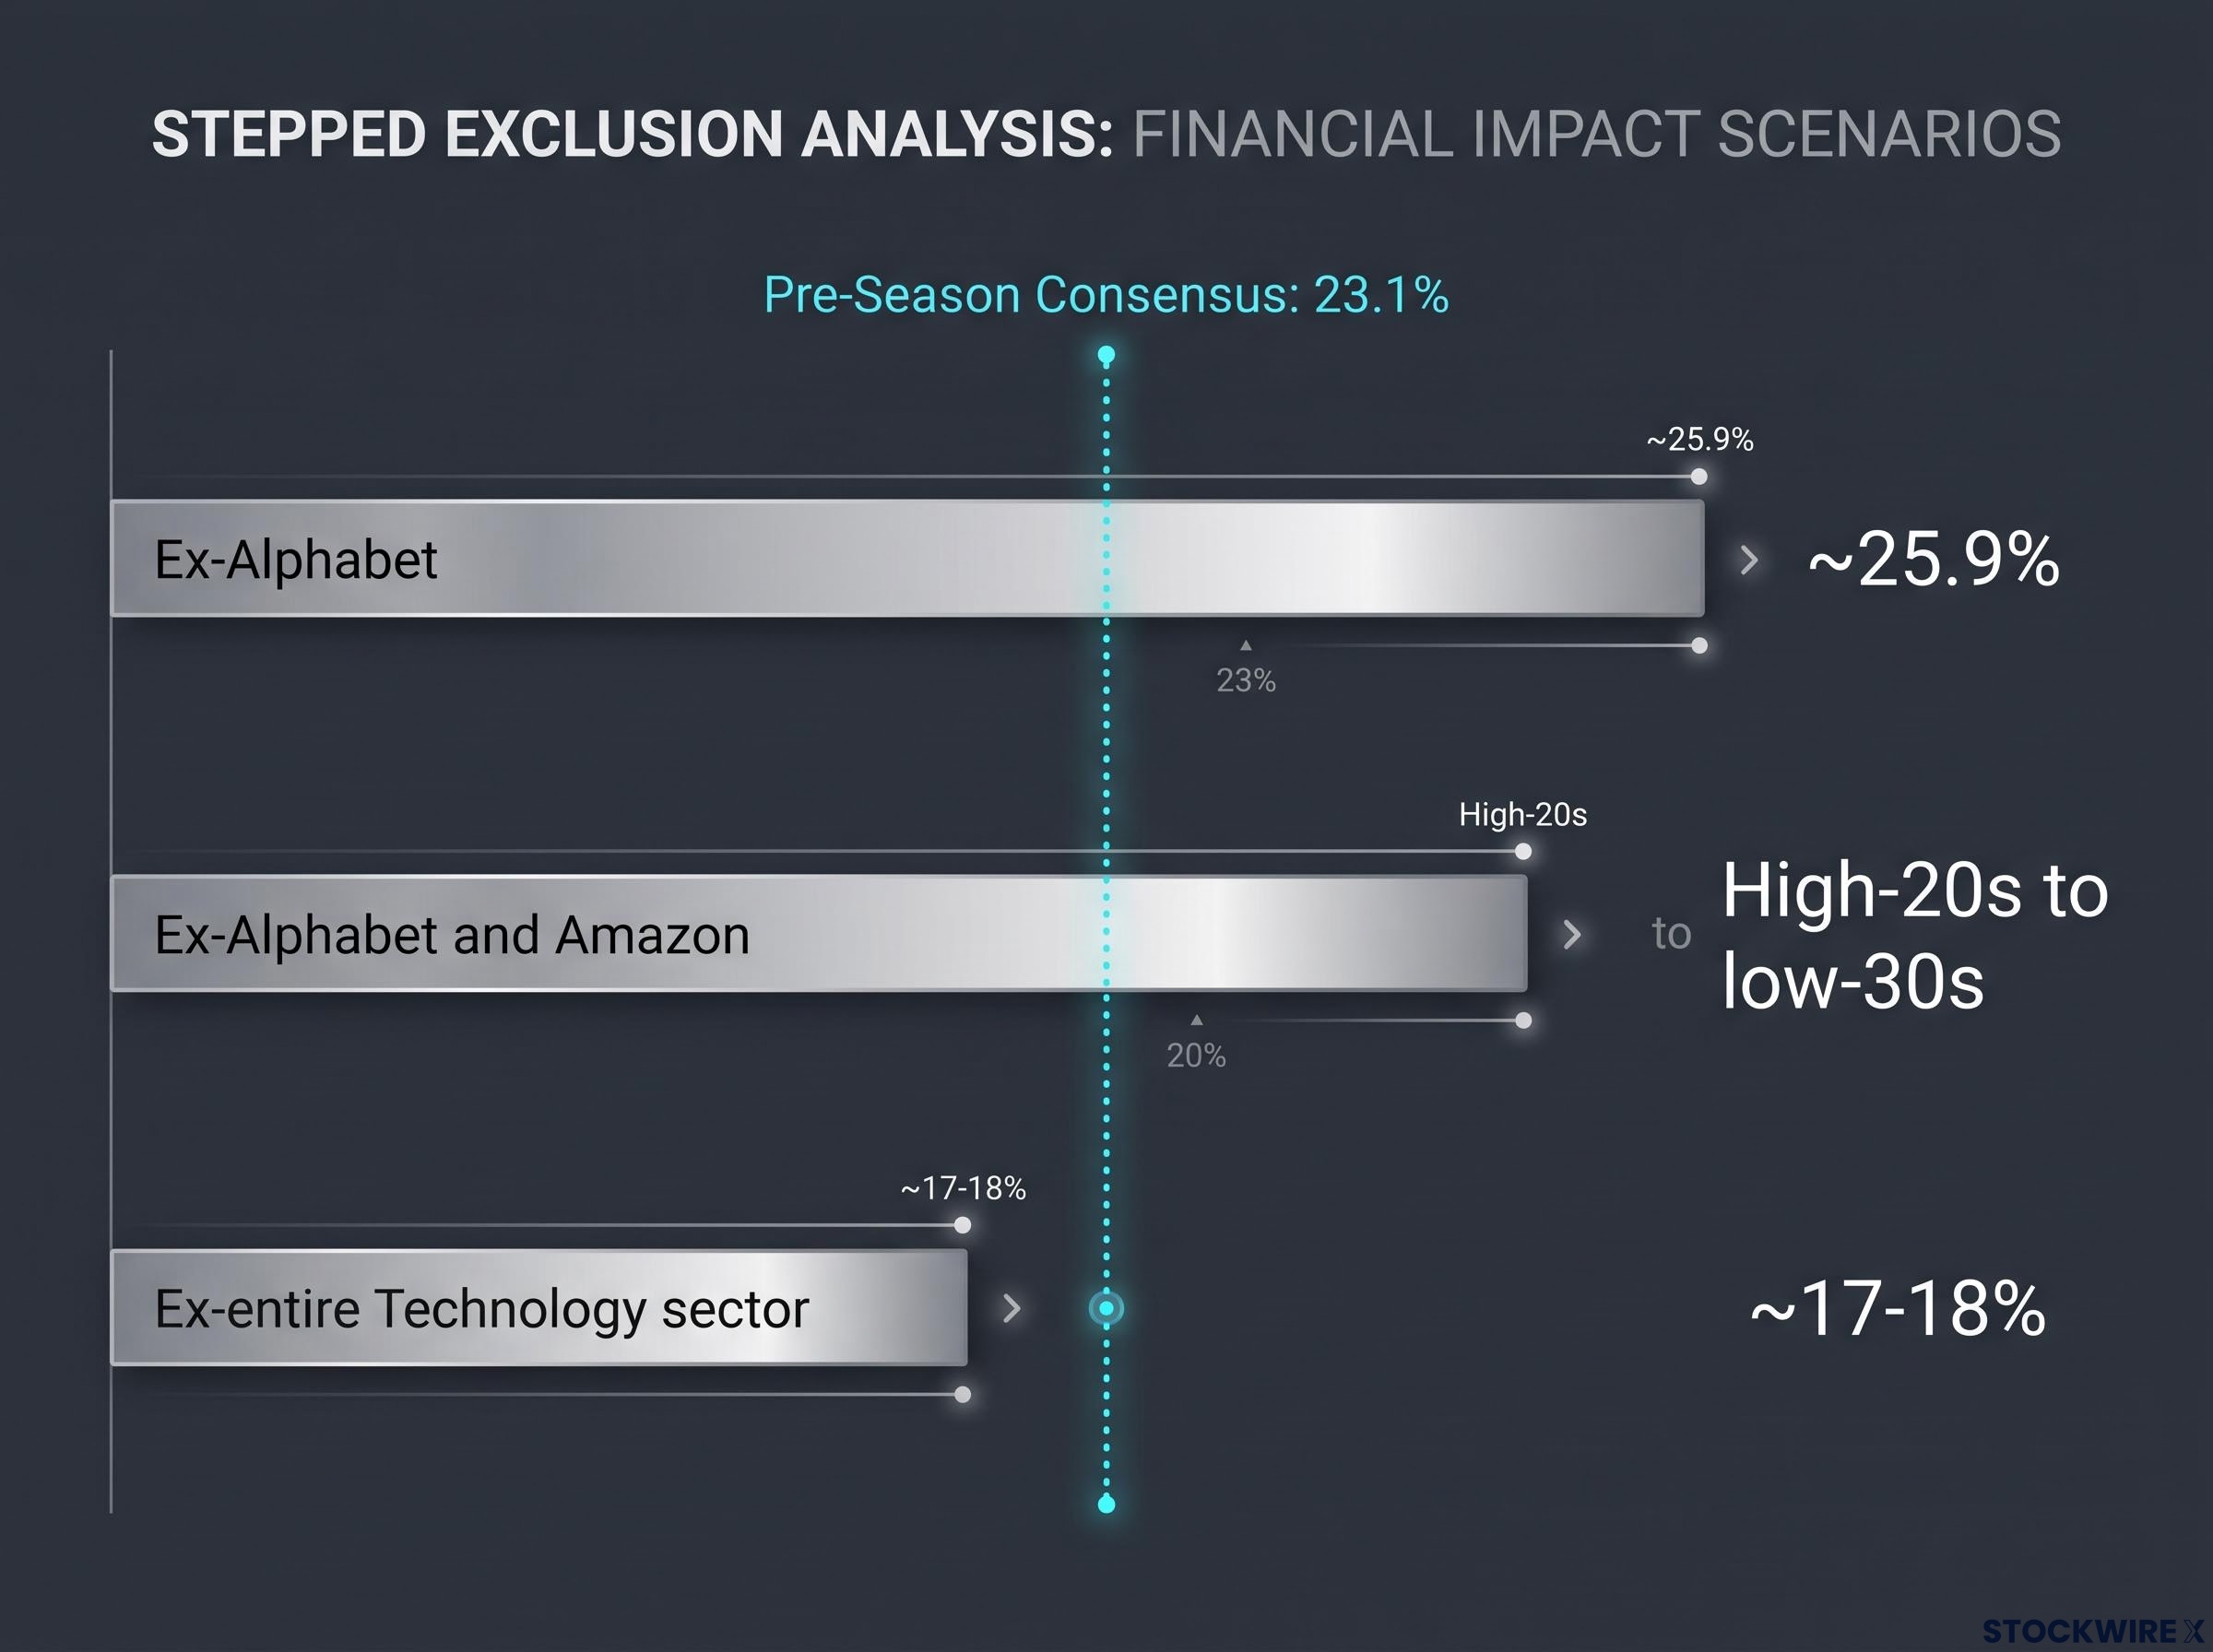 \n\n> In two of three exclusion scenarios, growth remains above what analysts had projected for the full index at the start of the quarter. The parts of the market that the AI narrative ignores still delivered more than the consensus expected from everything.\n\nAll three scenarios share one conclusion: the earnings story does not collapse when large AI-related contributors are removed. It compresses, which is expected, but it does not break.\n\n## Profit cycle strength in developed international markets\n\nThe profit cycle would look far less convincing if its strength were confined to a narrow set of US technology companies benefiting from domestic AI capital flows. What makes the Q2 picture more persuasive is that comparable earnings momentum appeared in developed markets well removed from that dynamic.\n\nFisher Investments data shows that Japanese corporate earnings expanded by more than 35% year-over-year in Q1 2026, with forecasts from analysts pointing to a similar pace of growth when Q2 results are tallied. That figure carries an important sourcing note: it is attributed to Fisher Investments directly, and independently confirmed index-level data from TOPIX or MSCI Japan was not available in the research set, so treat it as directional evidence rather than a precision benchmark.\n\nThe directional point, however, matters. Across the developed world, Q1 2026 earnings came in solidly, and Q2 projections suggest a broadly similar outcome, with Financials and cyclical sectors showing particular strength in several markets.\n\n- US earnings drivers: AI capital expenditure, broad sector participation, technology-led surprises\n- International earnings drivers: Financials strength, cyclical recovery, currency dynamics\n\nThe geographic independence of earnings strength should make you more confident that the current profit cycle has genuine economic foundations rather than resting on a single country’s technology investment narrative.\n\n## What a 50% earnings quarter cannot and should not tell you\n\nA 50.4% growth quarter is not a run rate. The Q2 2021 comparison, when growth reached 91.6% off pandemic-depressed earnings, demonstrates how sharply high-growth quarters revert as the base normalises. Q2 2026 benefited partly from favourable base effects against Q2 2025 comparables, and year-over-year growth will compress as those comparisons reset, even if underlying corporate profitability holds steady.\n\nThat distinction matters. A lower headline number next quarter is not automatically a warning sign. It is the arithmetic of a rising base.\n\n### Four questions to carry into Q3 2026 earnings season\n\n1. Is revenue or margin expansion driving the beats? Whether companies grew the top line or squeezed more profit from the same revenue has different implications for how long this earnings trajectory can sustain. Revenue-driven growth is generally more durable.\n\n2. How much of the current valuation reflects the new earnings base? The pre-season consensus of 23.1% is now the floor, not the ceiling, for how analysts approach Q3 and Q4. The \”already priced in\” question is legitimate and unresolved.\n\n3. Can margins hold as cost pressures and AI investment cycles continue? Companies are investing heavily in AI infrastructure. Whether those investments compress margins before delivering returns is a live uncertainty.\n\n4. When does AI capital expenditure demand begin to show return profiles that justify continued investment at scale? A portion of current earnings strength reflects demand generated by AI infrastructure buildout. The duration and eventual returns of that cycle remain open questions.\n\n> Past performance does not guarantee future results. Financial projections are subject to market conditions and various risk factors.\n\n## What the full Q2 evidence set tells investors about the earnings cycle\n\nA 27-percentage-point collective forecasting error at the index level is the synthesis anchor. Systematic underestimation at that scale tells you analyst models were positioned for a materially weaker profit cycle than the one that actually arrived.\n\nThe breadth evidence reinforces that reading. The beat rates, the sector participation across 8 of 11 sectors, the three exclusion analyses that all showed growth above or near consensus even without the largest AI contributors, the international corroboration from Japan and broader developed markets: taken together, these data points paint a picture that extends well beyond an AI theme with peripheral noise. What they reveal instead is a broad profit cycle in which AI is a significant but not singular driver.\n\nThe relevant question is not whether AI is contributing to earnings. It clearly is. The question is whether the earnings foundation beneath the current valuation is narrow enough to break when AI narratives shift. The Q2 data suggests it is not, but the sustainability questions, the base effects, and the margin uncertainties identified above remain live.\n\nWhich reading of Q2 you adopt, an AI quarter or evidence that the earnings cycle is broad and running ahead of analyst models, matters more than any single sector result. The data now gives you the material to make that call yourself.\n\n> This article is for informational purposes only and should not be considered financial advice. Investors should conduct their own research and consult with financial professionals before making investment decisions.“
The corporate profit margin backdrop entering Q2 was already at a structural extreme: US nonfinancial after-tax margins reached 14.4% in Q1 2026, the highest recorded during any post-recession expansion since 1929, which means the Q2 earnings beats were delivered from an already elevated profitability baseline rather than a recovery from compressed margins.
AI capital expenditure returns are not yet settled: Goldman Sachs projects hyperscaler capex at $755-$800 billion in 2026, absorbing roughly 93-94% of operating cash flow according to PIMCO estimates, and whether those outlays compress margins before delivering revenue acceleration is precisely the open question that makes current earnings strength difficult to extrapolate mechanically.
The earnings broadening reading gains independent corroboration from the Russell 3000 data: the median stock in that index delivered 15% profit growth in Q2 2026, the strongest pace since 2021, confirming that the beat rates visible at the S&P 500 level are not an artefact of cap-weighting inflating a handful of large positions.
The pattern is not new to 2026: the Q1 2026 earnings season produced a blended growth rate of 27.1% against a pre-season forecast of 13.1%, a near-doubling of expectations that closely mirrors the Q2 dynamic and suggests analyst conservatism has been a structural feature across both reporting periods this year.