UBS Raises TSMC Price Target 13% to T$3,400 Before Q2 Earnings
4 hrs ago
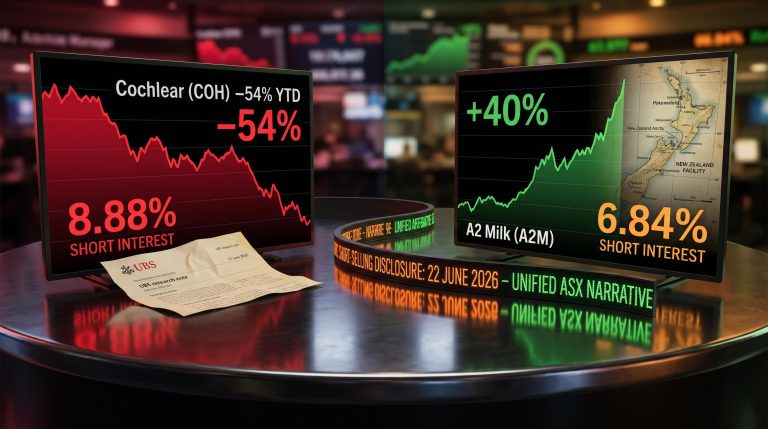
Industrials, Consumer Staples, and select Financials printed fresh 52-week highs on the ASX 200 in the week ending 26 June 2026, while Energy stocks slid to new lows. Declining oil prices are the thread connecting both sides of that trade.
New yearly price highs across the S&P/ASX 200 remained limited and concentrated in Week 27. The same names kept appearing on the daily highs list, a pattern that points to deliberate institutional buying rather than scattered retail momentum. Understanding which sectors are leading, and why, matters for any investor assessing where the market is pricing conviction right now.
Here is the sector scorecard, the stocks driving the move, the macro logic behind the rotation, and where momentum could extend in coming weeks.
Declining oil prices are the single macro force splitting ASX sector performance this week. The mechanism runs in two directions simultaneously.
For energy producers, softer crude compresses margins and weakens the earnings outlook. For consumer-facing and infrastructure-adjacent businesses, lower fuel costs reduce input expenses, ease inflation pressure, and strengthen the case for stable or lower interest rates. That rate backdrop, in turn, lifts the appeal of yield-sensitive and defensive sectors.
The oil price transmission mechanism runs symmetrically: the same channel that sent energy producers surging when Brent hit $116.62 in April and compressed consumer and transport margins is now operating in reverse, easing input costs for logistics-intensive businesses and softening the inflation outlook that drove the RBA to 4.10%.
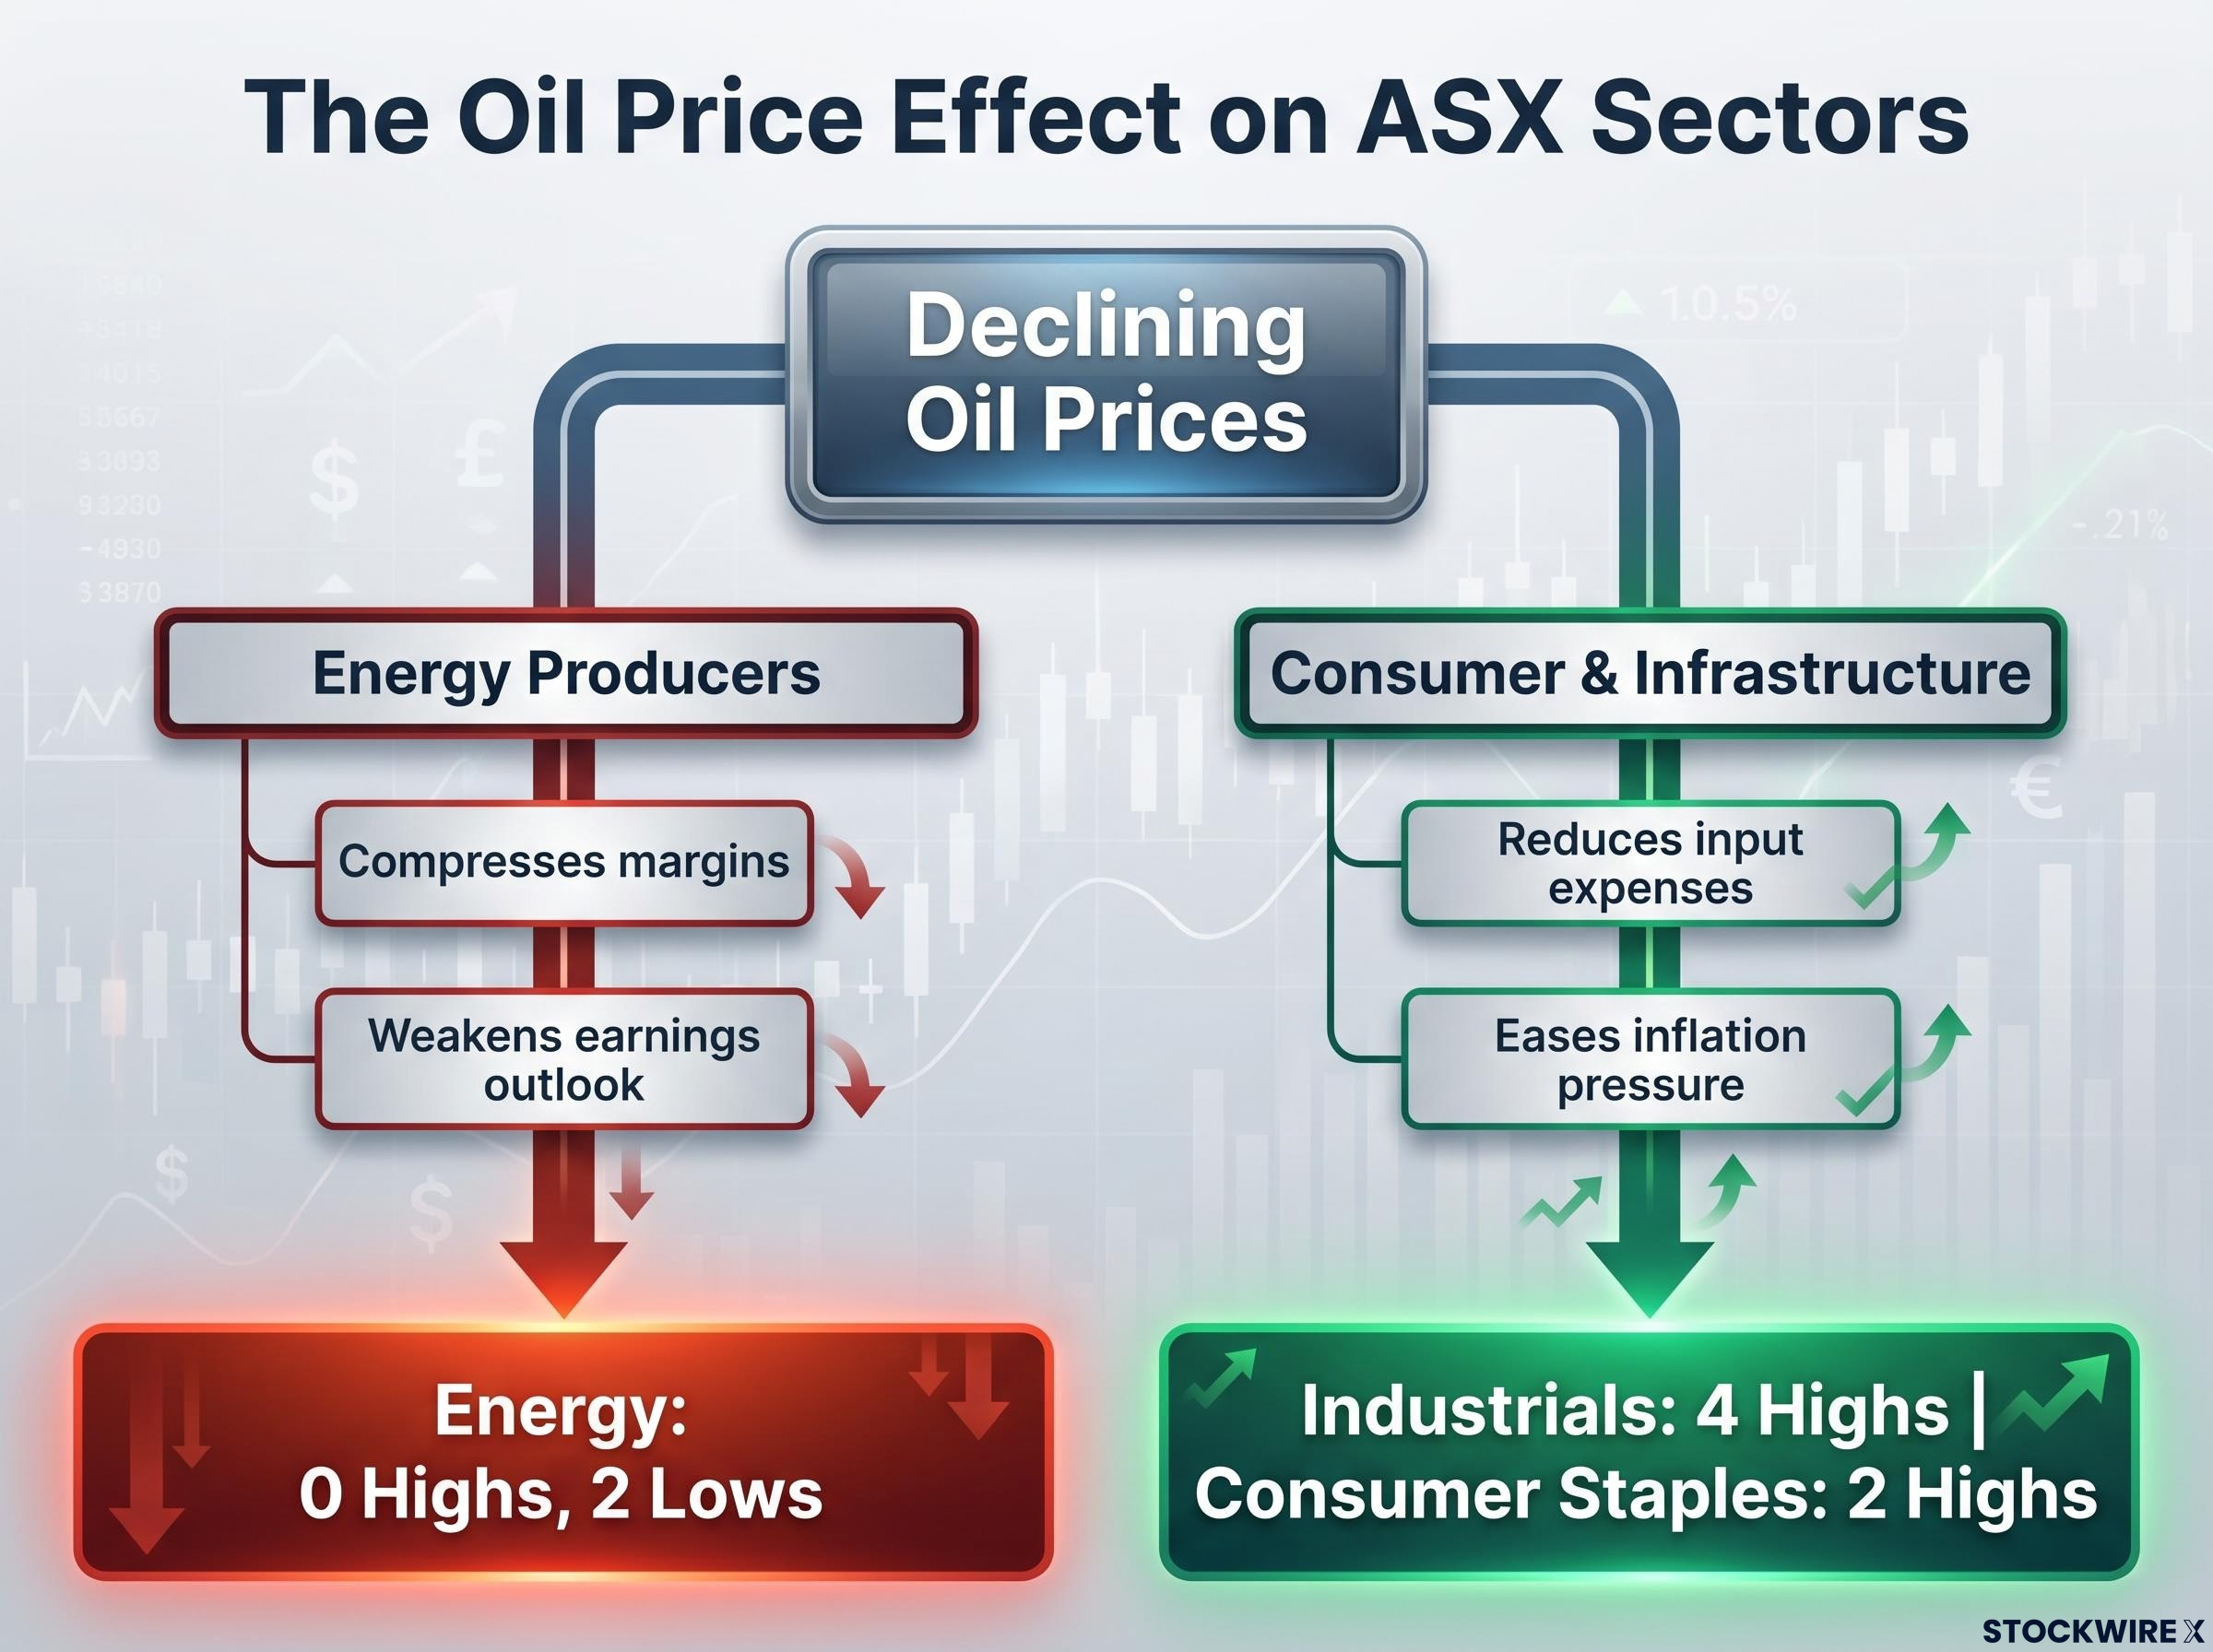
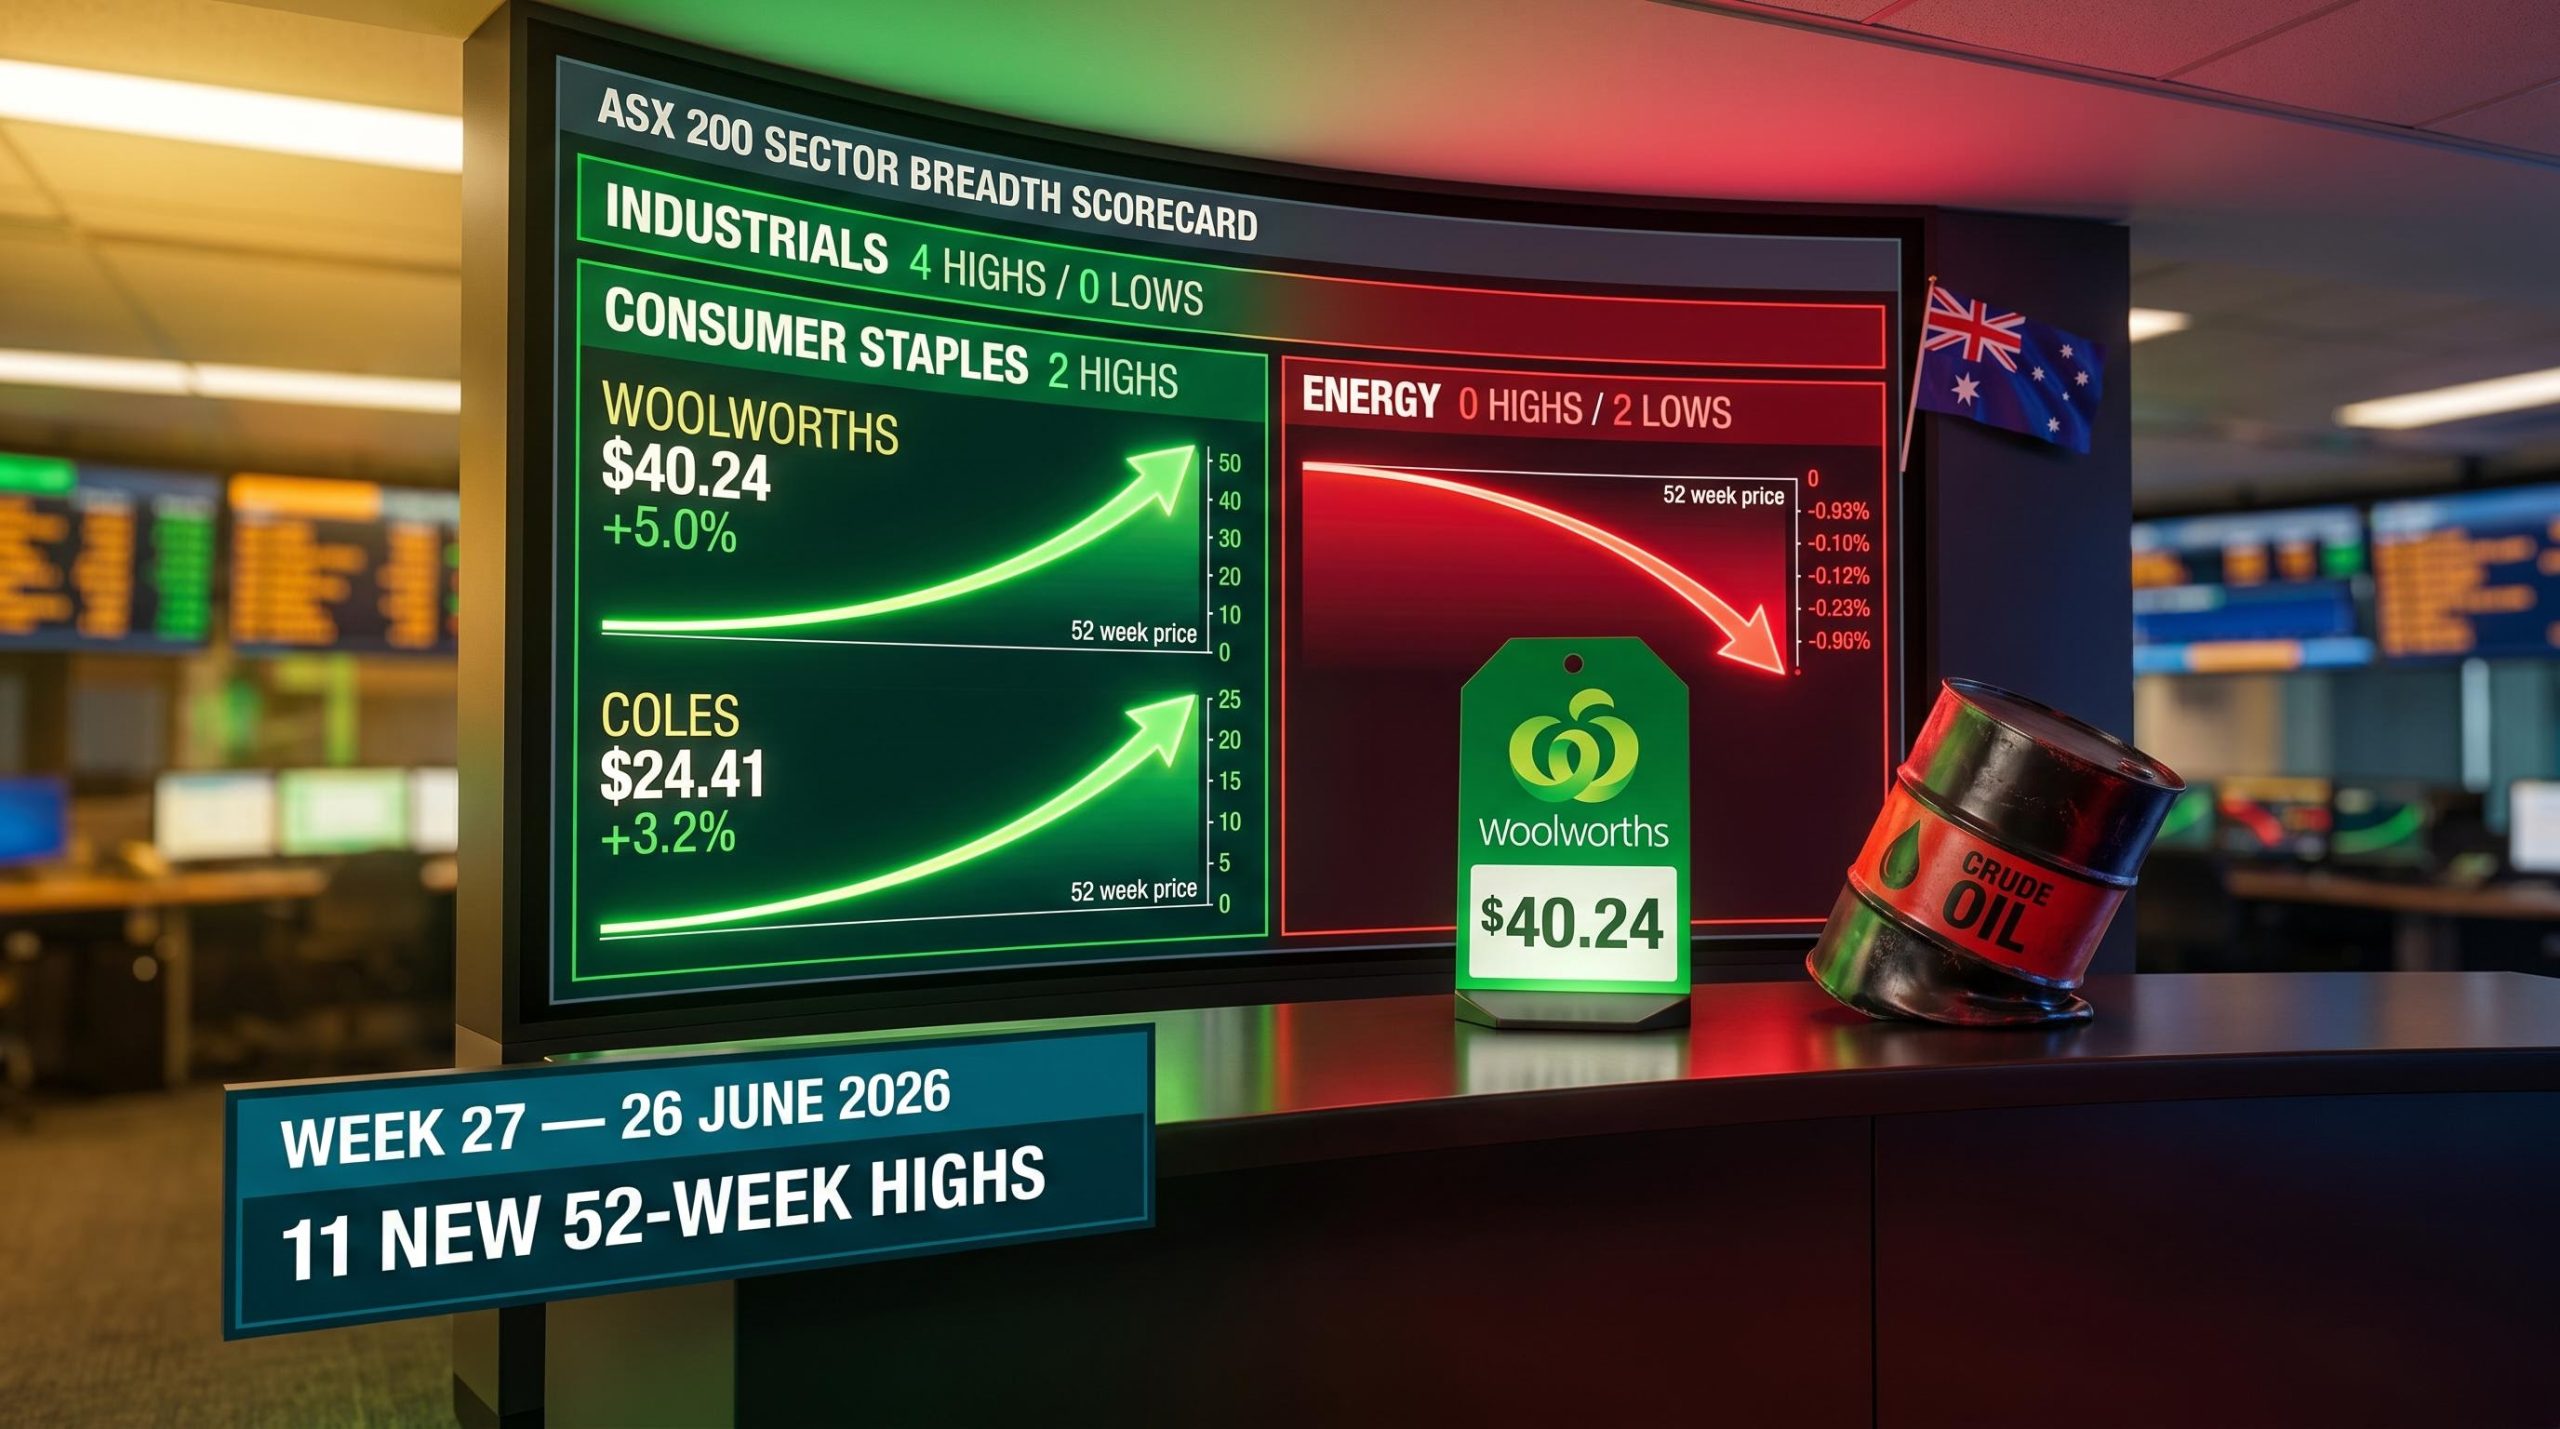
The sector data maps the split cleanly. Industrials recorded 4 highs and 0 lows. Consumer Staples posted 2 highs and 1 low. Energy managed 0 highs and 2 lows.
Energy records 0 highs and 2 lows; Consumer Staples records 2 highs. The oil price effect is doing the work.
If oil prices stay soft, the same sectors printing highs this week are likely to keep attracting inflows. The positioning visible in this data reflects that expectation already being priced in.
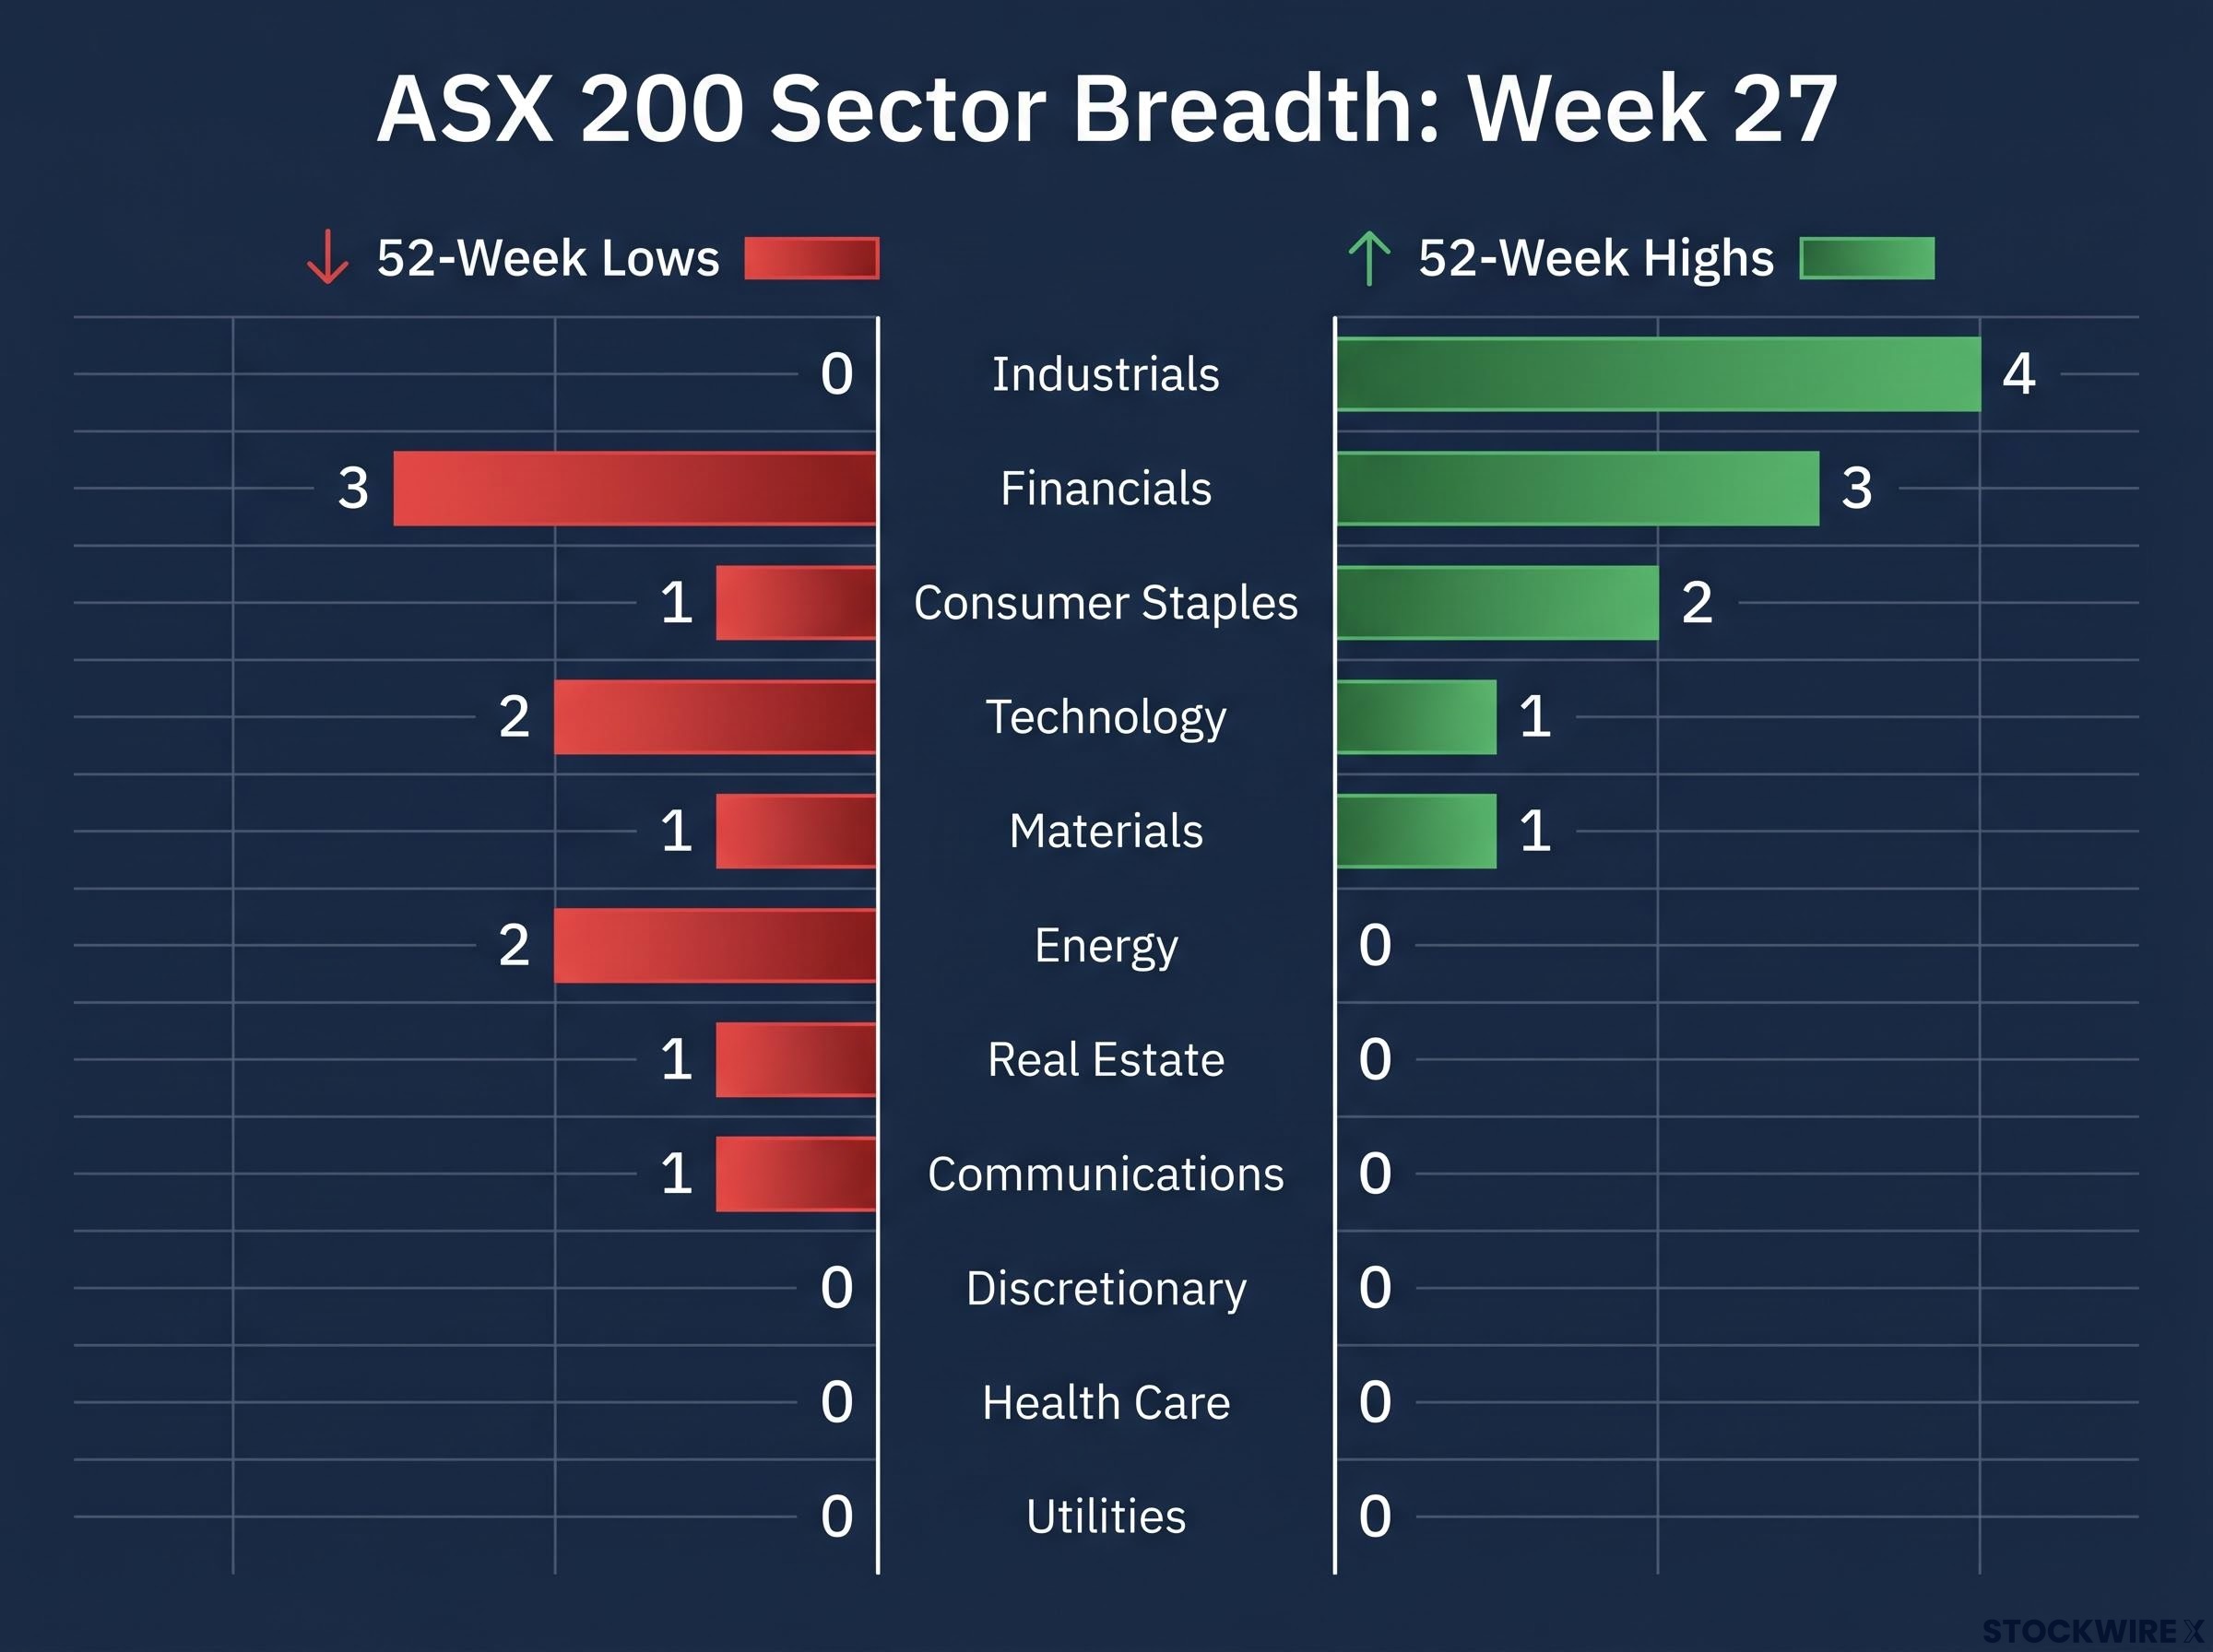
The highs-to-lows ratio is a breadth indicator. It measures how many individual ASX 200 constituents within each sector hit new 52-week highs versus new 52-week lows during the week. It is not a price return measure for the sector index; it tells you how many individual stocks are participating in a move, which is a more granular read on where conviction actually sits.
| Sector | 52-Week Highs | 52-Week Lows | Net Signal |
|---|---|---|---|
| Industrials | 4 | 0 | Strongest positive |
| Financials | 3 | 3 | Bifurcated |
| Consumer Staples | 2 | 1 | Defensive leadership |
| Technology | 1 | 2 | Stock-specific |
| Materials | 1 | 1 | Narrow |
| Energy | 0 | 2 | Clear weak spot |
| Real Estate | 0 | 1 | Weak |
| Communications | 0 | 1 | Weak |
| Discretionary | 0 | 0 | Neutral |
| Health Care | 0 | 0 | Neutral |
| Utilities | 0 | 0 | Neutral |
The pattern breaks into three categories:
The breadth table tells you where institutional money is expressing high conviction and where it is actively withdrawing. Energy’s clean sweep to the downside is not noise; it is a directional signal that warrants deliberate positioning decisions.
Eleven stocks across the ASX 200 hit new 52-week highs in Week 27. Grouped by theme, they tell a coherent story about what investors are willing to pay up for right now.
| Company (Ticker) | Sector | 52-Wk High | 1-Yr Return | Weekly Move |
|---|---|---|---|---|
| Minerals 260 (MI6) | Materials | $0.85 | +639.1% | -8.6% |
| SRG Global (SRG) | Industrials | $4.02 | +137.9% | +1.3% |
| Megaport (MP1) | Technology | $20.26 | +48.7% | -3.3% |
| Dalrymple Bay Infrastructure (DBI) | Industrials | $5.82 | +38.6% | +0.3% |
| Woolworths Group (WOW) | Consumer Staples | $40.24 | +28.8% | +5.0% |
| Ventia Services Group (VNT) | Industrials | $6.46 | +24.2% | -2.0% |
| Challenger (CGF) | Financials | $9.75 | +19.9% | -0.8% |
| Reece (REH) | Industrials | $16.73 | +17.1% | +3.2% |
| Coles Group (COL) | Consumer Staples | $24.41 | +16.9% | +3.2% |
| Washington H. Soul Pattinson (SOL) | Financials | $45.43 | +7.1% | +2.9% |
| QBE Insurance (QBE) | Financials | $24.84 | +6.0% | +3.2% |
Minerals 260’s +639.1% one-year return is a micro-cap exploration catalyst outcome, not a signal about the broader market. The -8.6% weekly pullback after tagging a new high is typical profit-taking for this risk profile.
This is the kind of extreme outcome that small resource names can produce when development catalysts hit. It is not representative of the week’s story.
Woolworths gained +5.0% on the week to reach $40.24. Coles rose +3.2% to $24.41. Both names appeared repeatedly on the daily highs list across the week, a pattern consistent with institutional accumulation rather than one-off retail-driven spikes.
The tailwind is practical: lower fuel costs reduce logistics expenses for two of Australia’s most transport-intensive businesses, directly supporting margin expectations.
SRG Global (+137.9% one-year return), Dalrymple Bay Infrastructure, Ventia, and Reece all sit at new highs. The common thread is contracted revenue, project pipelines, and infrastructure-style cash flows.
A weekly breadth split four weeks earlier recorded 13 highs against 27 lows, with SRG Global and contract-driven industrials already appearing among the leaders while Consumer Discretionary registered zero highs and 8 lows, a pattern that makes the Week 27 industrials sweep look like a continuation rather than a fresh development.
Ventia fell -2.0% on the week yet still sits at a 52-week high. Megaport fell -3.3% and tagged a new high as well. Those highs were set mid-week under genuine buying pressure, not end-of-week window dressing.
Challenger (+19.9% one-year return) is leveraged to demographic-driven annuity demand. Washington H. Soul Pattinson (+7.1%) offers diversified capital allocation. QBE Insurance (+6.0%) benefits from strong insurance pricing.
The Financials sector simultaneously produced 3 new lows in the same week, reinforcing that these highs are stock-specific rather than a sector-wide rally. Investors are rewarding yield and diversification within Financials while punishing names that fail those criteria.
Financials is the week’s clearest example of internal dispersion. Three stocks at new highs and three stocks at new lows in the same sector in the same week. That is not a sector story. That is a market making deliberate individual stock decisions.
Three highs and three lows in Financials in the same week. That is not a sector story. That is a stock-picker’s market.
Technology shows a similar pattern on a smaller scale. Megaport hit a new 52-week high with a +48.7% one-year return, while two other technology names simultaneously fell to new lows. MP1’s -3.3% weekly decline, despite the new high, reinforces that the buying was concentrated and mid-week.
The connecting conclusion: when top-performing sectors show this level of internal dispersion, it signals that investors are making deliberate stock-selection decisions rather than sector-level bets.
Institutional capital rotation on 2 June followed a similar internal logic, with 184 decliners against just 99 advancers beneath a near-flat headline close as fund managers closed underweight positions in globally exposed technology and base metals, providing a reference point for how concentrated reallocation can leave the index-level return misleading.
For investors using sector ETFs or broad financials and technology exposures, this bifurcation means the index-level return is obscuring very different outcomes underneath. Stock selection is not optional in this environment.
Three sectors currently sit at neutral: Discretionary, Healthcare, and Utilities, all recording 0 highs and 0 lows in Week 27. If oil prices remain soft and inflation decelerates, these are the sectors most likely to begin appearing on the new-high list.
The mechanism is the same one already benefiting Staples and Industrials. Lower input costs and softer interest rate expectations improve earnings visibility for consumer-facing and rate-sensitive businesses.
What to watch in coming weeks:
If you are tracking this data weekly, the first Discretionary or Utilities name to appear on the 52-week highs list would signal the current rotation is extending, not just holding.
Three features defined Week 27: defensive and infrastructure leadership, a macro-driven sector rotation powered by softer oil prices, and high internal dispersion requiring stock-level rather than sector-level positioning.
Eleven stocks hit new 52-week highs across a concentrated set of themes. The repeated daily appearances of Woolworths, Coles, SRG Global, and Ventia on the highs list point to institutional accumulation, not noise. Meanwhile, the Industrials (4 highs, 0 lows) versus Energy (0 highs, 2 lows) contrast is the cleanest summary of where the market is placing its bets.
This is a late-cycle, yield-and-quality-seeking environment. Investors are discriminating within sectors rather than rotating between them. The narrow concentration of new highs is itself a signal: when breadth is tight and the same defensive names keep appearing, the market is telling you something about the risk it is willing to take on, and where it is not.
When the same defensive names keep printing 52-week highs week after week, the market is telling you where the conviction sits and where it does not.
Monitor the weekly highs list for recurrence, track whether Discretionary, Healthcare, or Utilities names begin appearing, and treat Energy’s continued absence from the highs list as a positioning signal.
For investors wanting to extend the Week 27 positioning logic into a broader macro frame, our full analysis of the Australian market outlook examines how compressed equity risk premiums, elevated bond yields, and the RBA rate trajectory combine to shape the environment in which the current defensive rotation is playing out.
This article is for informational purposes only and should not be considered financial advice. Investors should conduct their own research and consult with financial professionals before making investment decisions. Past performance does not guarantee future results.
A 52-week high is the highest price a stock has traded at over the past year, and tracking how many ASX 200 stocks hit new highs versus new lows each week reveals where institutional conviction is actually concentrated, rather than relying on broad index-level returns that can obscure very different outcomes underneath.
Industrials led with 4 new 52-week highs and zero lows, Consumer Staples recorded 2 highs and 1 low, and Financials showed 3 highs alongside 3 simultaneous lows; Energy was the weakest sector with 0 highs and 2 lows.
Lower oil prices reduce logistics and input costs for transport-intensive businesses like Woolworths and Coles while softening the inflation outlook, which strengthens the case for stable or lower interest rates and lifts the appeal of defensive and infrastructure-adjacent sectors.
Three Financials stocks (Challenger, Washington H. Soul Pattinson, and QBE Insurance) hit new 52-week highs in the same week that three other Financials names fell to new lows, meaning a broad Financials ETF return will mask dramatically different individual stock outcomes and stock selection becomes essential.
Discretionary, Healthcare, and Utilities all recorded zero highs and zero lows in Week 27, and if oil prices remain soft and inflation decelerates, these rate-sensitive and consumer-facing sectors are the most likely candidates to begin appearing on the new-high list in coming weeks.