Stock-Bond Correlation Hits 30-Year Extreme, Rattling 60/40 Investors
43 mins ago
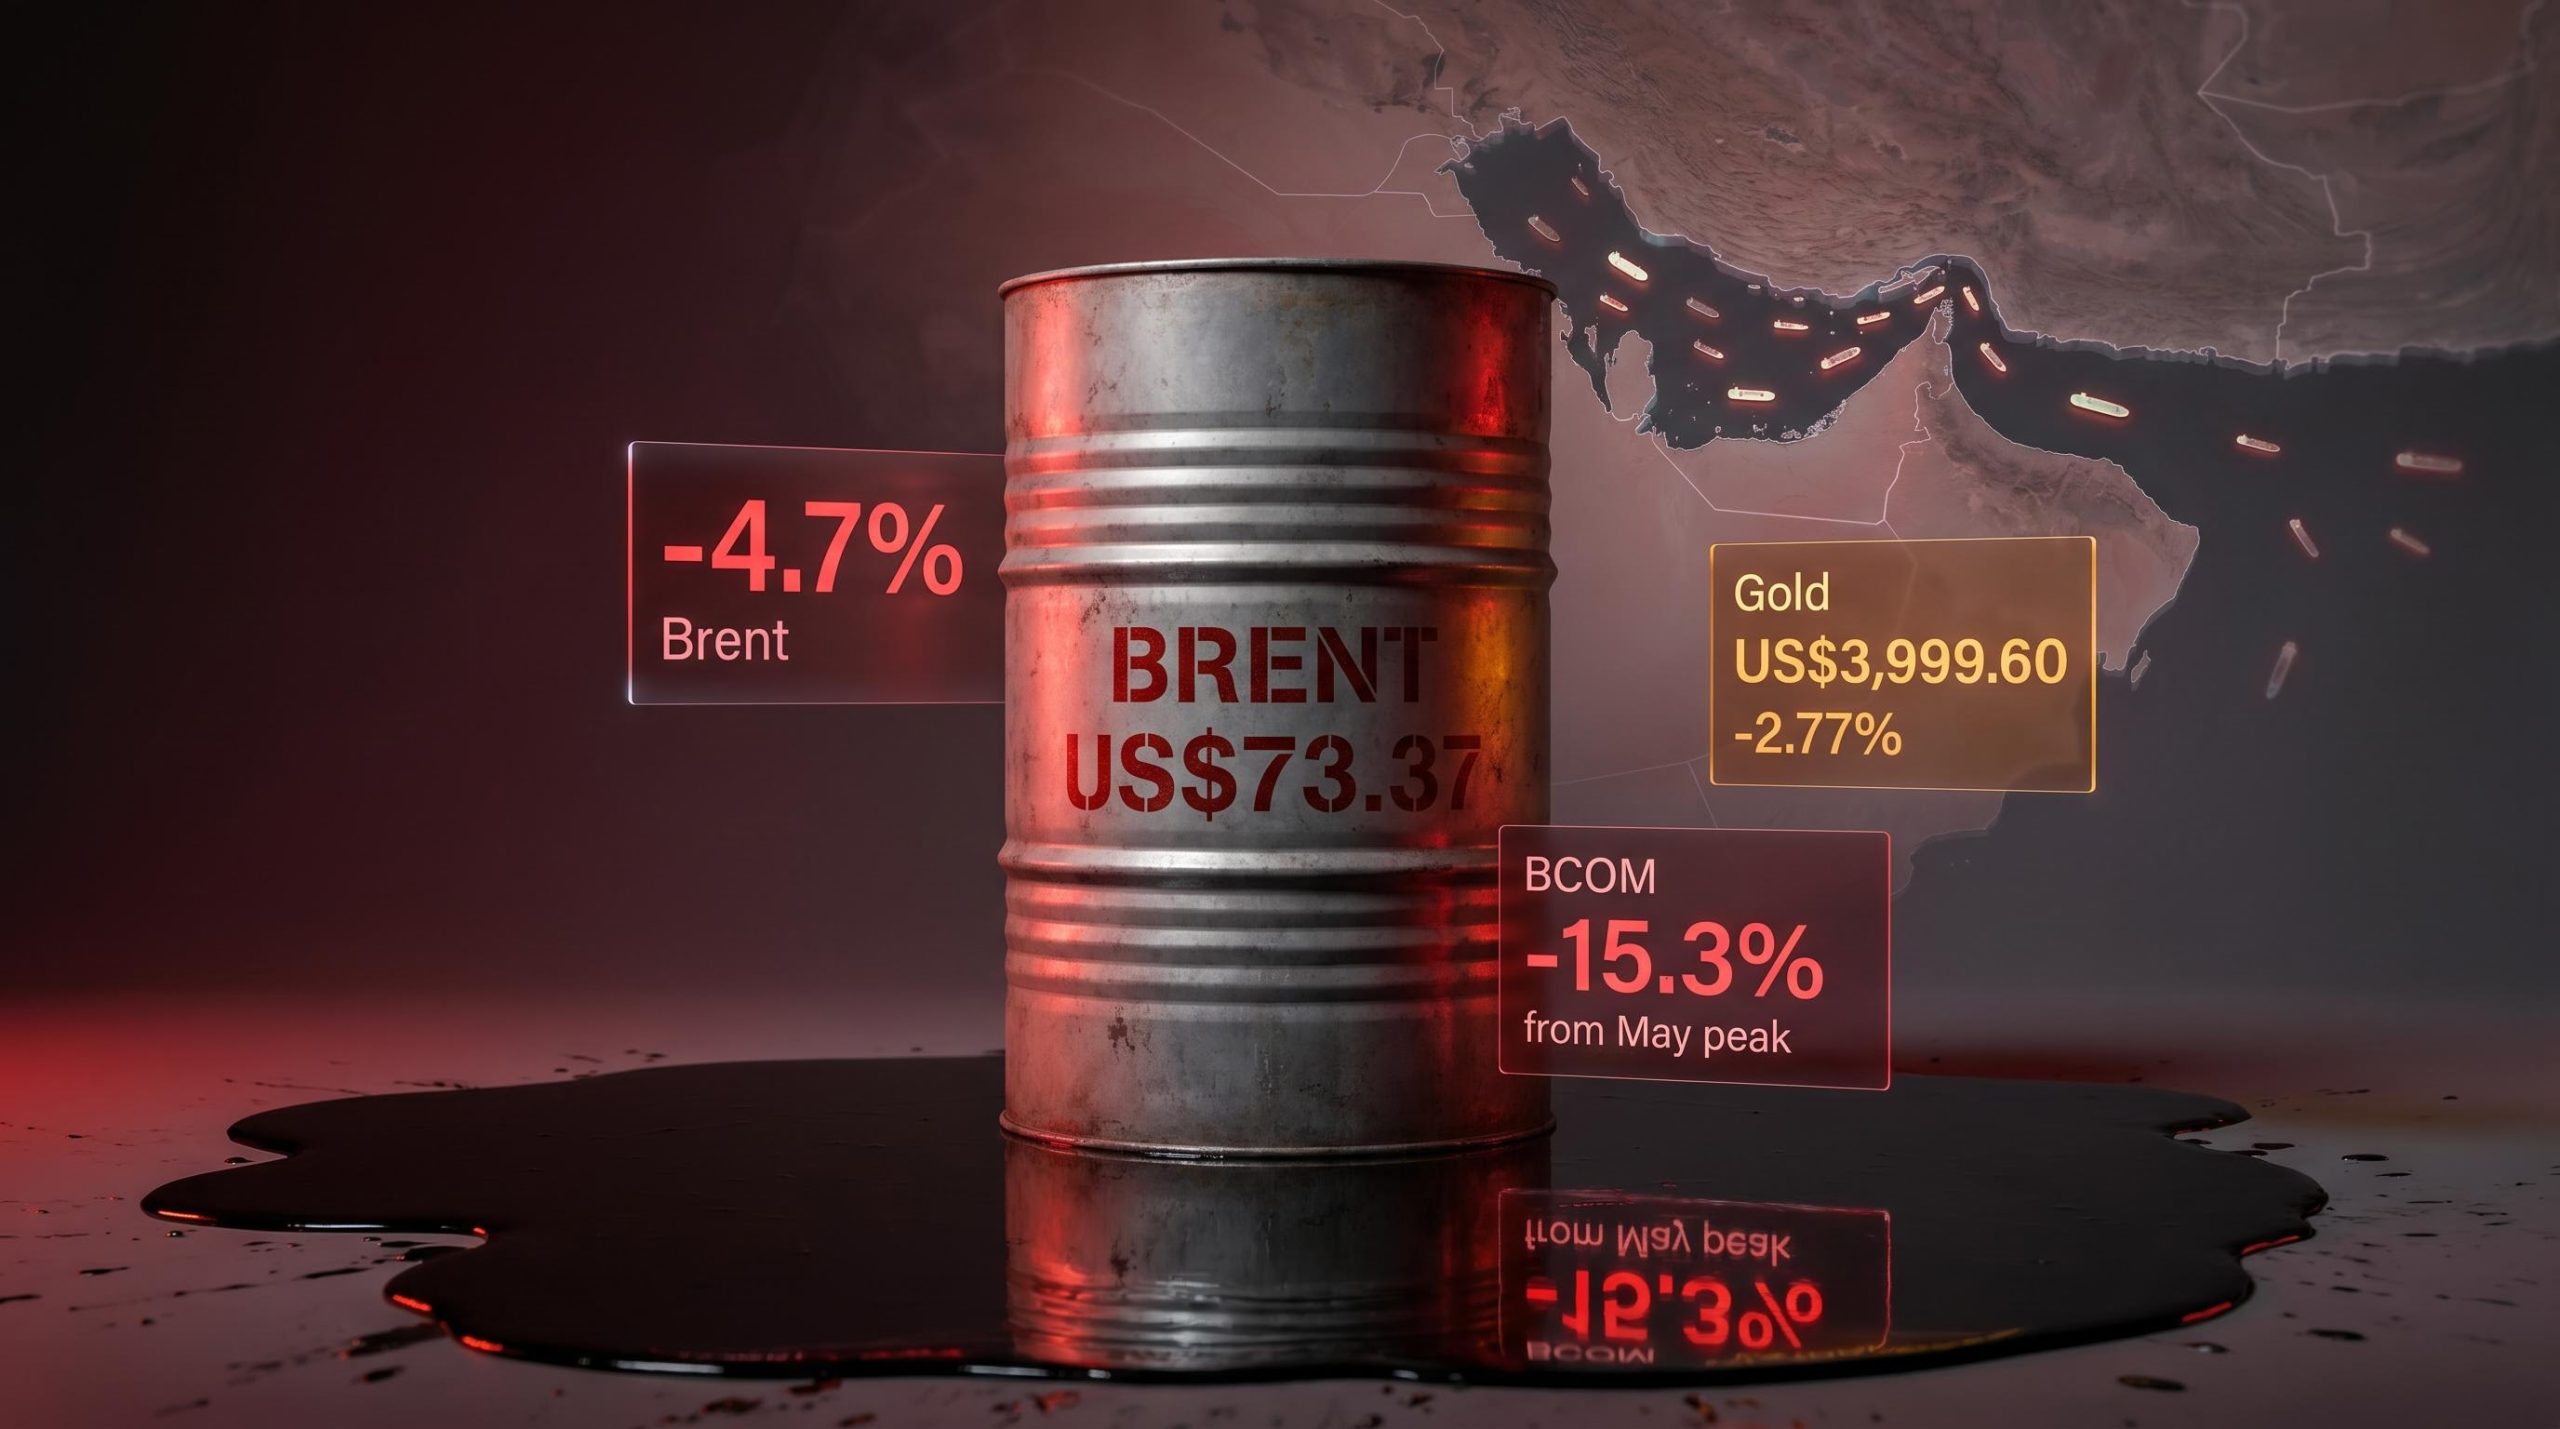
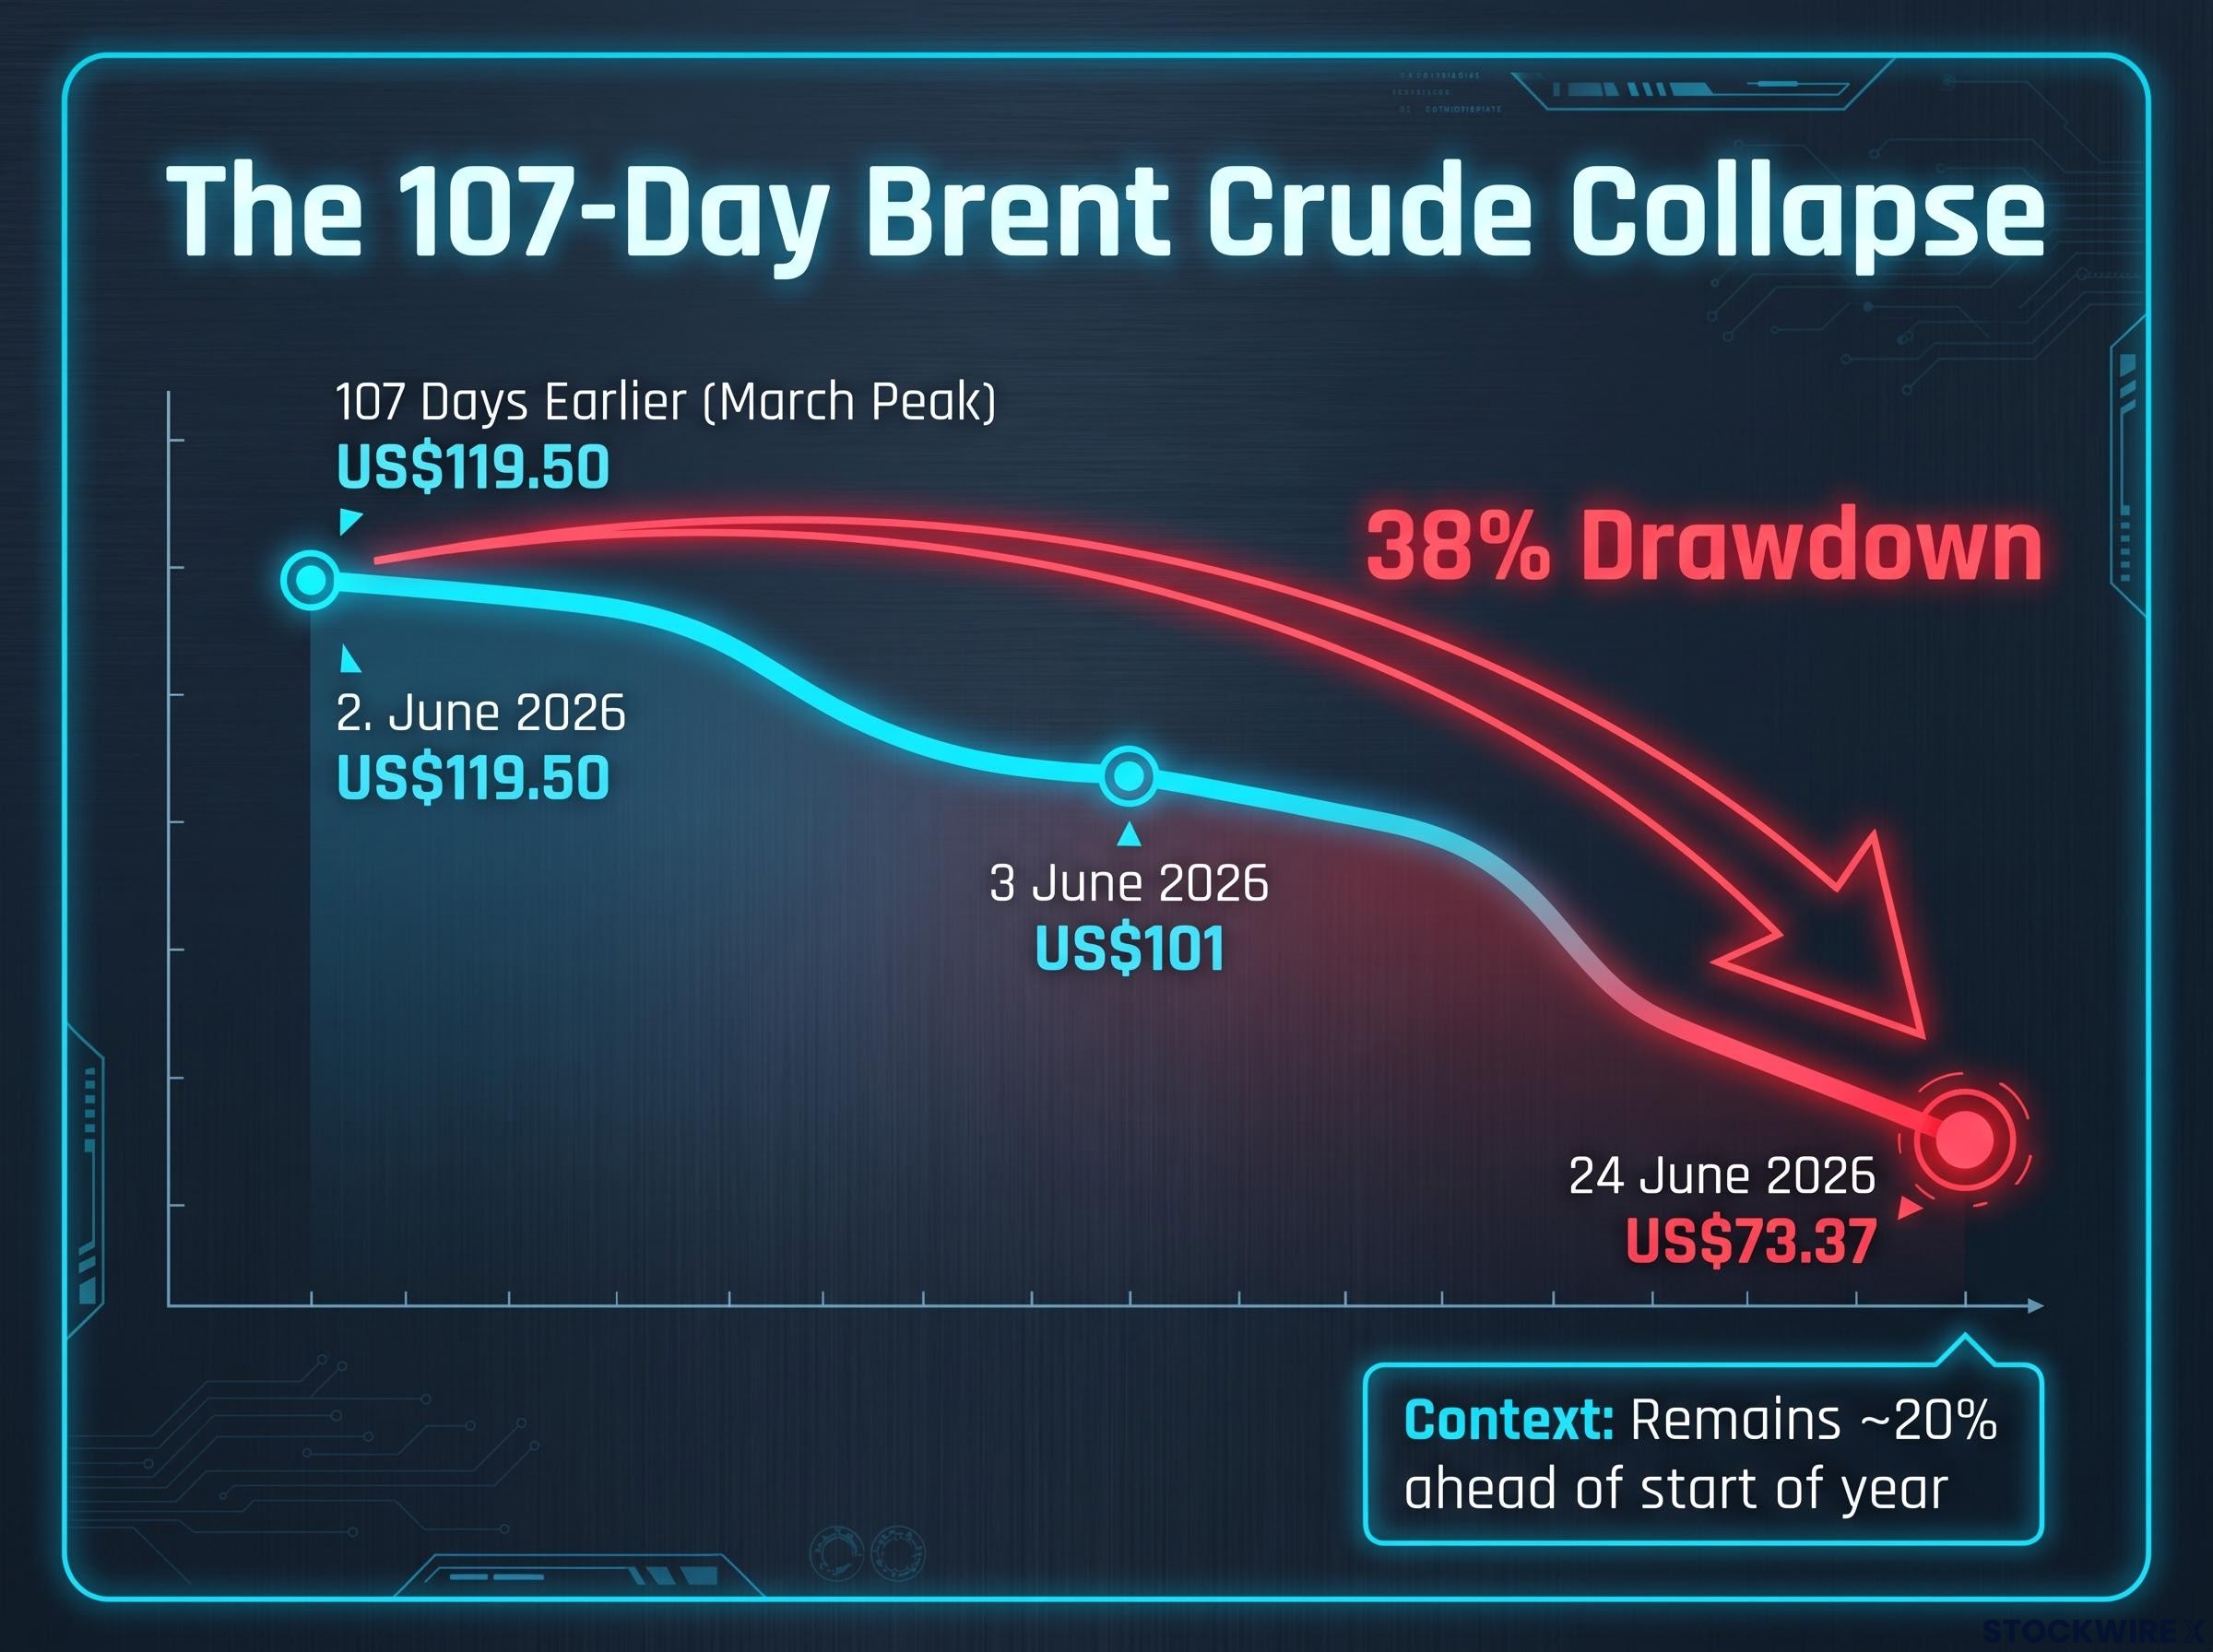
On 24 June 2026, Brent crude shed 4.7% across the session, settling at US$73.37 per barrel. That number alone is striking. What makes it remarkable is the context: just 107 days earlier, Brent was trading at US$119.50. The war premium built into global energy markets has not faded. It has collapsed.
The Strait of Hormuz is reopening. US-Iran nuclear negotiations are advancing. The US dollar has hit a 13-month high. Each of these forces would move commodity markets on its own. The three arriving simultaneously produced a selloff that spread well beyond oil, dragging down gold, copper, aluminium, and the Bloomberg Commodity Index to levels not seen since well before the Middle East conflict escalated.
Here is how the specific forces driving the selloff connect, what the damage looks like across the commodity complex, and what the sustained decline in energy and metals prices means for Australian resource stocks, inflation, and the RBA’s next move. The analysis separates the structural drivers likely to persist from the macro headwinds that could shift quickly.
The tankers are moving again. CNBC reported that a minimum of 20 vessels that had been stranded in the Persian Gulf for over three months successfully cleared the Strait of Hormuz with their tracking systems active. According to the same reporting, oil flows through the waterway are now running at around 4.8 million barrels per day.
The speed of the supply restoration matters as much as its scale. Markets had priced in a prolonged disruption. The faster-than-expected normalisation is why a 38% drawdown happened in weeks rather than months, with Brent still above US$101 as recently as 3 June 2026.
Three operational factors combined to restore supply confidence:
For Australian investors holding energy-linked assets, this is not an abstract geopolitical footnote. The Hormuz reopening is the mechanism that directly unwound the war premium embedded in every energy position in their portfolios, and the physical supply math explains why the selloff is not a sentiment-driven overreaction.
The 57% oil price surge that carried Brent from approximately US$70 per barrel in late February to above US$110 by mid-May reflected a peak shut-in of nearly 10.8 million barrels per day, equivalent to removing roughly 80% of total US crude output from global supply, a supply gap that existing bypass pipeline infrastructure could not bridge.
The supply story tells you what has already happened. The diplomatic track tells you what the market expects to happen next, and that forward signal is where the pricing power now sits.
Trading Economics reported on 25 June 2026 that a US waiver allowing purchases of already-loaded Iranian oil contributed directly to the price decline. The waiver is not a symbolic gesture. It is a mechanism for Iranian barrels to reach buyers without triggering sanctions, and traders read it as a signal that a sustained supply surplus is being priced into 2026, not a temporary supply restoration.
According to Reuters and Bloomberg reporting from 23-24 June 2026, US President Donald Trump stated via Truth Social that the Strait of Hormuz would carry no transit fees, warning that US-Iran negotiations would be “immediately terminated” if Iran imposed such charges.
The same Reuters and Bloomberg reporting noted that US Secretary of State Marco Rubio launched a tour of Middle Eastern nations with the purpose of assuring Gulf partners that the concessions being made in the Iran negotiations are not disproportionate. The tour itself is a signal: the US is managing the diplomatic fallout of a deal that is moving faster than allies expected.
Four active diplomatic variables are now shaping the forward oil curve:
The conflicting public statements between Trump and Iran on nuclear inspections inject residual uncertainty. But the market is not waiting for resolution. It is pricing a sustained supply surplus, and that distinction has direct implications for where oil settles over the next two quarters for anyone holding energy equities or commodity ETFs on the ASX.
Gold has no exposure to the Strait of Hormuz. Neither does copper. Yet gold closed at US$3,999.60 on 24 June 2026, a decline of 2.77% that brought it to its weakest point since 10 November 2025, according to Market Index data. Copper surrendered 2.68% to finish at US$5.98 per pound, with losses accumulating to around 6% across just two sessions.
The transmission mechanism is the US dollar. A stronger dollar makes USD-denominated commodities more expensive for holders of other currencies, suppressing demand and therefore prices across the entire complex. This is a standard macroeconomic relationship, but its force depends on the magnitude of the move.
The US dollar index reached a 13-month high in the period around 25 June 2026, according to Barchart. Rising expectations of Federal Reserve rate increases reinforced the move. Higher anticipated US rates support dollar strength and raise the opportunity cost of holding non-yielding commodities, a dynamic that hit gold particularly hard.
The relationship between bond yields and commodity prices has a compounding dimension beyond the currency channel: rising US yields simultaneously increase the opportunity cost of holding zero-income assets like gold and strengthen the dollar, meaning the two pressure mechanisms reinforce rather than offset each other during rate-driven dollar-strength episodes.
The result is a two-force selloff: a geopolitical supply shock unwinding (Hormuz reopening, Iranian barrels returning) combined with a macro demand-side headwind (strong USD, tighter Fed expectations). The severity of the broad decline reflects both forces arriving simultaneously.
| Commodity | Price (24 June 2026) | Session Move | Context |
|---|---|---|---|
| Brent crude | US$73.37/bbl | -4.7% | Pre-conflict levels; 38% below March peak |
| WTI crude | US$69.87/bbl | -4.65% | Tracking Brent decline |
| Gold | US$3,999.60/oz | -2.77% | Lowest since 10 November 2025 |
| Copper | US$5.98/lb | -2.68% | ~6% decline over two sessions |
| Aluminium | Session decline | ~-4.4% | ~17% decline since 2 June 2026 |
Measured from its 13 May 2026 peak, the Bloomberg Commodity Index (BCOM), a broad basket spanning metals, agriculture, and energy, has now retreated by roughly 15.3%. That tells you the selloff is not confined to oil. It is a commodity-wide repricing, and even if Middle East diplomacy stalls and oil stabilises, the broader complex remains under pressure from macro forces that have nothing to do with the Strait of Hormuz.
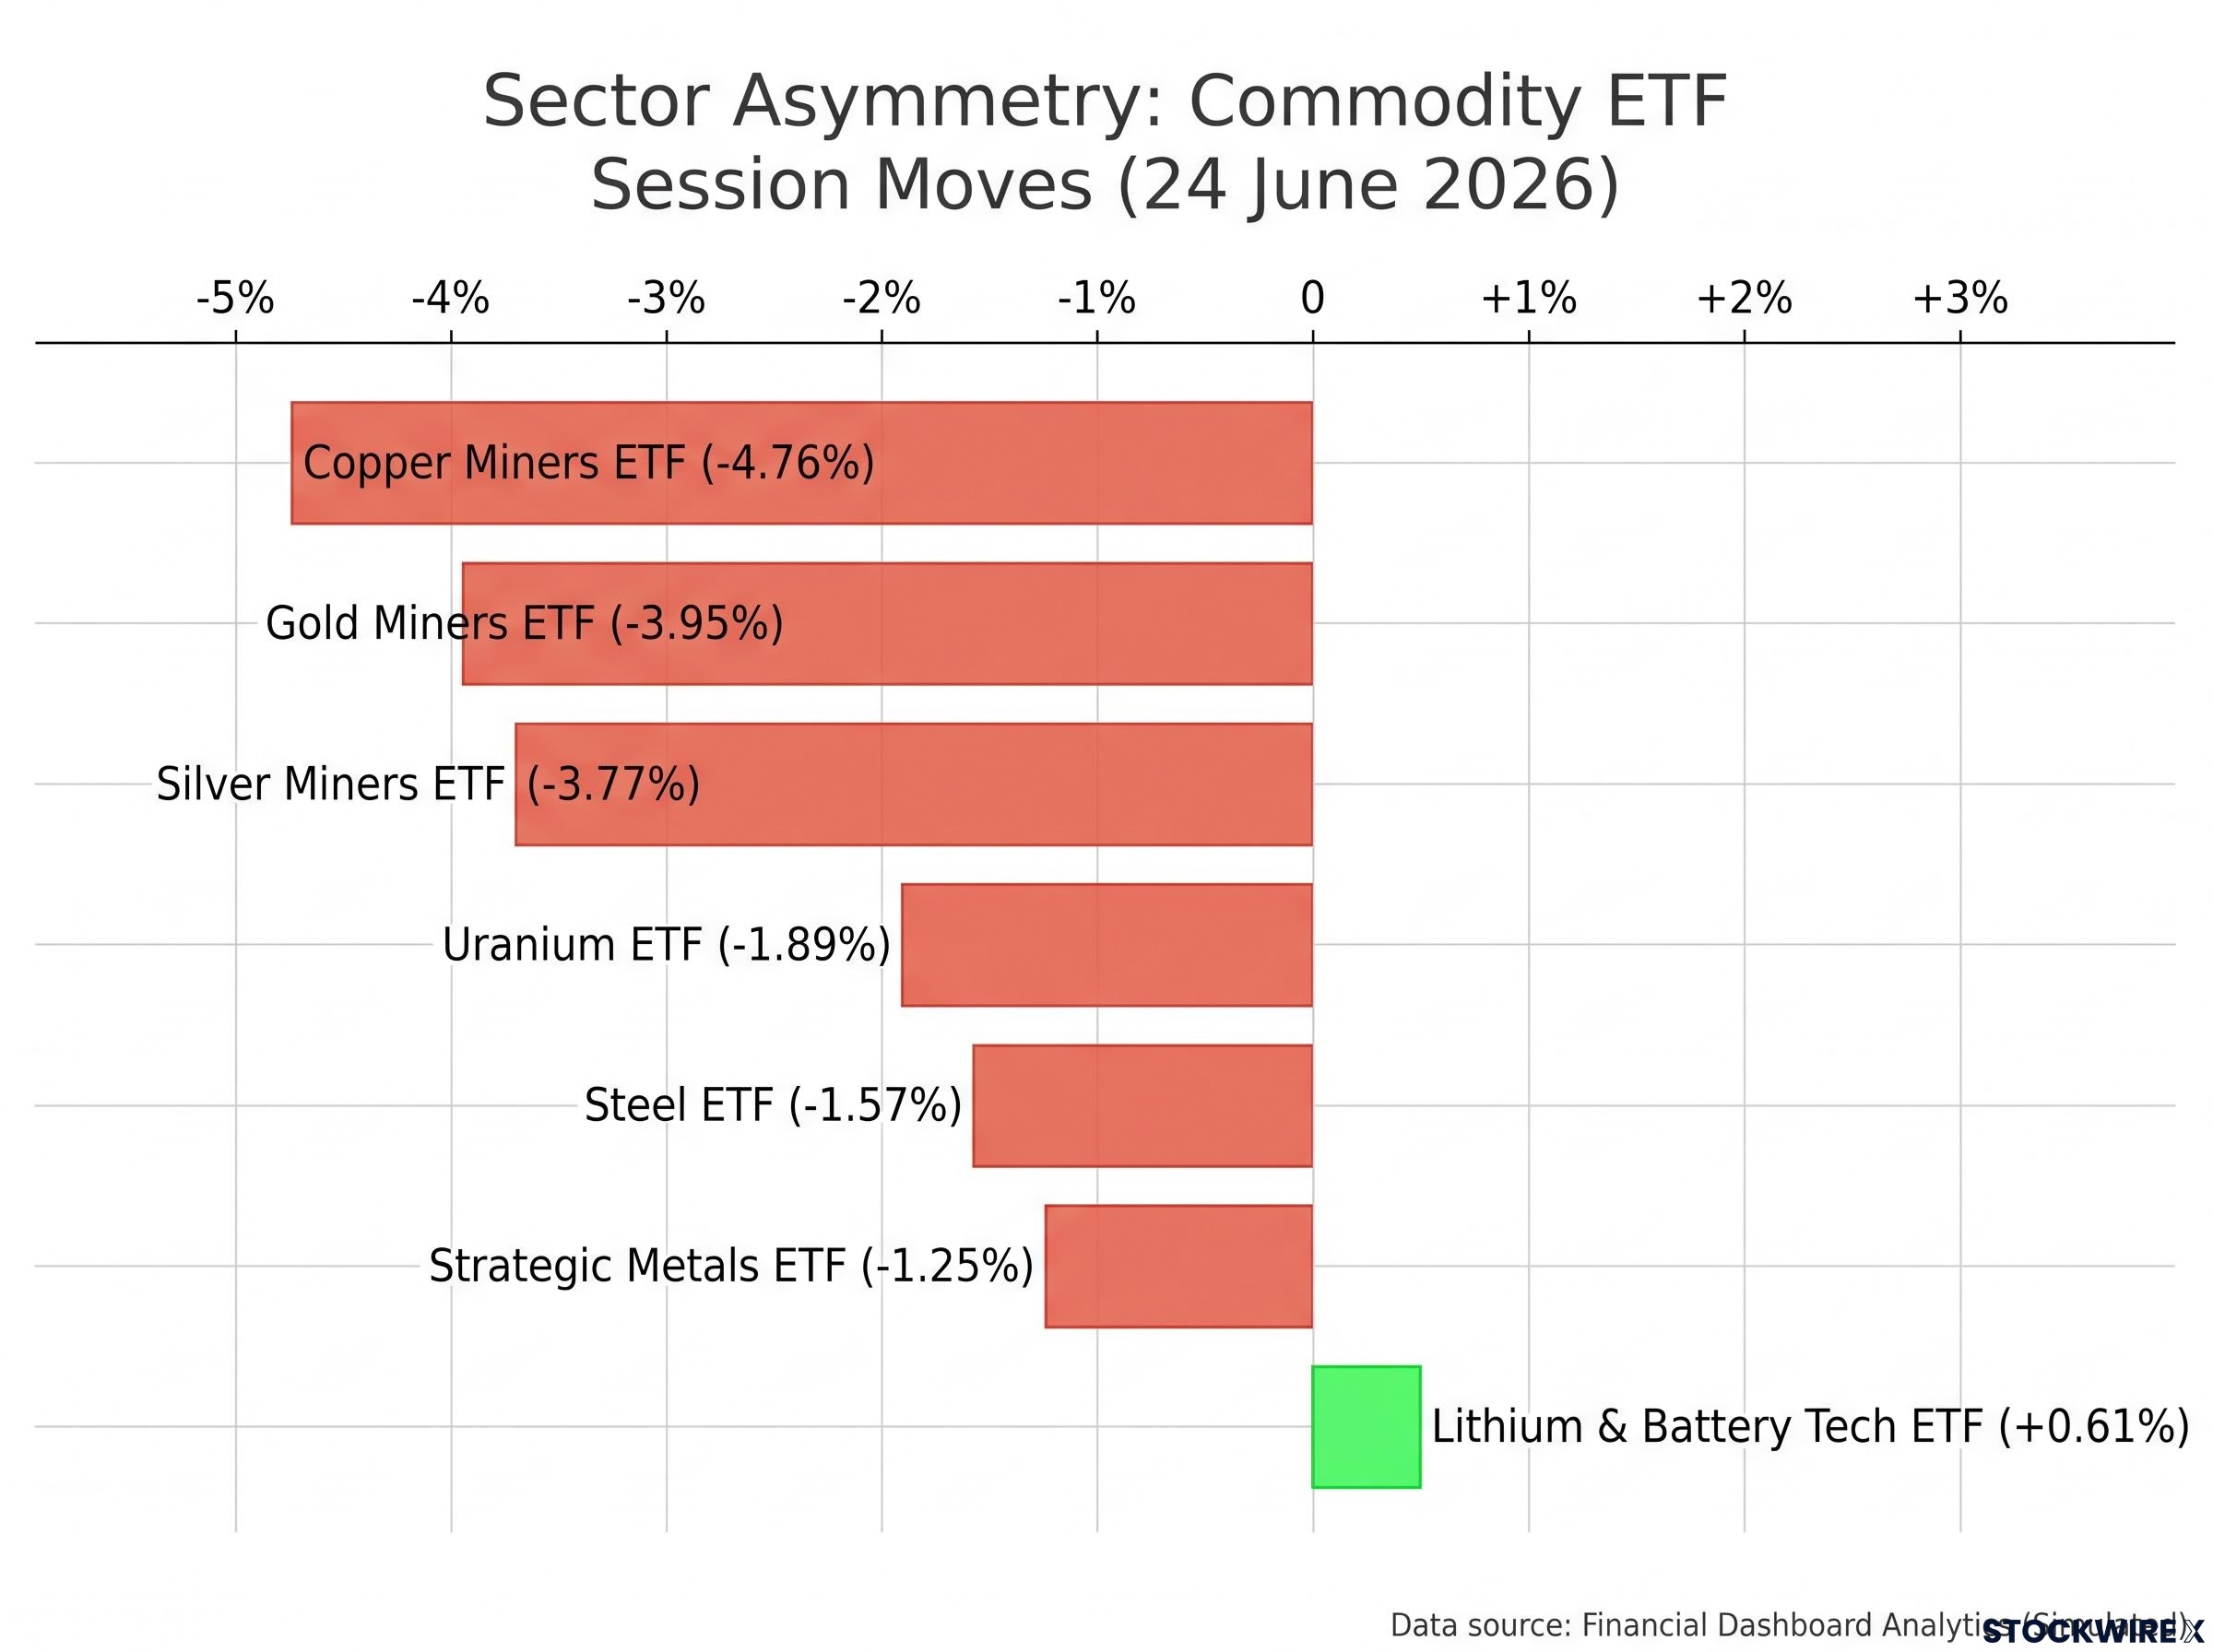
The damage was not distributed evenly. Among commodity ETFs on the session, the Copper Miners ETF recorded the steepest loss at 4.76%. The Gold Miners ETF gave back 3.95% and the Silver Miners ETF surrendered 3.77%. Standing apart from the losses, a single fund closed in the green: the Lithium and Battery Tech ETF, which added 0.61%.
| ETF | Session Move | Closing Level |
|---|---|---|
| Copper Miners ETF | -4.76% | 75.70 |
| Gold Miners ETF | -3.95% | 74.59 |
| Silver Miners ETF | -3.77% | 75.57 |
| Uranium ETF | -1.89% | 44.72 |
| Steel ETF | -1.57% | 100.18 |
| Strategic Metals ETF | -1.25% | 90.67 |
| Lithium & Battery Tech ETF | +0.61% | 78.91 |
The major equity read-throughs reinforced the pattern:
Then the other side of the ledger. The US Global Jets ETF climbed 4.1% on the session, with cheaper fuel costs flowing directly through to airline economics. With oil lower heading into the 25 June 2026 ASX open, Qantas and Virgin Australia were both identified as likely beneficiaries of the move.
One important caveat: while Brent closed at US$73.37, sitting 38% below its March high, it remains around 20% ahead of where it started the year. The fuel cost relief for airlines is real, but it is not a return to pre-2026 conditions.
The sector asymmetry is the actionable insight here. Mining-focused exposures are under acute near-term pressure. The only commodity-adjacent sector adding value in this environment is one that benefits from cheaper inputs, not cheaper outputs.
The transmission from falling commodity prices to headline CPI follows a sequential path:
A BCOM decline of 15.3% from its May peak represents a material disinflationary impulse at the headline level. For Australian consumers and businesses, the relief in energy and materials costs is real and will filter through to prices over the coming months.
The distinction that matters for policy is between headline and core inflation. The RBA has consistently communicated that it watches core inflation, particularly non-tradables and services, as its primary policy signal. A commodity selloff alone does not guarantee rate cuts if services inflation and wage growth remain elevated.
That is the analytical caveat investors need to hold alongside the headline relief. Falling oil prices help at the pump and in the CPI print. But the RBA will need to see the commodity price decline sustained and core services inflation easing before it materially alters its forward guidance.
If Iran-US talks stall or Hormuz transit is disrupted again, oil could recover rapidly, reversing the disinflationary signal. The commodity price decline is a welcome input to the RBA’s assessment, but it is not yet a rate-cut catalyst on its own.
The short-term damage to ASX-listed resource stocks is real. On NYSE-listed shares, BHP lost 1.8% and Rio Tinto gave back 1.6%, with the ASX open on 25 June 2026 widely expected to track those overnight moves. Energy producers and oil-field services names carry the most direct exposure to the Hormuz supply story. Base metals names, including copper and aluminium producers, are caught in the USD headwind as much as the geopolitical unwind.
At 4.76%, the Copper Miners ETF suffered the heaviest session loss across the entire commodity ETF universe, demonstrating how supply normalisation and dollar strength can reinforce each other within a single asset class.
Copper stockpile dynamics add a complicating layer to the session loss story: global exchange-held inventories exceeded 1 million tonnes in May 2026, a 20-year high driven partly by tariff-related front-loading in the US, meaning the 2.68% session decline reflects not only dollar headwinds but a market already pricing elevated near-term supply against uncertain downstream demand.
One data point from the session cuts against the prevailing narrative. The Lithium and Battery Tech ETF finished up 0.61%, the only commodity ETF in positive territory. That is not a coincidence. It signals that the market is distinguishing between commodities whose near-term price is set by geopolitics and macro cycles, and those whose long-term demand is driven by structural decarbonisation investment that neither diplomacy nor the Federal Reserve can redirect.
The structural demand thesis for copper in energy transition and lithium in battery storage has not changed because the Strait of Hormuz reopened. Those demand drivers operate on a different timeline entirely.
For investors wanting to assess whether the lithium exception seen in this session reflects a durable positioning shift rather than a one-day anomaly, our dedicated guide to ASX lithium’s structural demand thesis examines how battery energy storage systems have broadened lithium’s demand base beyond electric vehicles and reduced its sensitivity to macro and geopolitical cycles.
Two variables will determine whether the broader commodity selloff persists or reverses:
Australian investors with broad resource exposure need to understand which of their holdings are caught in this macro and geopolitical crossfire, and which are insulated by demand drivers that sit outside it.
The commodity selloff is not a single-cause event, and that matters for how you assess its durability. Two forces produced the decline: a supply-side geopolitical reversal (Hormuz reopening, Iranian barrels returning) and a macro demand-side headwind (strong USD, tighter Fed expectations). The selloff persists only if both tracks hold simultaneously.
The move from the US$119.50 March high down to a Brent close of US$73.37 represents a drawdown of 38%. Yet Brent has not collapsed to historic lows; it is running roughly 20% above where it opened the year. This is a partial reversion of a war premium, and that distinction matters enormously for how much further the selloff can run on current drivers.
Four variables to watch from here:
The Australian resource sector is not in a single narrative. Energy producers face a different set of drivers than lithium and battery metals names. Positions need to be assessed against the specific force repricing each commodity, not against a blanket “commodities are falling” thesis.
This article is for informational purposes only and should not be considered financial advice. Investors should conduct their own research and consult with financial professionals before making investment decisions. Past performance does not guarantee future results. Financial projections are subject to market conditions and various risk factors.
Three forces converged simultaneously: the Strait of Hormuz reopened with oil flows running at around 4.8 million barrels per day, US-Iran nuclear negotiations advanced with a waiver enabling purchases of already-loaded Iranian oil, and the US dollar index hit a 13-month high, suppressing USD-denominated commodity prices across the entire complex.
Brent crude fell 38% from its March 2026 peak of US$119.50 per barrel to US$73.37 on 24 June 2026, a collapse that took just 107 days and reflected the rapid unwinding of the war premium built into global energy markets after the Strait of Hormuz disruption.
BHP lost 1.8% and Rio Tinto shed 1.6% on NYSE-listed shares on 24 June 2026, with the ASX open on 25 June expected to track those moves; energy producers and base metals names like copper and aluminium carry the most direct near-term exposure, while the Lithium and Battery Tech ETF was the only commodity ETF to close in positive territory, up 0.61%.
A 15.3% decline in the Bloomberg Commodity Index from its May 2026 peak delivers a real disinflationary impulse at the headline level, but the RBA watches core inflation, particularly non-tradables and services, as its primary policy signal, meaning the commodity price decline alone is not yet a rate-cut catalyst unless services inflation and wage growth also ease.
The Strait of Hormuz is the world's most critical oil shipping chokepoint; at peak disruption it had nearly 10.8 million barrels per day shut in, equivalent to roughly 80% of total US crude output removed from global supply, which is why its reopening with flows resuming at around 4.8 million barrels per day drove one of the fastest oil price collapses in recent memory.