
Barclays Flags Structural Bond Reset With 4.65% Yield Call
1 hr ago

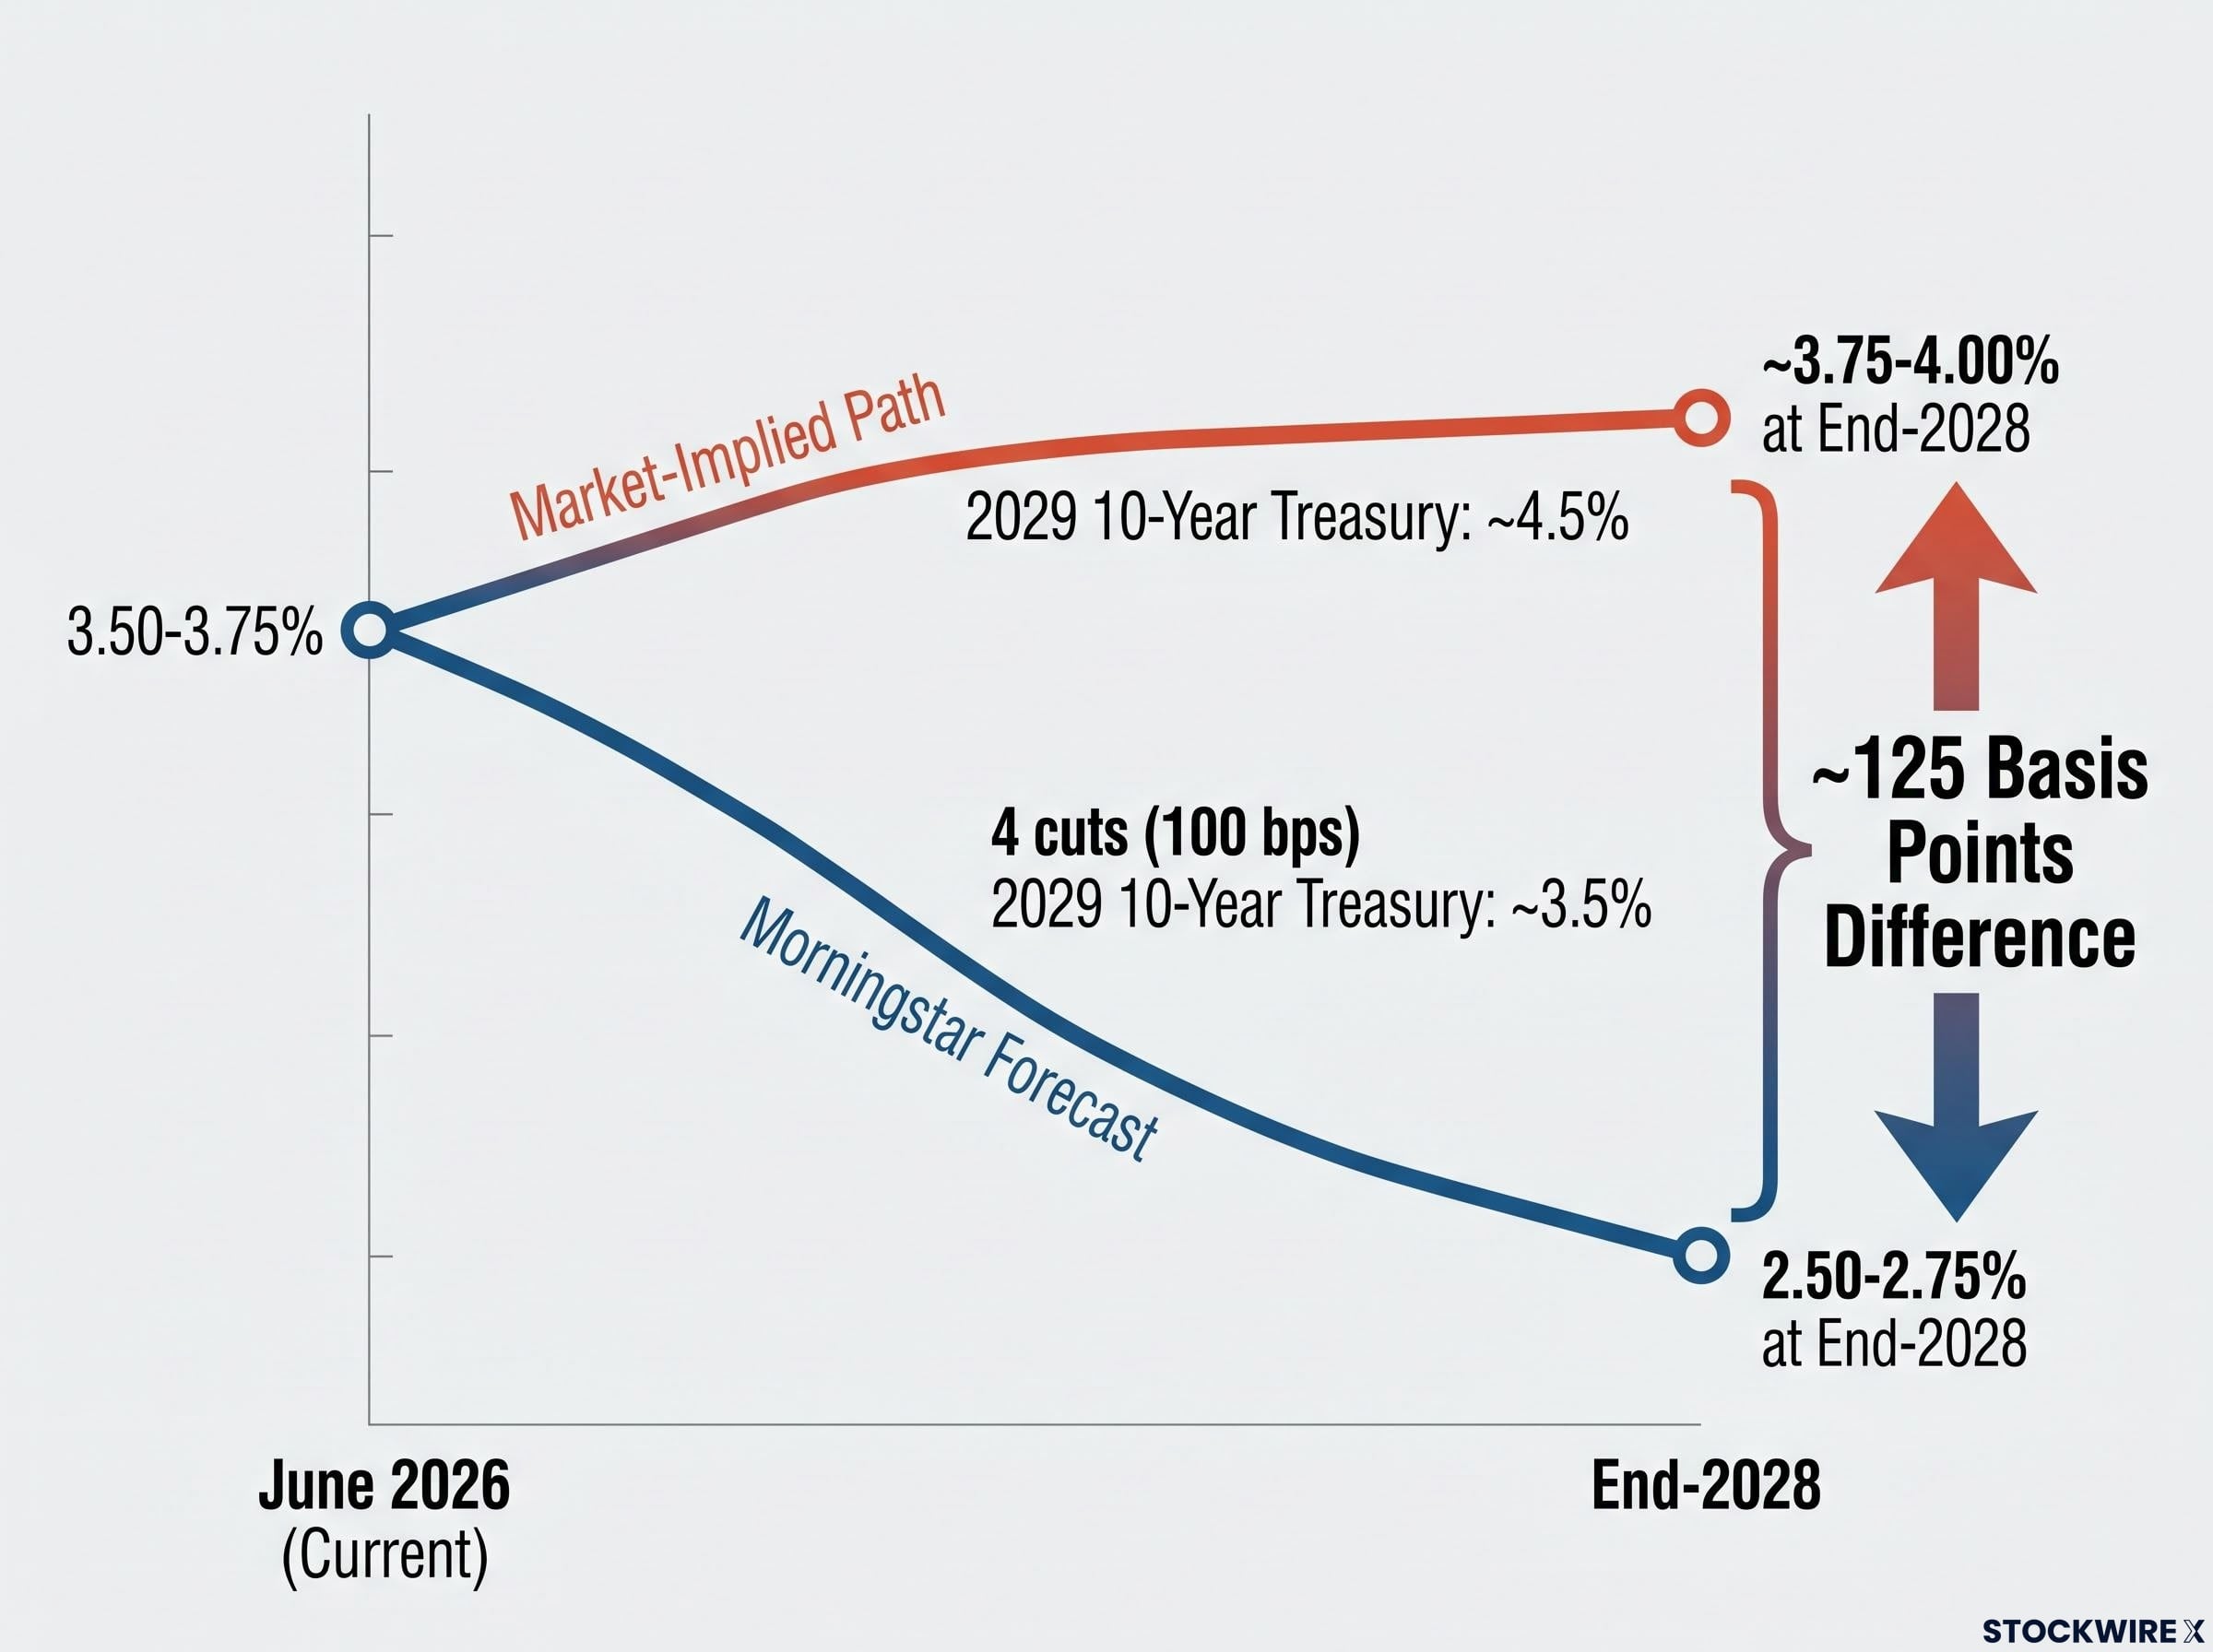
Futures markets and Morningstar’s own forecast are pointing to two radically different versions of where the US economy is heading over the next three years. The gap between them is not a rounding error. It is approximately 125 basis points of difference in the projected federal funds rate by end-2028, and the asset class implications of being on the wrong side of that divergence are material.
Preston Caldwell, Morningstar’s Senior US Economist, published a comprehensive forecast on 25 June 2026 projecting slower GDP growth, a temporary inflation surge driven by an Iran-related energy shock, and four Federal Reserve rate cuts totalling 100 basis points across 2027-2028. The current backdrop tells a more complicated story: CPI hit 4.2% year-over-year in May 2026, the Fed is holding steady at 3.50-3.75%, and futures markets are pricing something materially different from the easing path Morningstar expects.
Here is a breakdown of each pillar of the Morningstar forecast, what the data actually supports, and what it means for portfolio positioning across bonds, rate-sensitive equities, and the AI narrative through the end of the decade.
The forces dragging on US growth are neither subtle nor speculative. They are identifiable, measurable, and already showing up in the data. US real GDP grew 2.1% for full-year 2025, according to Bureau of Economic Analysis data, down from the 2022-2024 average of approximately 2.8%. Growth has continued to moderate into 2026, with quarterly readings reflecting a steady loss of momentum.
US real GDP growth decelerated from approximately 2.8% (2022-2024 average) to 2.1% in 2025, a 0.7 percentage point compression that Morningstar expects to persist through the mid-decade.
Three structural headwinds are compressing growth simultaneously:
AI-related capital expenditure has provided a partial offset, but it is a narrowing one. Private fixed investment outside the AI-related technology segment has been in contraction since 2025, which means the overall investment backdrop is considerably weaker than the AI-driven headlines imply.
The GDP data behind the slowdown narrative tells a more fractured story than the headline rate implies: AI-driven business investment surged at 10.4% annualised in Q1 2026, its fastest pace since mid-2023, while consumer spending decelerated to 1.6% annualised and residential investment contracted for the seventh time in eight quarters.
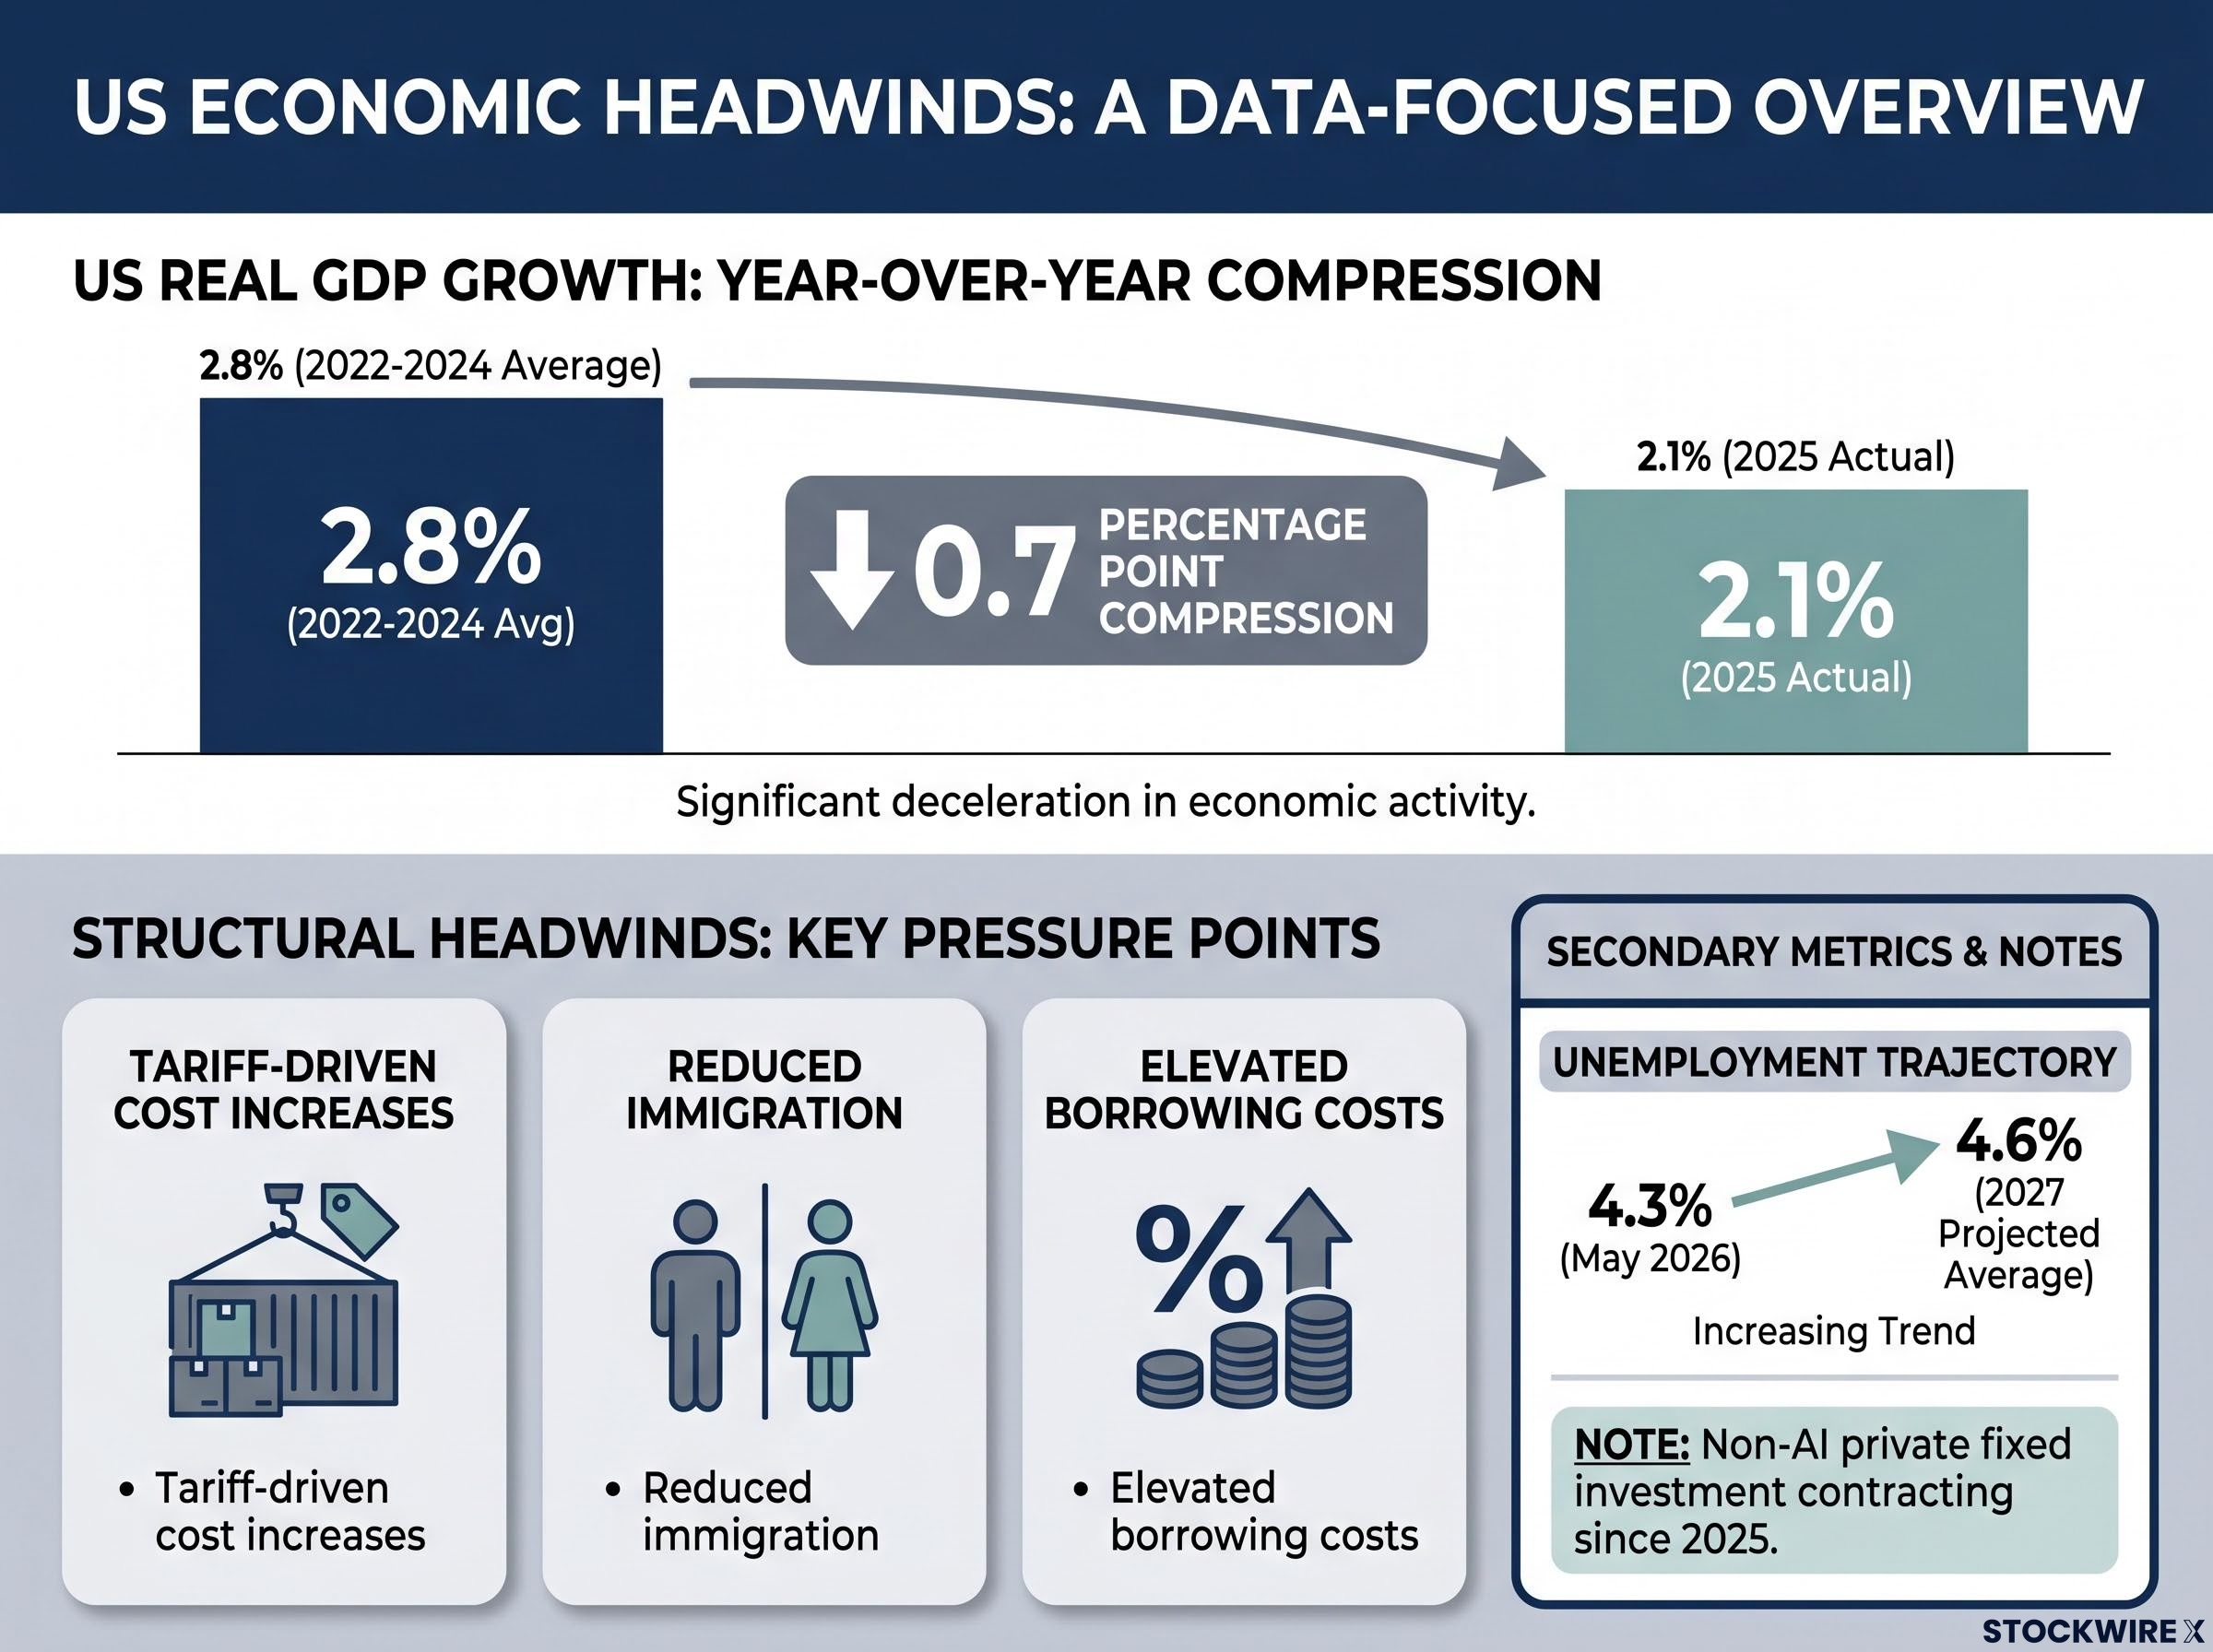
The labour market tells the same story in softer terms. Unemployment held at 4.3% through May 2026 and is projected to drift to a 4.6% average in 2027. That 0.4 percentage point rise over roughly two years is not alarming on its own; it is not the kind of spike associated with recessions. But it confirms that the labour market is absorbing the same headwinds compressing GDP rather than remaining immune to them. The Morningstar base case is a soft landing, and the difference between that and a recession changes how aggressively you should consider reducing cyclical exposure.
Two inflation readings currently sit side by side, and they tell different stories. Morningstar’s 2026 full-year baseline forecast projected CPI at approximately 3.4%. The actual May 2026 reading from the Bureau of Labor Statistics came in at 4.2% year-over-year.
| Indicator | 2025 Actual | 2026 Actual (May) | 2026 Morningstar Baseline |
|---|---|---|---|
| CPI (year-over-year) | 2.6% | 4.2% | ~3.4% |
| Tariff contribution | ~0.2 pp | Dissipating | Dissipating |
| Iran energy shock contribution | N/A | Elevated | ~0.6 pp |
The context matters. Through 2025, CPI remained steady at 2.6%, with tariffs pushing core goods prices up by around 0.2 percentage points. The disinflationary trend had already stalled before the energy shock arrived. That stall is what makes the 2026 spike harder to dismiss.
The causal chain is direct. Iran-related conflict drove oil prices higher. Energy prices feed into headline CPI with minimal lag. Meanwhile, the shelter component is adding additional stickiness as the rent-to-CPI transmission delay works through the system.
Morningstar’s forecast attributes approximately 0.6 percentage points of the 2026 inflation reading to the energy shock alone. That figure is the cleanest indicator of whether this inflation episode is temporary (energy prices normalise as the geopolitical situation stabilises) or the beginning of something stickier (the shock persists or broadens into services and wages).
The gap between 3.4% and 4.2% matters because it signals that inflation is running hotter than even Morningstar’s elevated baseline anticipated. Whether the “temporary” framing holds is the single variable most likely to determine whether the rate-cut forecast proves correct, and it is not yet resolved in the data.
The Federal Reserve’s current stance is clear: the federal funds target range sits at 3.50-3.75% as of the June 2026 FOMC meeting, and no cuts have been delivered this year. That outcome is consistent with Morningstar’s baseline, which anticipated no easing in 2026.
The reason is mechanical, not ideological. When inflation runs above target and the primary driver is a supply shock (in this case, energy), the Fed faces a specific problem. Cutting rates would not fix the supply issue; oil prices are not falling because the federal funds rate drops 25 basis points. But easing while inflation is elevated risks unanchoring inflation expectations, the beliefs consumers and businesses hold about where prices are heading. Once those expectations drift higher, they become self-fulfilling through wage demands and pricing behaviour. That credibility risk keeps the Fed pinned in place even when growth is slowing.
Warsh’s June press conference introduced a further layer of uncertainty: the incoming Chair has publicly opposed detailed forward guidance and prefers trimmed mean PCE as his inflation scorecard, which means the market’s habit of reading dot-plot signals as a rate-path commitment may systematically misread the new regime at the Fed.
Morningstar projects the constraint lifts as the energy shock fades and inflation returns toward target. The forward path calls for four cuts of 25 basis points each:
Under Morningstar’s forecast, the federal funds rate ends 2028 at a target range of 2.50-2.75%, representing a cumulative 100 basis point reduction from the current 3.50-3.75% level.
For you, the current hold is not a signal that rates stay elevated indefinitely. It is a function of an inflation reading the Fed cannot ignore right now. The Morningstar forecast argues this constraint lifts by 2027, and when it does, the rate path is the single most powerful input for bond valuations, mortgage rates, and equity multiples in rate-sensitive sectors.
Here is where the analysis sharpens into something directly consequential for positioning. Futures markets are pricing limited near-term easing, with some implied probability of rate hikes in 2027 followed by a plateau. Morningstar projects four cuts to 2.50-2.75%. The difference at end-2028 is approximately 125 basis points.
CME FedWatch futures pricing is the most widely followed real-time gauge of market expectations for Fed policy, and it is this pricing that currently implies a materially higher rate path through end-2028 than Morningstar’s four-cut baseline.
Approximately 125 basis points separates Morningstar’s projected rate path from current market pricing at end-2028. One view is likely to prove significantly wrong.
| Scenario | 2027 Projected Rate | End-2028 Target Range | 10-Year Treasury Yield (2029) |
|---|---|---|---|
| Morningstar Forecast | Easing begins (two cuts) | 2.50-2.75% | ~3.5% |
| Market-Implied Path | Stable or modestly firming | ~3.75-4.00% | ~4.5% (current level persists) |
The market’s implied path assumes one of two things: that inflation proves stickier than Morningstar expects, or that growth proves more resilient, giving the Fed reason to hold or tighten rather than ease. Both are plausible readings of the same data.
At roughly 4.5% today, the 10-year Treasury yield is where this rate divergence becomes visible in bond markets. Morningstar’s view is that it declines to around 3.5% by 2029, a 100 basis point compression that would reward duration holders with capital gains while reducing borrowing costs across the broader economy.
This is not a technical detail for fixed-income specialists. It is the distance between a world where duration pays off and a world where it continues to punish. Your current allocation implicitly reflects a bet on one of these scenarios, whether or not you have made that bet deliberately.
The rate path debate translates into three concrete asset class implications:
The near-term risk window is important. The 2026-2027 period combines a Fed on hold, drifting unemployment, the Iran energy shock, and weak non-AI investment. That combination argues for caution toward cyclical risk assets in the short term, even as the medium-term outlook for 2028-2029 improves.
The near-term equity risk window extends beyond rate uncertainty: S&P 500 earnings growth is projected to decelerate from 29.3% in Q1 2026 to 22.9% in Q2 2026, a six-percentage-point drop in a single quarter that in a stretched-valuation environment reads as directional deterioration rather than healthy normalisation, compounding the caution case for cyclical exposure.
Morningstar treats AI-driven productivity gains as a later-decade phenomenon, not a near-term offset to the cyclical headwinds from tariffs, demographics, and tight monetary policy. Non-AI private fixed investment has been contracting since 2025, which tells you the AI capex story is not lifting broad investment conditions. It is lifting a concentrated subset of them while the rest of the economy absorbs the drag.
That distinction matters if you are positioned for AI spending to carry the broader market through a soft patch. It may carry specific names. It is unlikely to carry the index.
Rather than declaring a verdict on who is right, the more useful exercise is identifying the specific signals that will tell you the answer as they arrive in the data over the next 12-18 months.
By end-2028, Morningstar’s projected rate path sits approximately 125 basis points below current market pricing. One view is likely to prove significantly wrong.
You do not need certainty about which scenario is correct. You need to know which data releases will tell you the answer first, so you can adjust positioning before markets have fully re-priced.
The full Morningstar rate path runs as follows: the Fed holds through 2026, delivers four cuts across 2027-2028, and 10-year yields fall from approximately 4.5% to approximately 3.5% by 2029. If that forecast proves accurate, the next 24-36 months reward investors who moved into duration and rate-sensitive sectors before the cuts were priced in, not after.
Two scenarios, two positioning implications:
The timing asymmetry is what makes the positioning question urgent. The 2026-2027 window is both the period of maximum near-term risk (energy shock, Fed on hold, slowing growth) and the period when entry prices for the eventual recovery trade are likely to be most attractive. The three monitoring variables from the preceding section, inflation persistence, Fed responsiveness, and AI productivity timing, are the mechanism for updating your view as the data arrives.
Your positioning decision should not wait for the Fed to confirm the first cut. By then, duration will have already rallied and rate-sensitive equity multiples will have expanded. The late mover gets a less favourable entry.
For investors who want to stress-test their overall portfolio architecture against the two rate scenarios this article lays out, our deep-dive into 60/40 portfolio assumptions examines how the 2022 stock-bond correlation breakdown exposed a structural flaw that remains relevant in any supply-shock inflation environment.
This article is for informational purposes only and should not be considered financial advice. Investors should conduct their own research and consult with financial professionals before making investment decisions. Past performance does not guarantee future results. Financial projections are subject to market conditions and various risk factors.
Morningstar projects slower GDP growth, a temporary inflation spike driven by an Iran-related energy shock, and four Federal Reserve rate cuts of 25 basis points each across 2027-2028, bringing the federal funds target range to 2.50-2.75% by end-2028.
The Fed is holding the federal funds rate at 3.50-3.75% because cutting while CPI is running at 4.2% year-over-year risks unanchoring inflation expectations, a credibility problem that supply-side energy shocks cannot be solved by lowering borrowing costs.
Morningstar forecasts the federal funds rate ending 2028 at 2.50-2.75%, while futures markets are pricing a path around 3.75-4.00%, a divergence of approximately 125 basis points that carries material implications for bond valuations and rate-sensitive equity multiples.
If Morningstar's forecast proves correct and 10-year Treasury yields fall from roughly 4.5% to 3.5% by 2029, duration holders capture both income and capital gains; if markets are right and rates stay elevated, duration continues to punish.
The three watchpoints are inflation persistence (whether CPI returns toward target as the Iran energy shock fades), Fed responsiveness (how quickly the Fed acts as unemployment drifts toward 4.6%), and AI productivity timing (when AI-driven gains actually register in economic data).


