Why Governance and Communication Drive Post-IPO Value
3 hrs ago
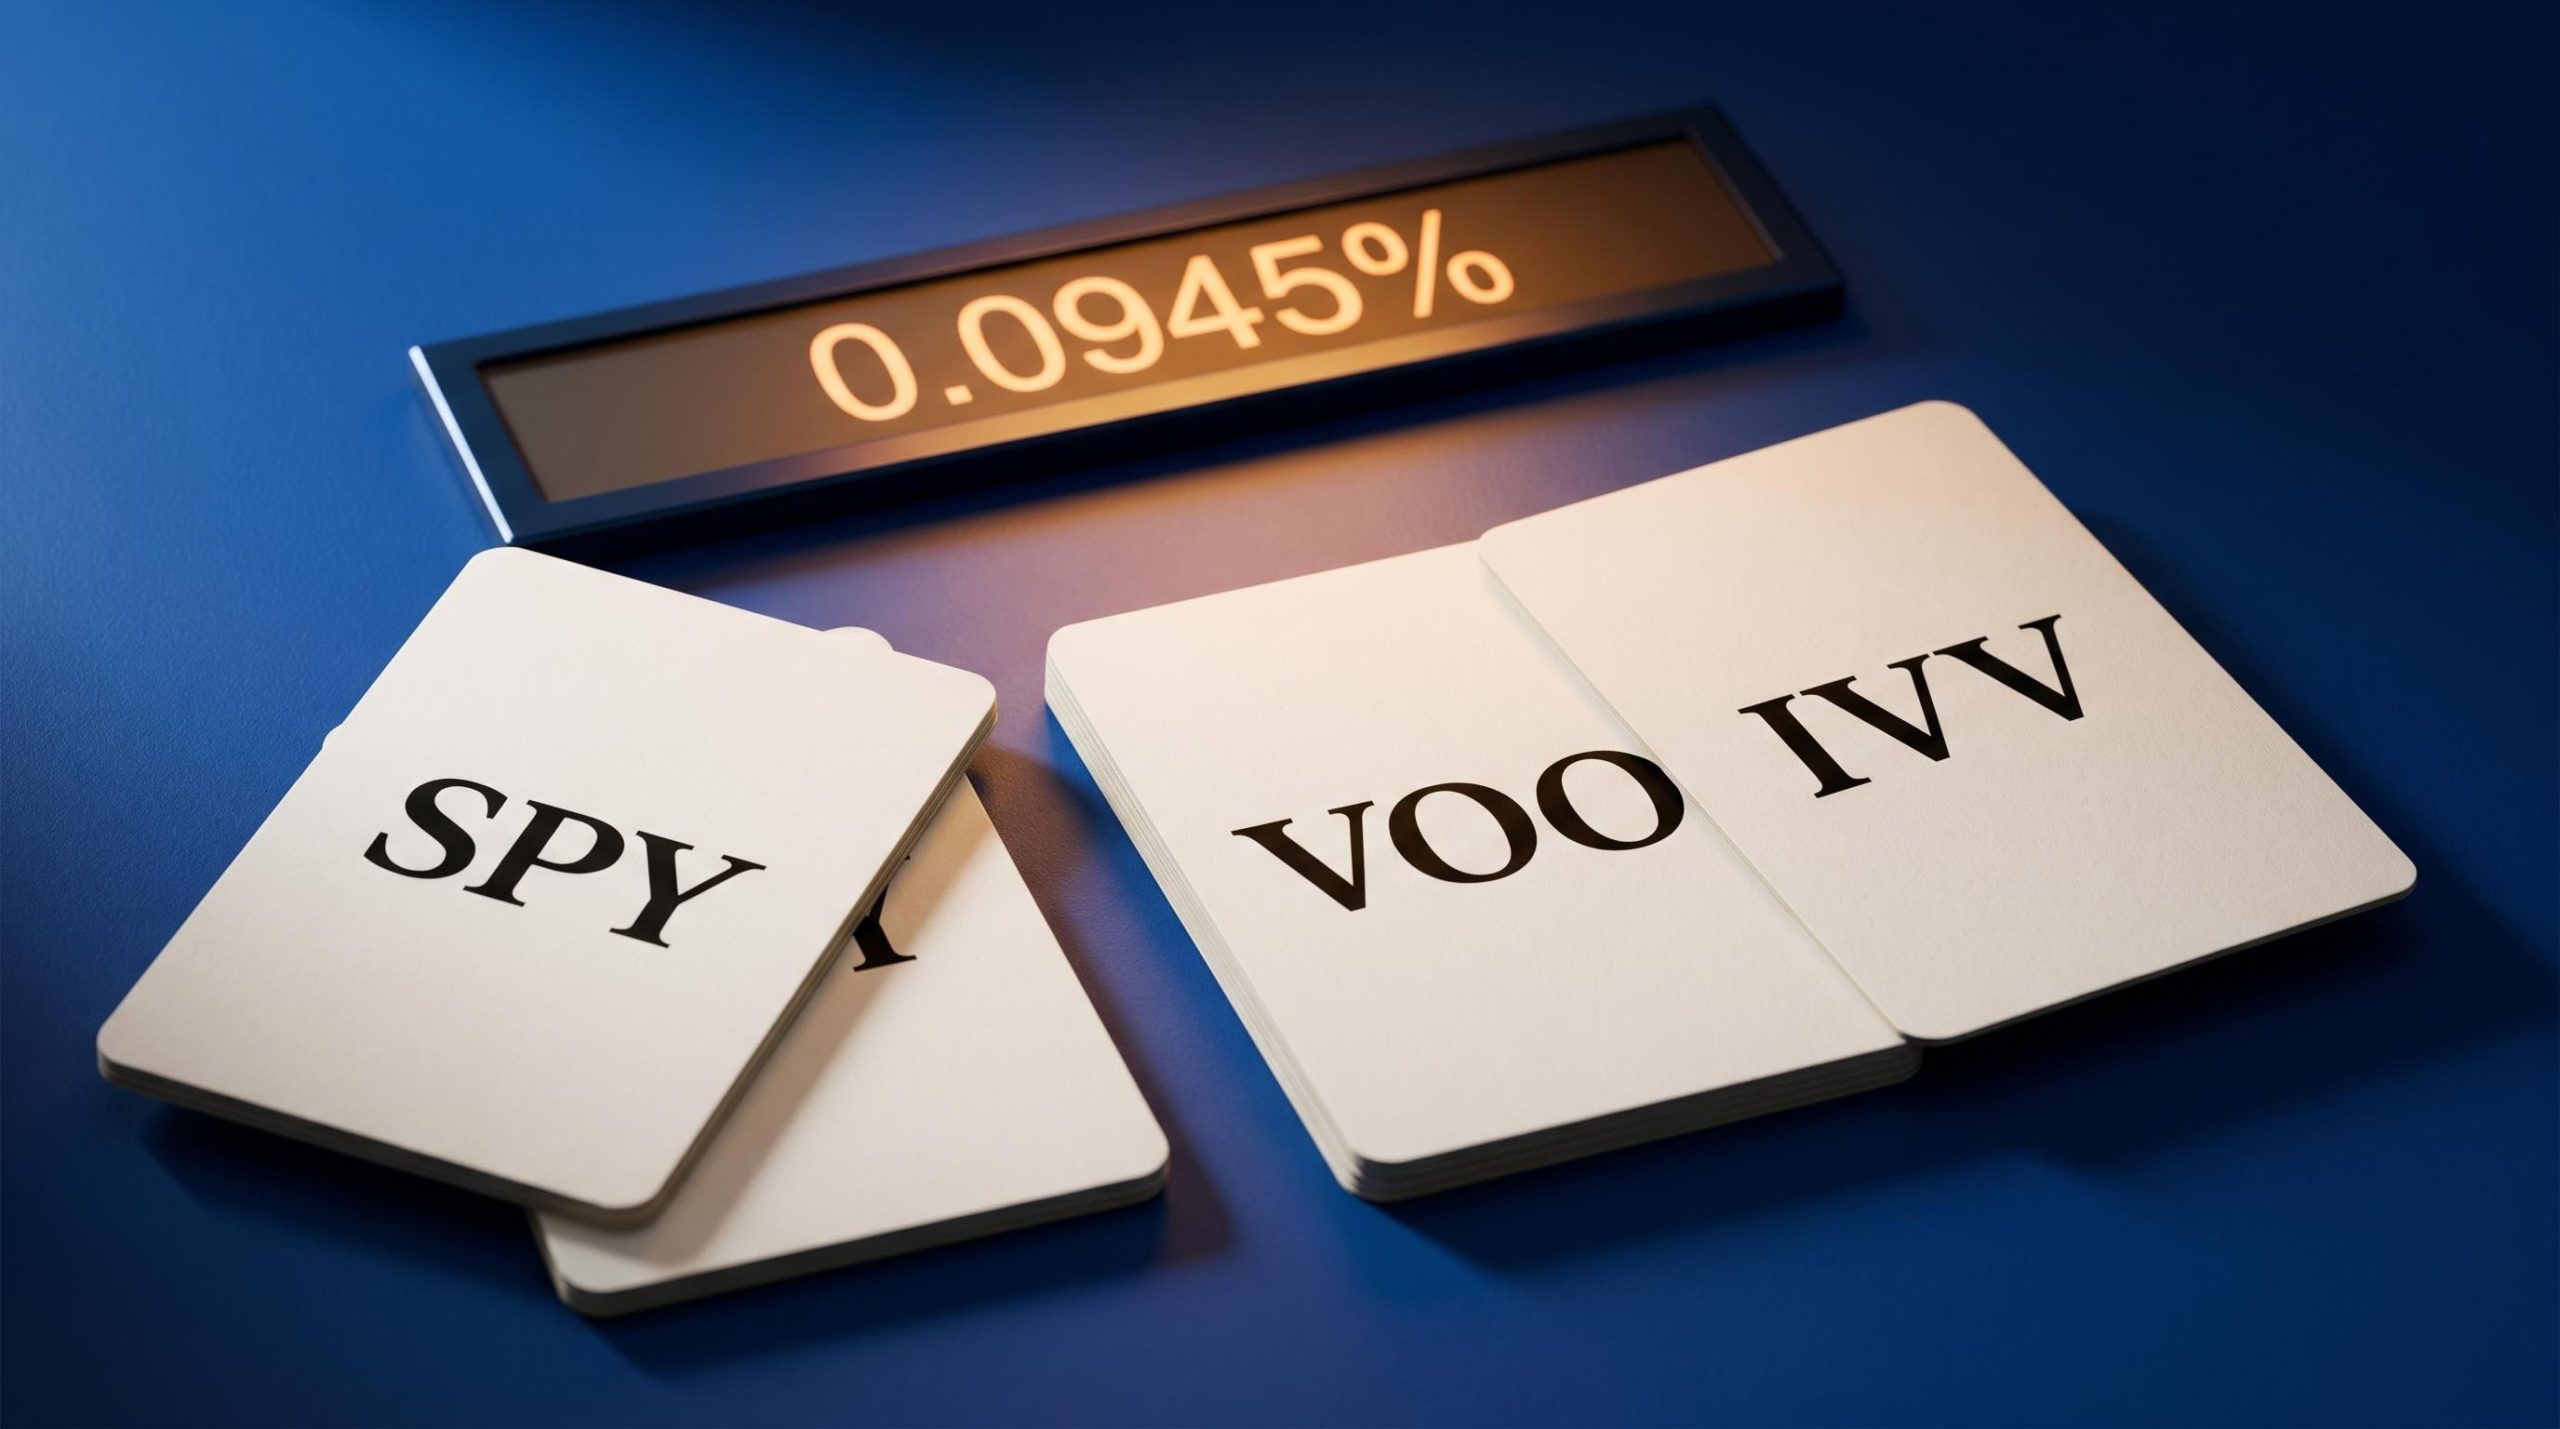
Looking at the cheapest fund on paper can leave you thousands of dollars behind a seemingly identical alternative over a long holding period. Three funds covering precisely the same S&P 500 benchmark illustrate the point: SPY carries an annual charge of 0.0945%, whereas VOO and IVV both sit at 0.03%. The resulting gap of around 0.0645 percentage points appears trivial in isolation. Stretched across three decades on a $100,000 position growing at 8% annually, however, it accumulates into a sum that runs into the thousands. Same index. Same exposure. Materially different outcome.
Fee compounding over time is non-linear: the same 0.9 percentage point annual difference that looks minor in year one has been shown to erase close to $100,000 from a $100,000 starting position over a 20-year horizon, with no market downturn required to produce that outcome.
The ETF market now offers hundreds of funds covering identical or near-identical benchmarks, which means selecting the right one has become a genuine skill with real return consequences. You already invest. You are here because you suspect the way you compare funds is not rigorous enough. That suspicion is well-placed. What follows gives you a structured framework, eight steps and a comparison worksheet, that accounts for every meaningful cost and quality dimension. Not just the expense ratio printed on the fund card.
The total expense ratio (TER) is a yearly charge drawn from your fund’s assets to cover the ongoing cost of running it, applied irrespective of how the fund performs. It encompasses portfolio management, legal fees, index licensing, and custody costs. Most investors treat it as the complete cost picture. It is not. The TER is the cost floor, not the ceiling.
The SEC investor bulletin on ETF fees and expenses sets out exactly what must appear in a fund’s prospectus fee table, including the management fee, 12b-1 fees, and other operating expenses, giving you a regulatory baseline for verifying that the expense ratio you read on a fund card is the complete figure rather than a selectively presented one.
Your total cost of owning an ETF breaks into three layers:
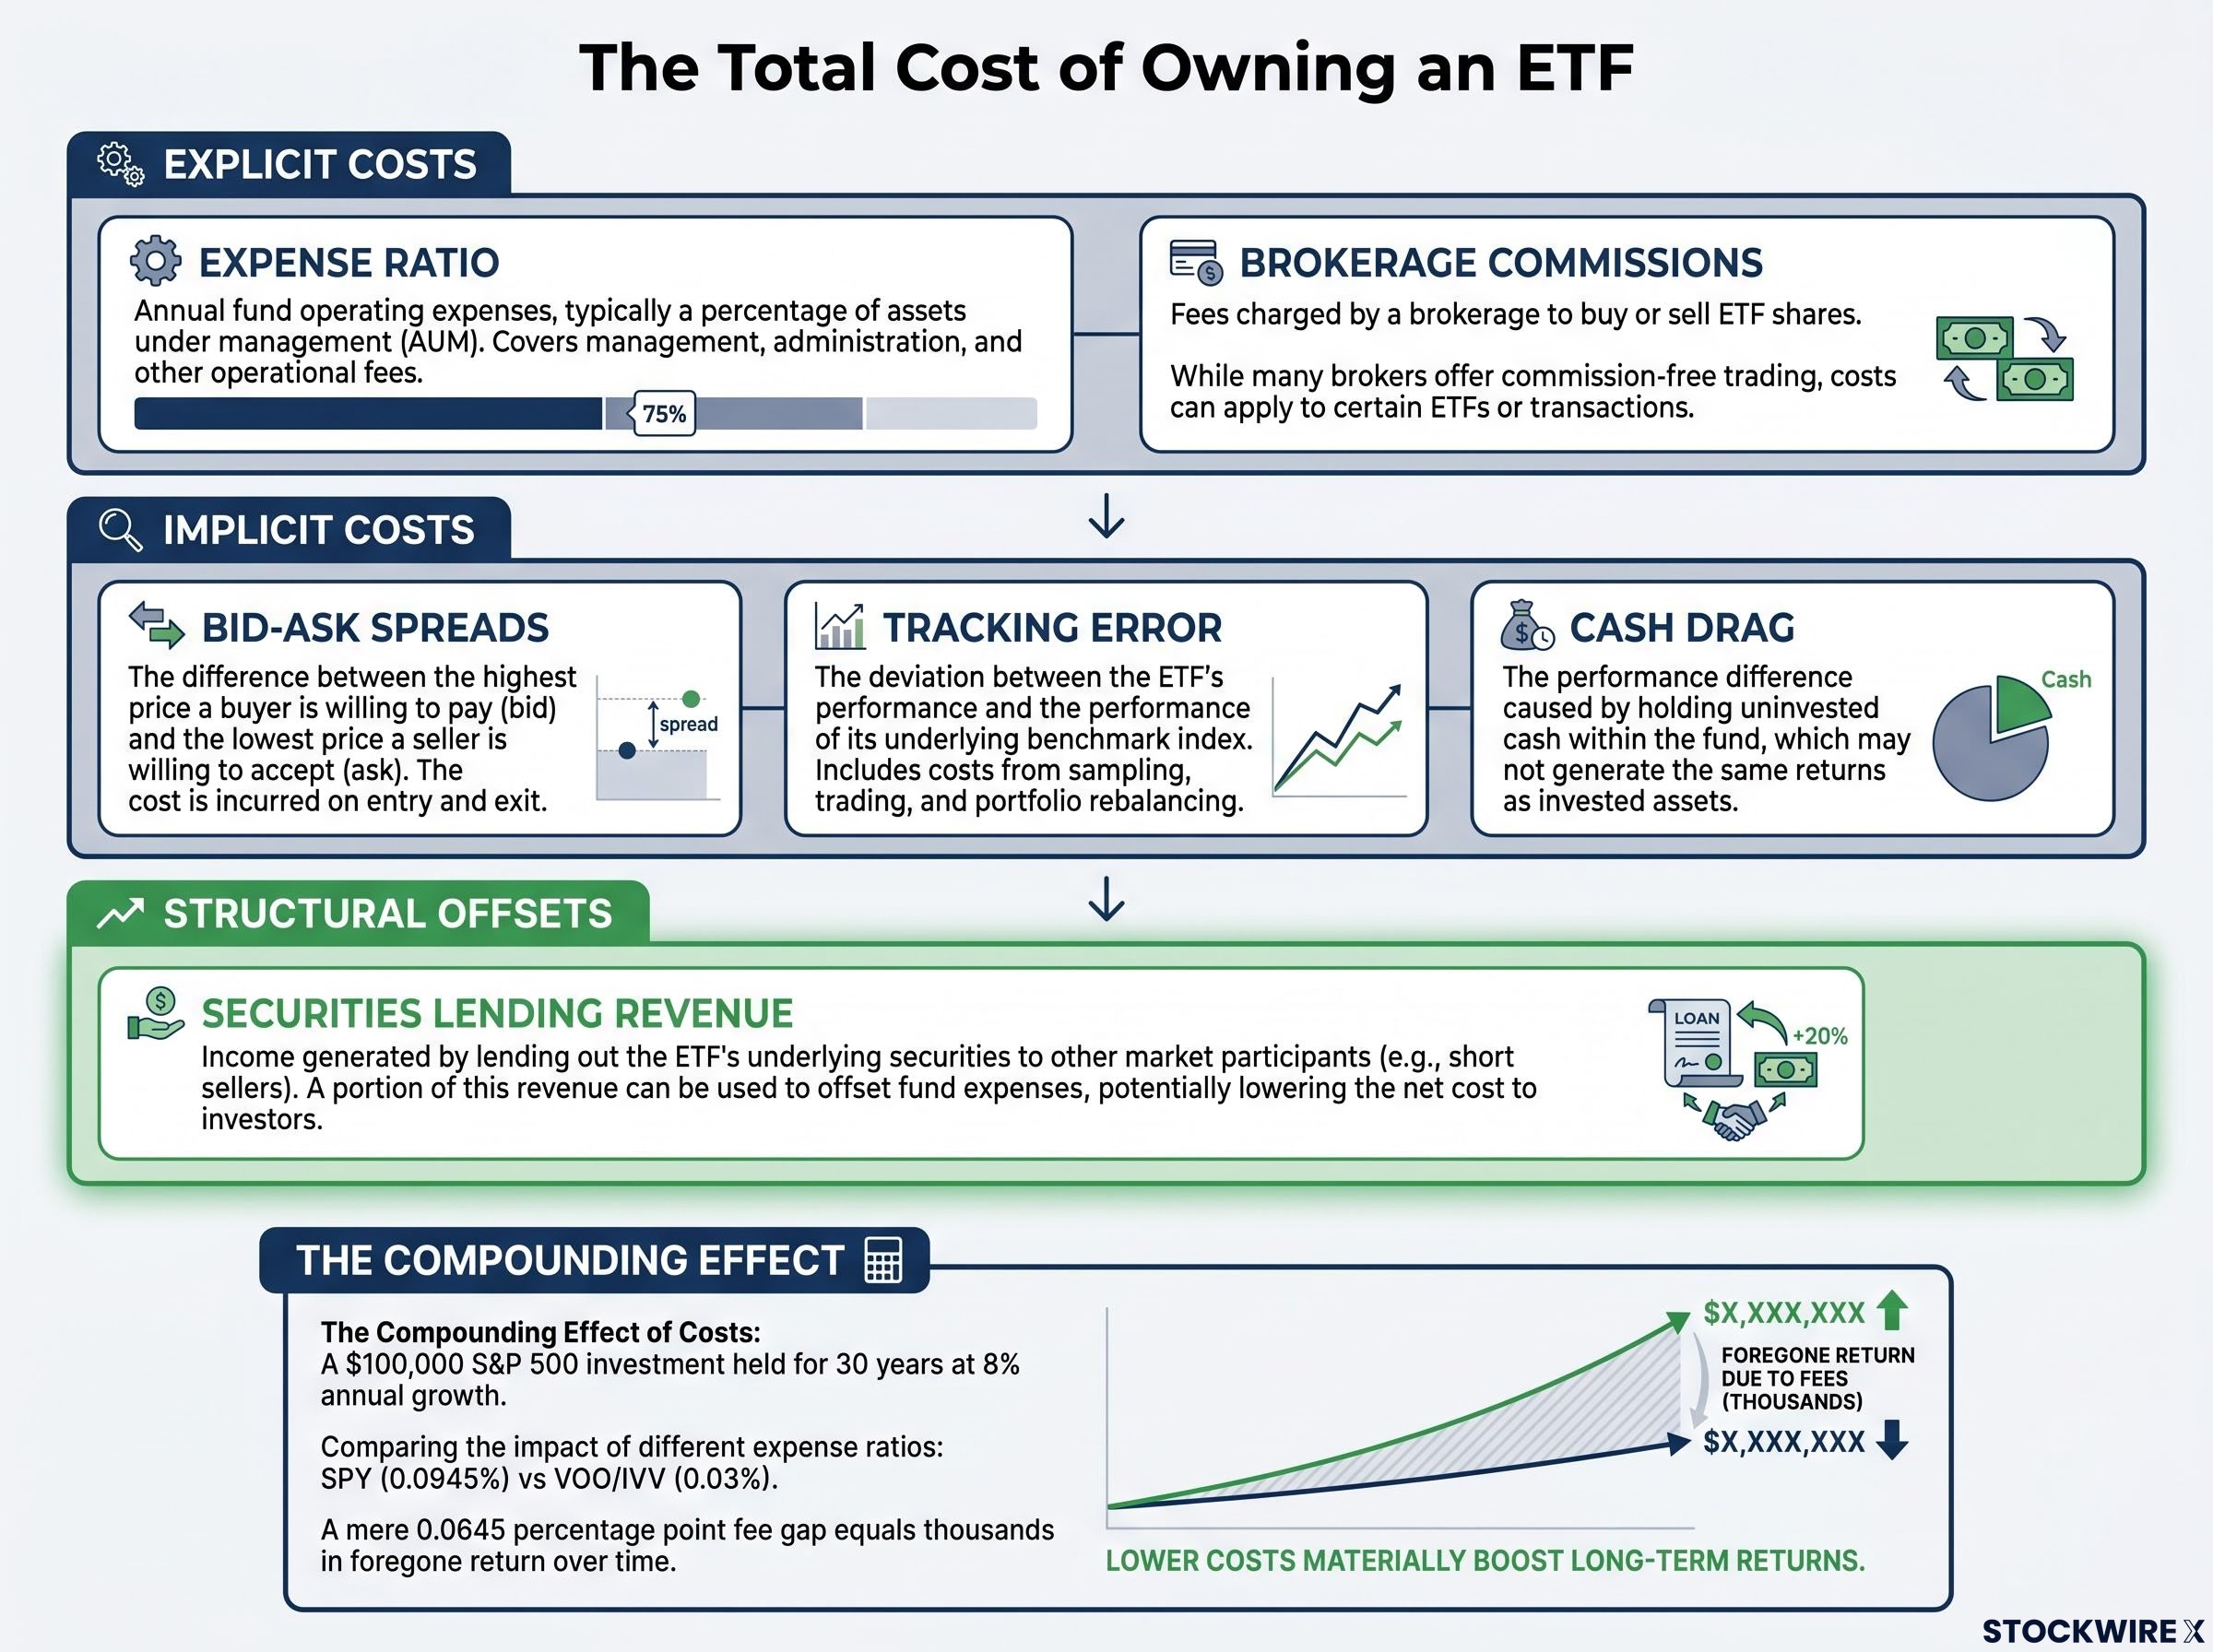
Applying a $100,000 S&P 500 investment held for 30 years at 8% annual growth, the 0.0645 percentage point fee gap between SPY and VOO/IVV builds over time into thousands of dollars of foregone return, even though all three funds deliver precisely the same underlying index exposure.
That example is not really about those three funds. It is proof that stopping at the expense ratio leaves a meaningful cost gap completely unexamined. The rest of this framework drills into each layer so you can close that gap.
Every time you buy or sell an ETF, you pay an implicit transaction cost: the bid-ask spread. The buyer pays the ask price; the seller receives the bid. The difference between those two prices, expressed as a percentage of the midpoint, is money that leaves your pocket on every trade.
Spread % = (Ask − Bid) / Midpoint × 100
The width of that spread depends almost entirely on how actively the fund trades:
If average daily volume is measured only in the low thousands of shares, that is a flag. Run the spread calculation explicitly before committing capital. And check spreads during normal market hours, avoiding the first and last 15 minutes of the trading day when temporary widening is common.
Here is the holding-period rule that determines how much weight to give this cost. The spread is paid once on purchase and once on sale. A 0.10% round-trip spread on a position held for 20 years works out to half a basis point per year, essentially rounding error. The same spread on a position turned over monthly accumulates into a drag that overwhelms any expense ratio advantage. If you plan to buy and hold for 15-plus years in a fund trading millions of shares daily, you can largely deprioritise spreads. If you rebalance quarterly, run the calculation, because it will compound into a cost that expense ratio comparisons alone will never reveal.
Morningstar’s analysis of total ETF ownership costs identifies sampling techniques, trading timing, cash drag, and rebalancing friction as the principal factors that erode fund performance beyond the stated expense ratio, reinforcing why a single-metric comparison leaves a material portion of your real cost unexamined.
Two metrics together tell you how well an ETF actually delivers the index return it promises. You need both. Neither alone is sufficient.
Tracking difference (TD) is the ETF’s return minus the index return, measured over 1-, 3-, and 5-year periods. A negative tracking difference means the fund lagged its benchmark. A slightly positive one can reflect strong securities lending income more than offsetting costs. This metric tells you the average shortfall (or gain) relative to the index.
Tracking error (TE) is the standard deviation of the tracking difference over time. It measures consistency. A low tracking error means the fund delivers its result predictably. A high one means the gap between fund and index jumps around from period to period.
When choosing between two funds, favour whichever shows a comparable or superior average tracking difference alongside a tighter tracking error. A fund that deviates from its benchmark by a steady, foreseeable margin is more useful than one whose gap swings widely, even if the averages look comparable on paper. That consistency is a core part of what you are paying for when you select a passive vehicle.
Use these thresholds as a starting framework:
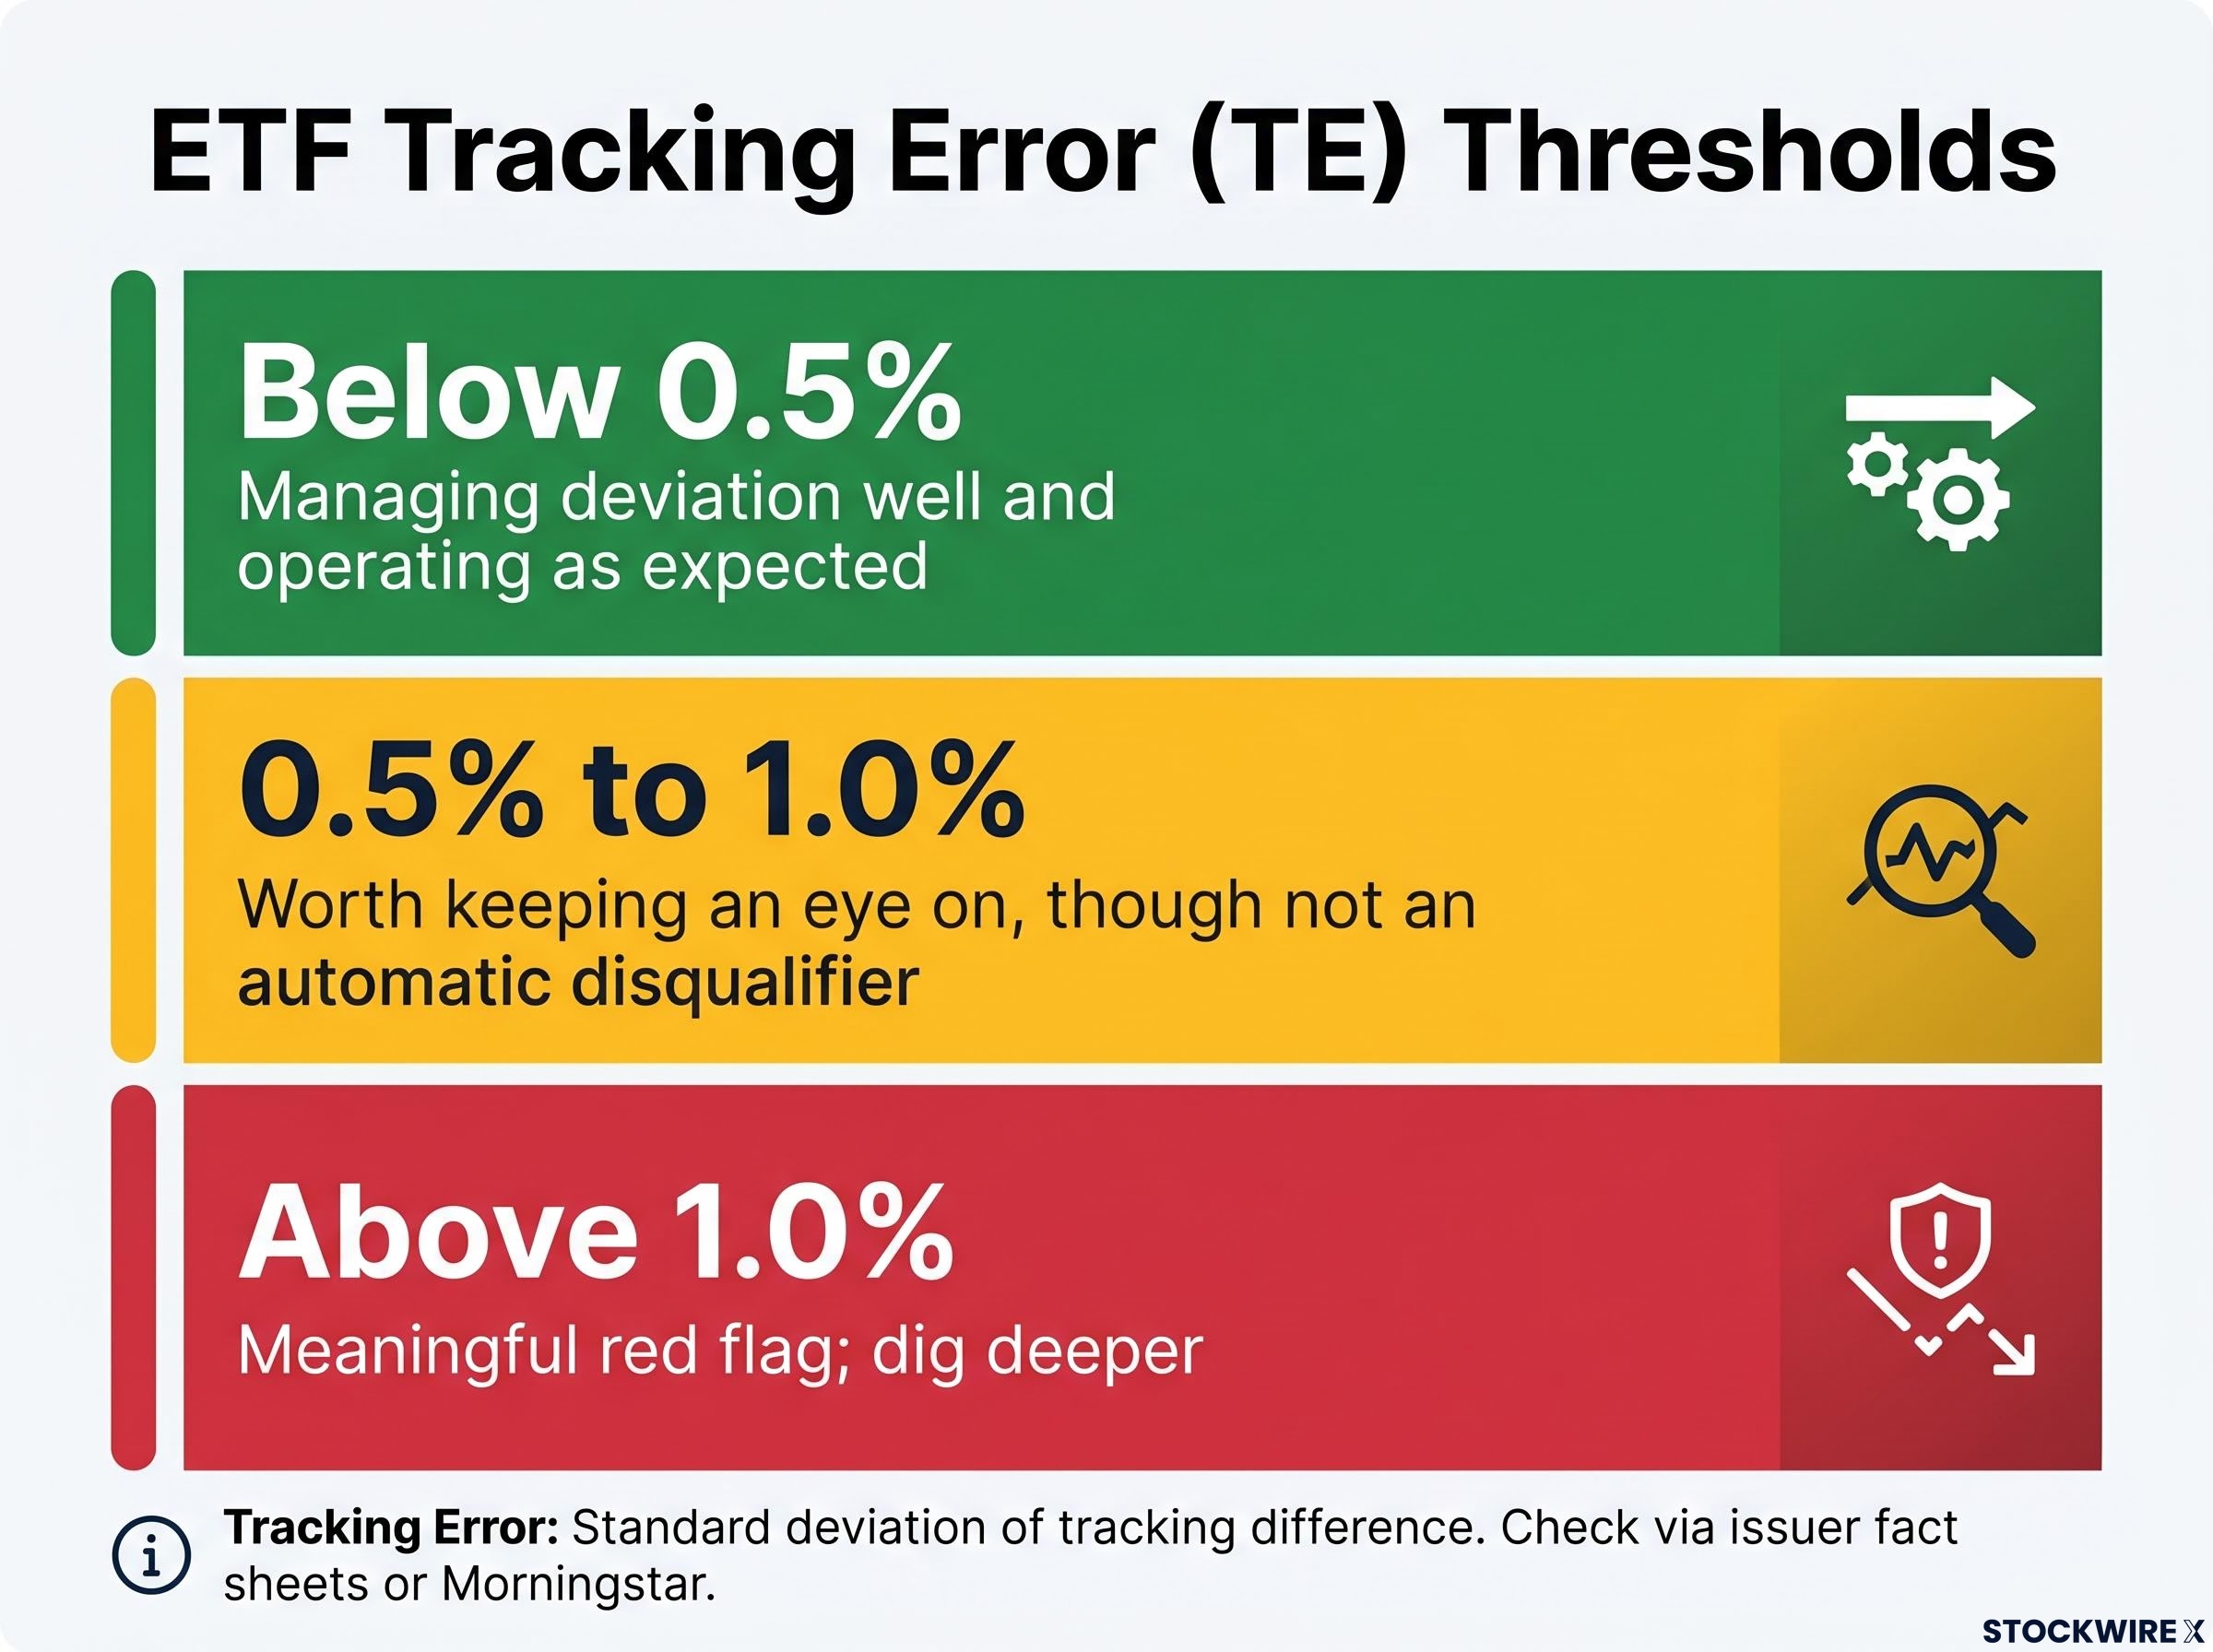
Check these figures against both issuer fact sheets and independent data providers such as Morningstar. Because issuers naturally highlight their most flattering results, using multiple external sources and reviewing several time horizons together will give you a more balanced and reliable view.
Because an ETF must keep a slice of its assets available in liquid form to meet redemptions, distributions, and day-to-day operational requirements, it cannot remain fully invested at all times the way its benchmark assumes. That gap between the ETF’s actual allocation and the index’s theoretical full-investment stance creates a steady, low-level performance shortfall commonly called cash drag. In any given month the effect is small. Compounded across a decade, it becomes a measurable drag on returns.
Funds that reinvest dividends quickly and systematically reduce the cash drag interval. Tight, stable tracking over multi-year periods is often a signal that the fund manages cash well. When you are comparing two funds with otherwise similar metrics, cash management quality can be the tiebreaker.
A fund with acceptable average tracking difference but high tracking error is making a promise it cannot reliably keep. You cannot confidently forecast what your net-of-cost return will be year to year, and that undermines the entire premise of choosing a passive vehicle for predictability.
How a fund constructs its portfolio determines both the tracking quality it can achieve and the structural risks it introduces. Three methods exist, and each suits different index types.
| Method | How it works | Best suited for | Key risk to evaluate |
|---|---|---|---|
| Full physical replication | Fund owns all index constituents in proportion | Liquid, simple indexes (S&P 500, large-cap benchmarks) | Minimal structural risk; highest transparency |
| Optimised sampling | Fund holds a statistically representative subset | Illiquid or complex indexes (small-cap emerging markets, certain fixed income) | Additional tracking deviation that cannot be fully eliminated |
| Synthetic replication | Fund uses a total return swap with a counterparty | Indexes where direct ownership is impractical or where very tight tracking is required | Counterparty risk if the swap provider defaults; requires due diligence on collateral (typically 102%-105% of borrowed value) |
The question to ask about any fund you encounter is not “which method is best?” but “is this method appropriate for the index it is tracking?” Full physical replication on a liquid large-cap index is straightforward and transparent. Optimised sampling on a small-cap emerging market index is necessary and reasonable.
A synthetic ETF on a highly liquid index such as the S&P 500, however, warrants more scrutiny. The added structural complexity introduces counterparty dependency that is not justified by the index characteristics. For long-term buy-and-hold investors, that layer of risk may not appear on the fund factsheet, but it exists in the fund’s structure.
Here is a counterintuitive possibility: a fund can legally outperform its own benchmark, net of all costs. It happens through securities lending.
ETFs generate revenue by loaning portfolio holdings to short sellers in exchange for fees. Short sellers must post collateral, typically set at between 102% and 105% of the market value of the borrowed stock. Where a particular holding is actively sought by short sellers, the annualised fee charged for lending it can reach 10% to 20% in exceptional circumstances. For broad-market funds, the income is more modest but still meaningful.
A well-structured securities lending programme with high pass-through to shareholders can partially or fully offset the expense ratio, and in favourable circumstances, produce a positive tracking difference, meaning the fund slightly outperforms its benchmark net of costs.
Different issuers take different approaches to how they split lending revenue: some return the bulk of the proceeds to the fund and therefore to shareholders, while others retain a larger share internally. The exact split is set out in the fund prospectus and represents a meaningful, if often overlooked, variable in your total return. High pass-through combined with conservative risk controls is the combination you want.
Issuer quality is the structural foundation underneath every metric discussed so far. A fund from an issuer with weak operational infrastructure may show attractive headline numbers in a calm market that will not hold up when conditions become more demanding. You have no way to see that risk in the expense ratio or a single year of tracking data.
Evaluate issuers across four dimensions:
Professional fund screening frameworks such as Morningstar’s three-pillar approach add a qualitative layer to the quantitative metrics covered here: evaluating the people managing the fund, the investment process they follow, and the parent organisation’s culture and incentive structure can surface risks that tracking difference and expense ratio data alone will not capture.
Everything above assembles into a single decision workflow. When you sit down to compare two or more ETFs offering the same exposure, work through these steps in order:
A structured comparison using this framework takes approximately 10 to 15 minutes per fund pair. To operationalise it, populate this worksheet for each fund before making your selection:
| Field | What to record |
|---|---|
| Fund name and ticker | e.g., VOO, SPY, IVV |
| Index tracked | Exact index name and methodology |
| Expense ratio (%) | From issuer documents; note if waivered |
| Bid-ask spread (%) | Computed at midpoint during normal hours |
| Average daily volume | Shares per day |
| 1/3/5-year tracking difference | ETF return minus index return for each period |
| Tracking error | Standard deviation of tracking difference |
| AUM | Total assets under management |
| Replication method | Full physical, optimised sampling, or synthetic |
| Securities lending pass-through (%) | Percentage returned to shareholders; risk controls noted |
| Issuer | Name and fund family |
| Fund age | Years since inception |
| Notes | Any flags, anomalies, or caveats |
That worksheet, combined with the eight-step sequence, gives you a tool you can open in a second browser tab alongside any fund page and work through without needing to return to this article for guidance.
Not every comparison produces a clear winner. When the fee difference is minimal but one issuer is operationally stronger, favour issuer quality. Operational discipline compounds over decades in ways that a 1 to 2 basis point fee difference does not.
When a higher-fee fund shows consistently better tracking, calculate whether the superior tracking difference more than compensates for the higher expense ratio over your intended holding period. If the net-of-all-costs outcome favours the higher-fee fund and the tracking advantage is durable, it may still be the correct choice. When data sources conflict, rely on the most recent data available and use issuer-sourced primary documents as the tiebreaker.
Fee predictability research from Morningstar identifies the expense ratio as a more reliable forward-looking indicator of relative fund performance than past returns, fund size, or analyst star ratings, a finding that holds across asset classes and geographies and gives the cost-first approach in this framework an evidence base beyond simple arithmetic.
Before any ETF purchase, run through this pre-purchase checklist:
The most meaningful compounding advantage comes not from obsessing over a single metric but from systematically eliminating funds with structural disadvantages across multiple dimensions. The right question was never “which ETF is cheapest?” It is which ETF delivers the target index exposure most efficiently, most predictably, and at the lowest total cost across the holding period you actually intend.
A single 10 to 15 minute evaluation session using this framework represents more rigorous ETF due diligence than the majority of investors perform across years of holding. The long-term return difference from that session will exceed the time cost by a substantial margin.
This article is for informational purposes only and should not be considered financial advice. Investors should conduct their own research and consult with financial professionals before making investment decisions. Past performance does not guarantee future results.
Tracking difference is the ETF's actual return minus the index return over a given period, and it tells you whether the fund is delivering what it promises after all costs. A slightly positive tracking difference can indicate strong securities lending income; a consistently negative one signals the fund is quietly eroding your returns relative to the benchmark.
True ownership cost combines three layers: the explicit expense ratio, implicit costs like bid-ask spreads and cash drag, and any structural offsets from securities lending pass-through. For a fund you trade infrequently over a long holding period, tracking difference over 3-5 years is the most reliable single proxy for total cost.
Tracking difference measures the average return gap between the fund and its index; tracking error measures how consistently that gap holds over time. A fund with acceptable average tracking difference but high tracking error cannot reliably deliver a predictable net-of-cost return, which undermines the core premise of a passive vehicle.
SPY charges 0.0945% annually versus 0.03% for VOO and IVV, a gap of roughly 0.0645 percentage points. Applied to a $100,000 position growing at 8% annually over 30 years, that difference compounds into thousands of dollars of foregone return despite all three funds tracking the identical S&P 500 index.
Securities lending is when an ETF loans portfolio holdings to short sellers in exchange for fees, generating revenue that can partially or fully offset the expense ratio. The key variable is pass-through rate: issuers that return the bulk of lending income to shareholders can produce a positive tracking difference, meaning the fund slightly outperforms its benchmark net of all costs.