ASX 200 Flat Close Masks a Sharp Defensive vs Energy Split
3 hrs ago
Gold has shed more than $1,400 per ounce from its January 2026 all-time high of $5,608.35, and Monday’s 0.8% bounce back to $4,194.83 did little to change the structural picture. The June 21 rebound followed three consecutive sessions of losses and a 1.4% weekly decline, arriving on the same day that US-Iran diplomats in Switzerland announced a 60-day roadmap toward a final nuclear agreement. That geopolitical development eased crude oil prices and trimmed some of gold’s safe-haven premium simultaneously, producing a muted recovery that reveals as much as it conceals about the forces controlling the metal. This analysis unpacks the specific mechanisms behind Monday’s move, explains why the Federal Reserve and the dollar are keeping gains capped, and maps out what the upcoming Personal Consumption Expenditures (PCE) inflation release means for gold’s near-term direction.
The key price data from June 21, 2026 tells the story before any interpretation is required:
All-time high: $5,608.35 (January 2026). Gold is currently trading more than $1,400 below that level, placing Monday’s $33 gain in proper scale.
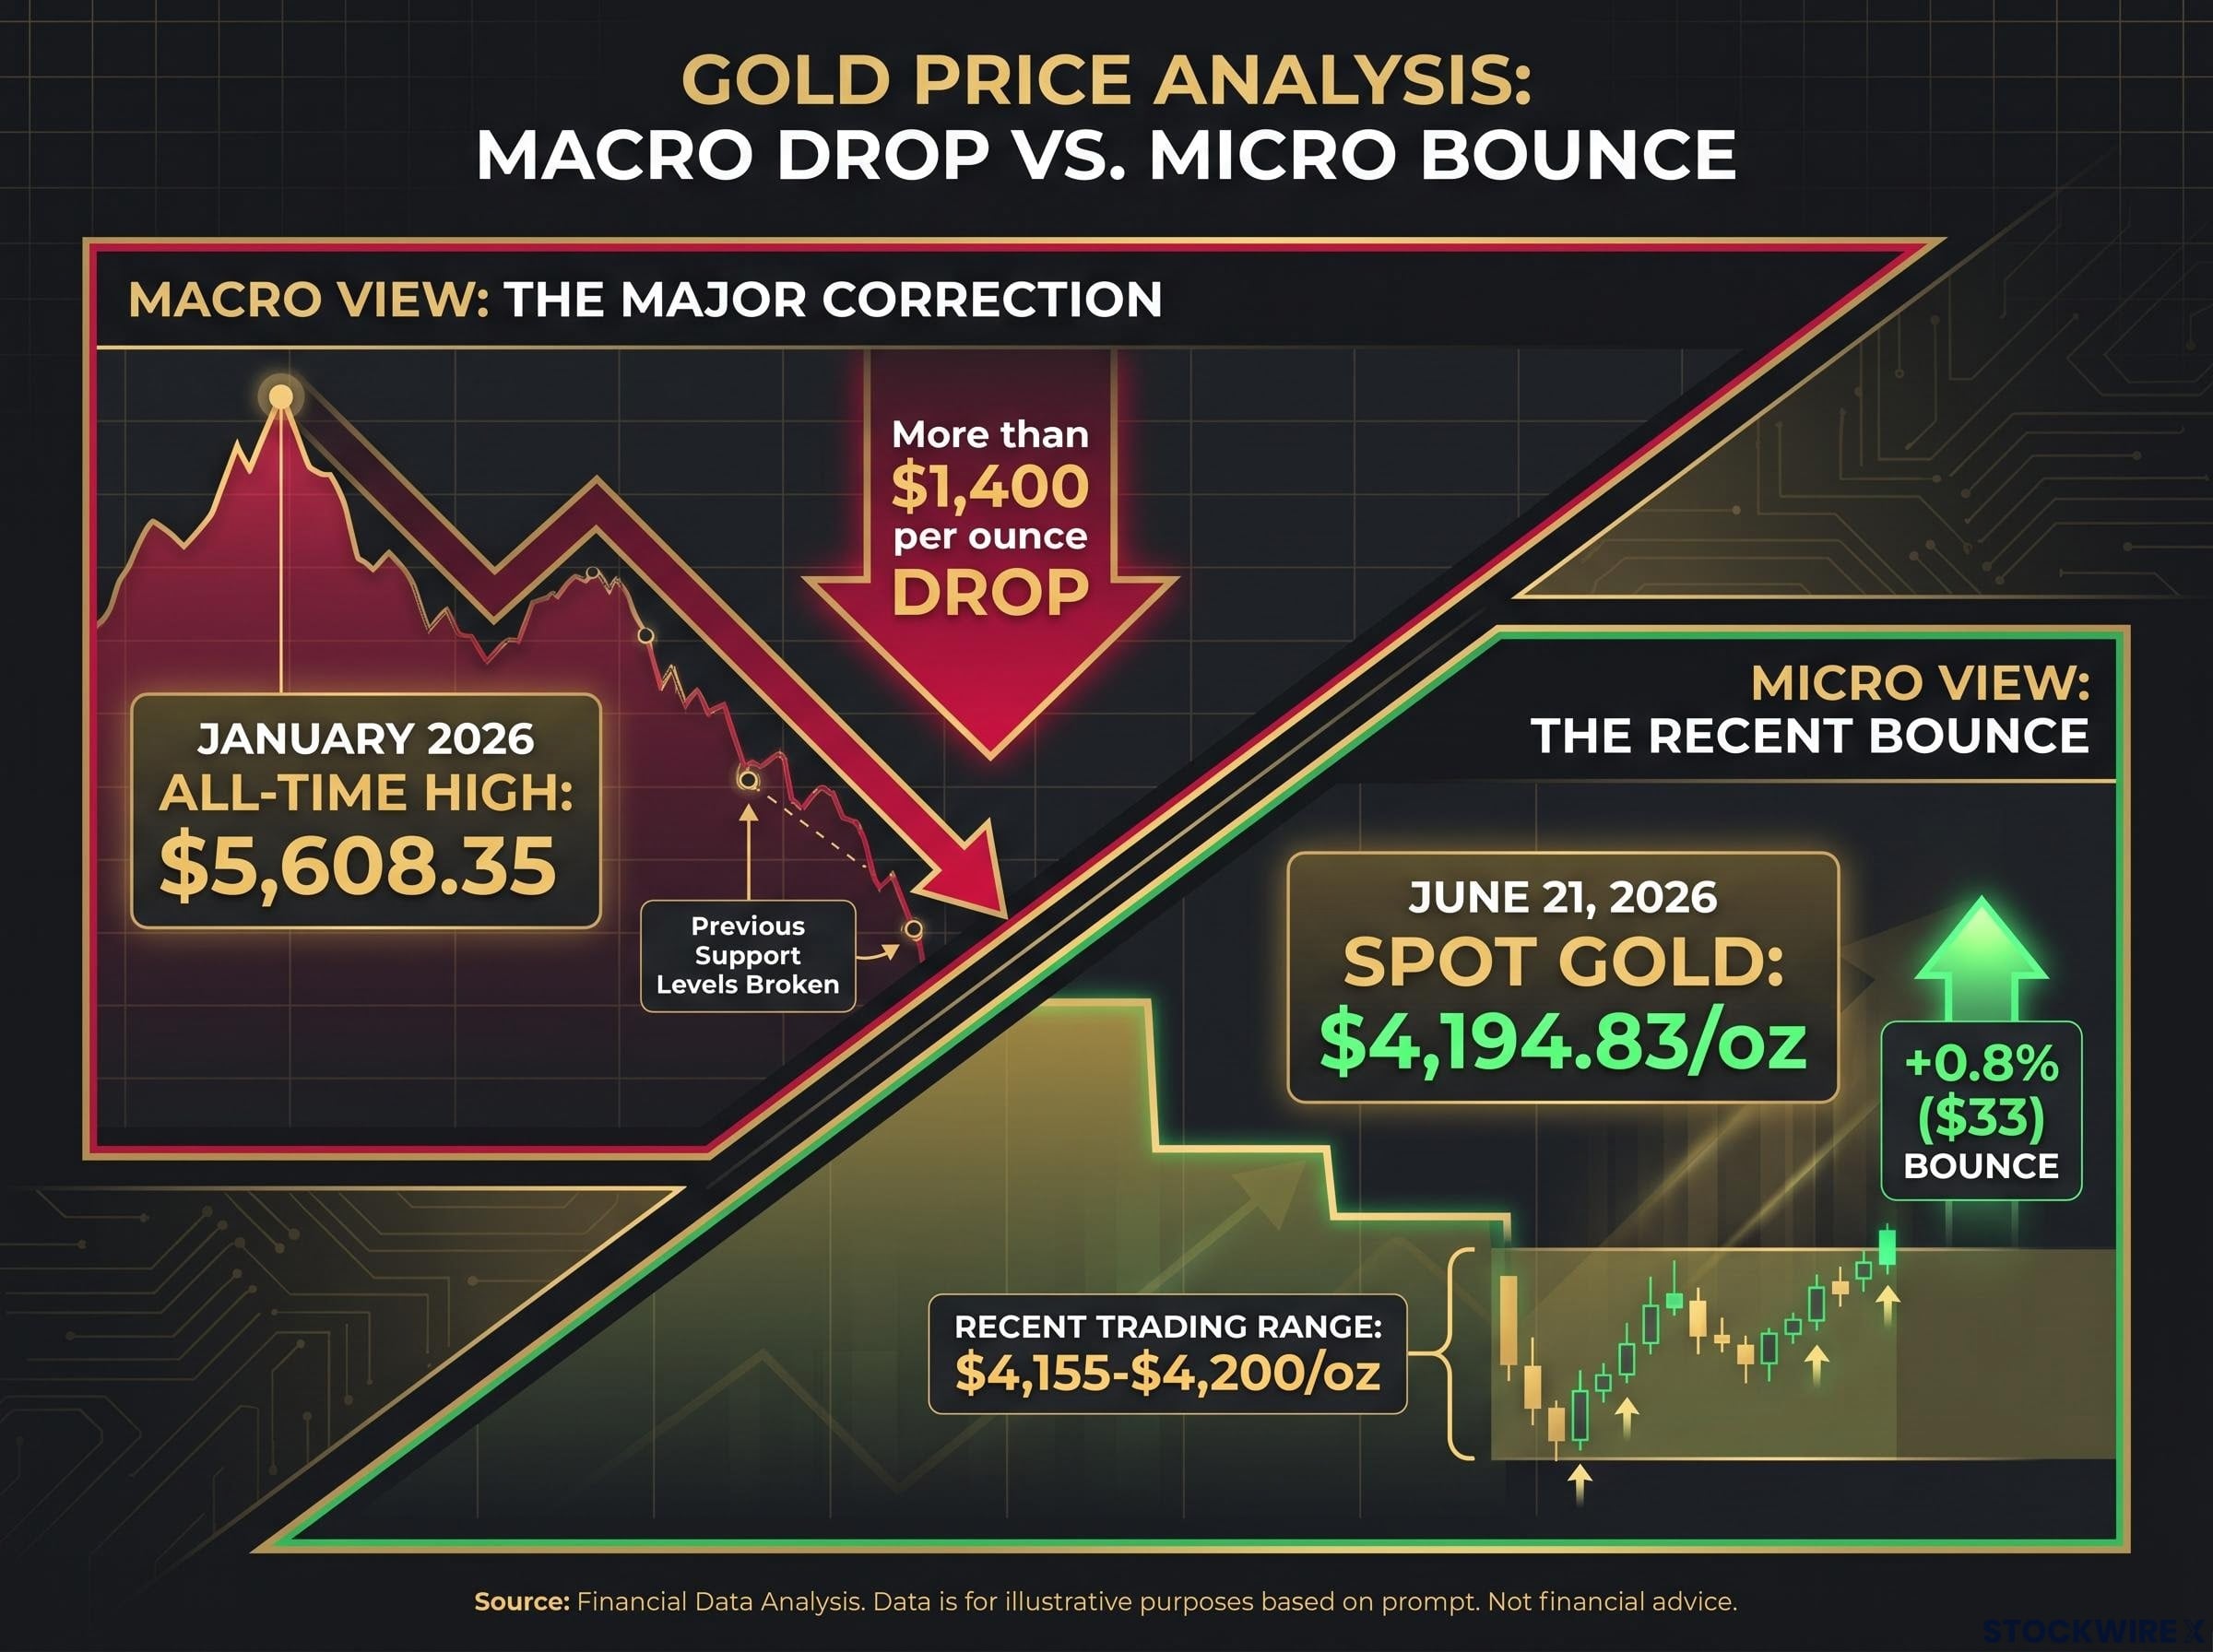
A 0.8% bounce after three consecutive losing sessions and a 1.4% weekly decline is a stabilisation, not a reversal. The move recovered a fraction of the prior week’s losses and left spot prices pinned inside the same narrow range that has contained trading for recent sessions. Treating this as anything more than a corrective bounce inside a larger pullback from record highs would misread the price action.
Gold’s 2026 bear market demonstrates the hierarchy of forces at work: crowded long positioning after a 65% rally in 2025 amplified the correction when real yields turned decisively higher, with the metal breaching its 200-day moving average for the first time in nearly three years and triggering systematic strategy liquidations that compounded the macro-driven sell-off.
The first round of US-Iran talks concluded on June 22, 2026 in Switzerland, conducted in a quadrilateral format with Qatar and Pakistan serving as mediators. The parties announced alignment on a negotiating roadmap, including a 60-day timeline toward a final deal. Technical-level discussions were scheduled to continue through the remainder of the week.
Iran’s foreign ministry issued a statement citing “meaningful advancement” in the negotiations.
The diplomatic progress placed immediate downward pressure on crude oil. Brent crude retreated from earlier session gains on June 21 following indications of progress, despite continued tensions involving the Strait of Hormuz. That oil move is where the transmission to gold begins.
Gold’s safe-haven premium is partly a function of perceived energy supply risk. When diplomatic progress reduces the probability of sustained supply disruption, crude softens, forward inflation expectations moderate slightly, and the urgency behind safe-haven buying eases. That is exactly what happened on Monday. The talks shifted the situation from acute fear to managed risk, enough to trim gold’s geopolitical bid but not enough to eliminate it. The result was a partial trigger for the bounce (easing of immediate tension) and simultaneously a reason the bounce stayed partial (reduced safe-haven urgency). Diplomatic progress, counterintuitively, both helped and constrained gold in the same session.
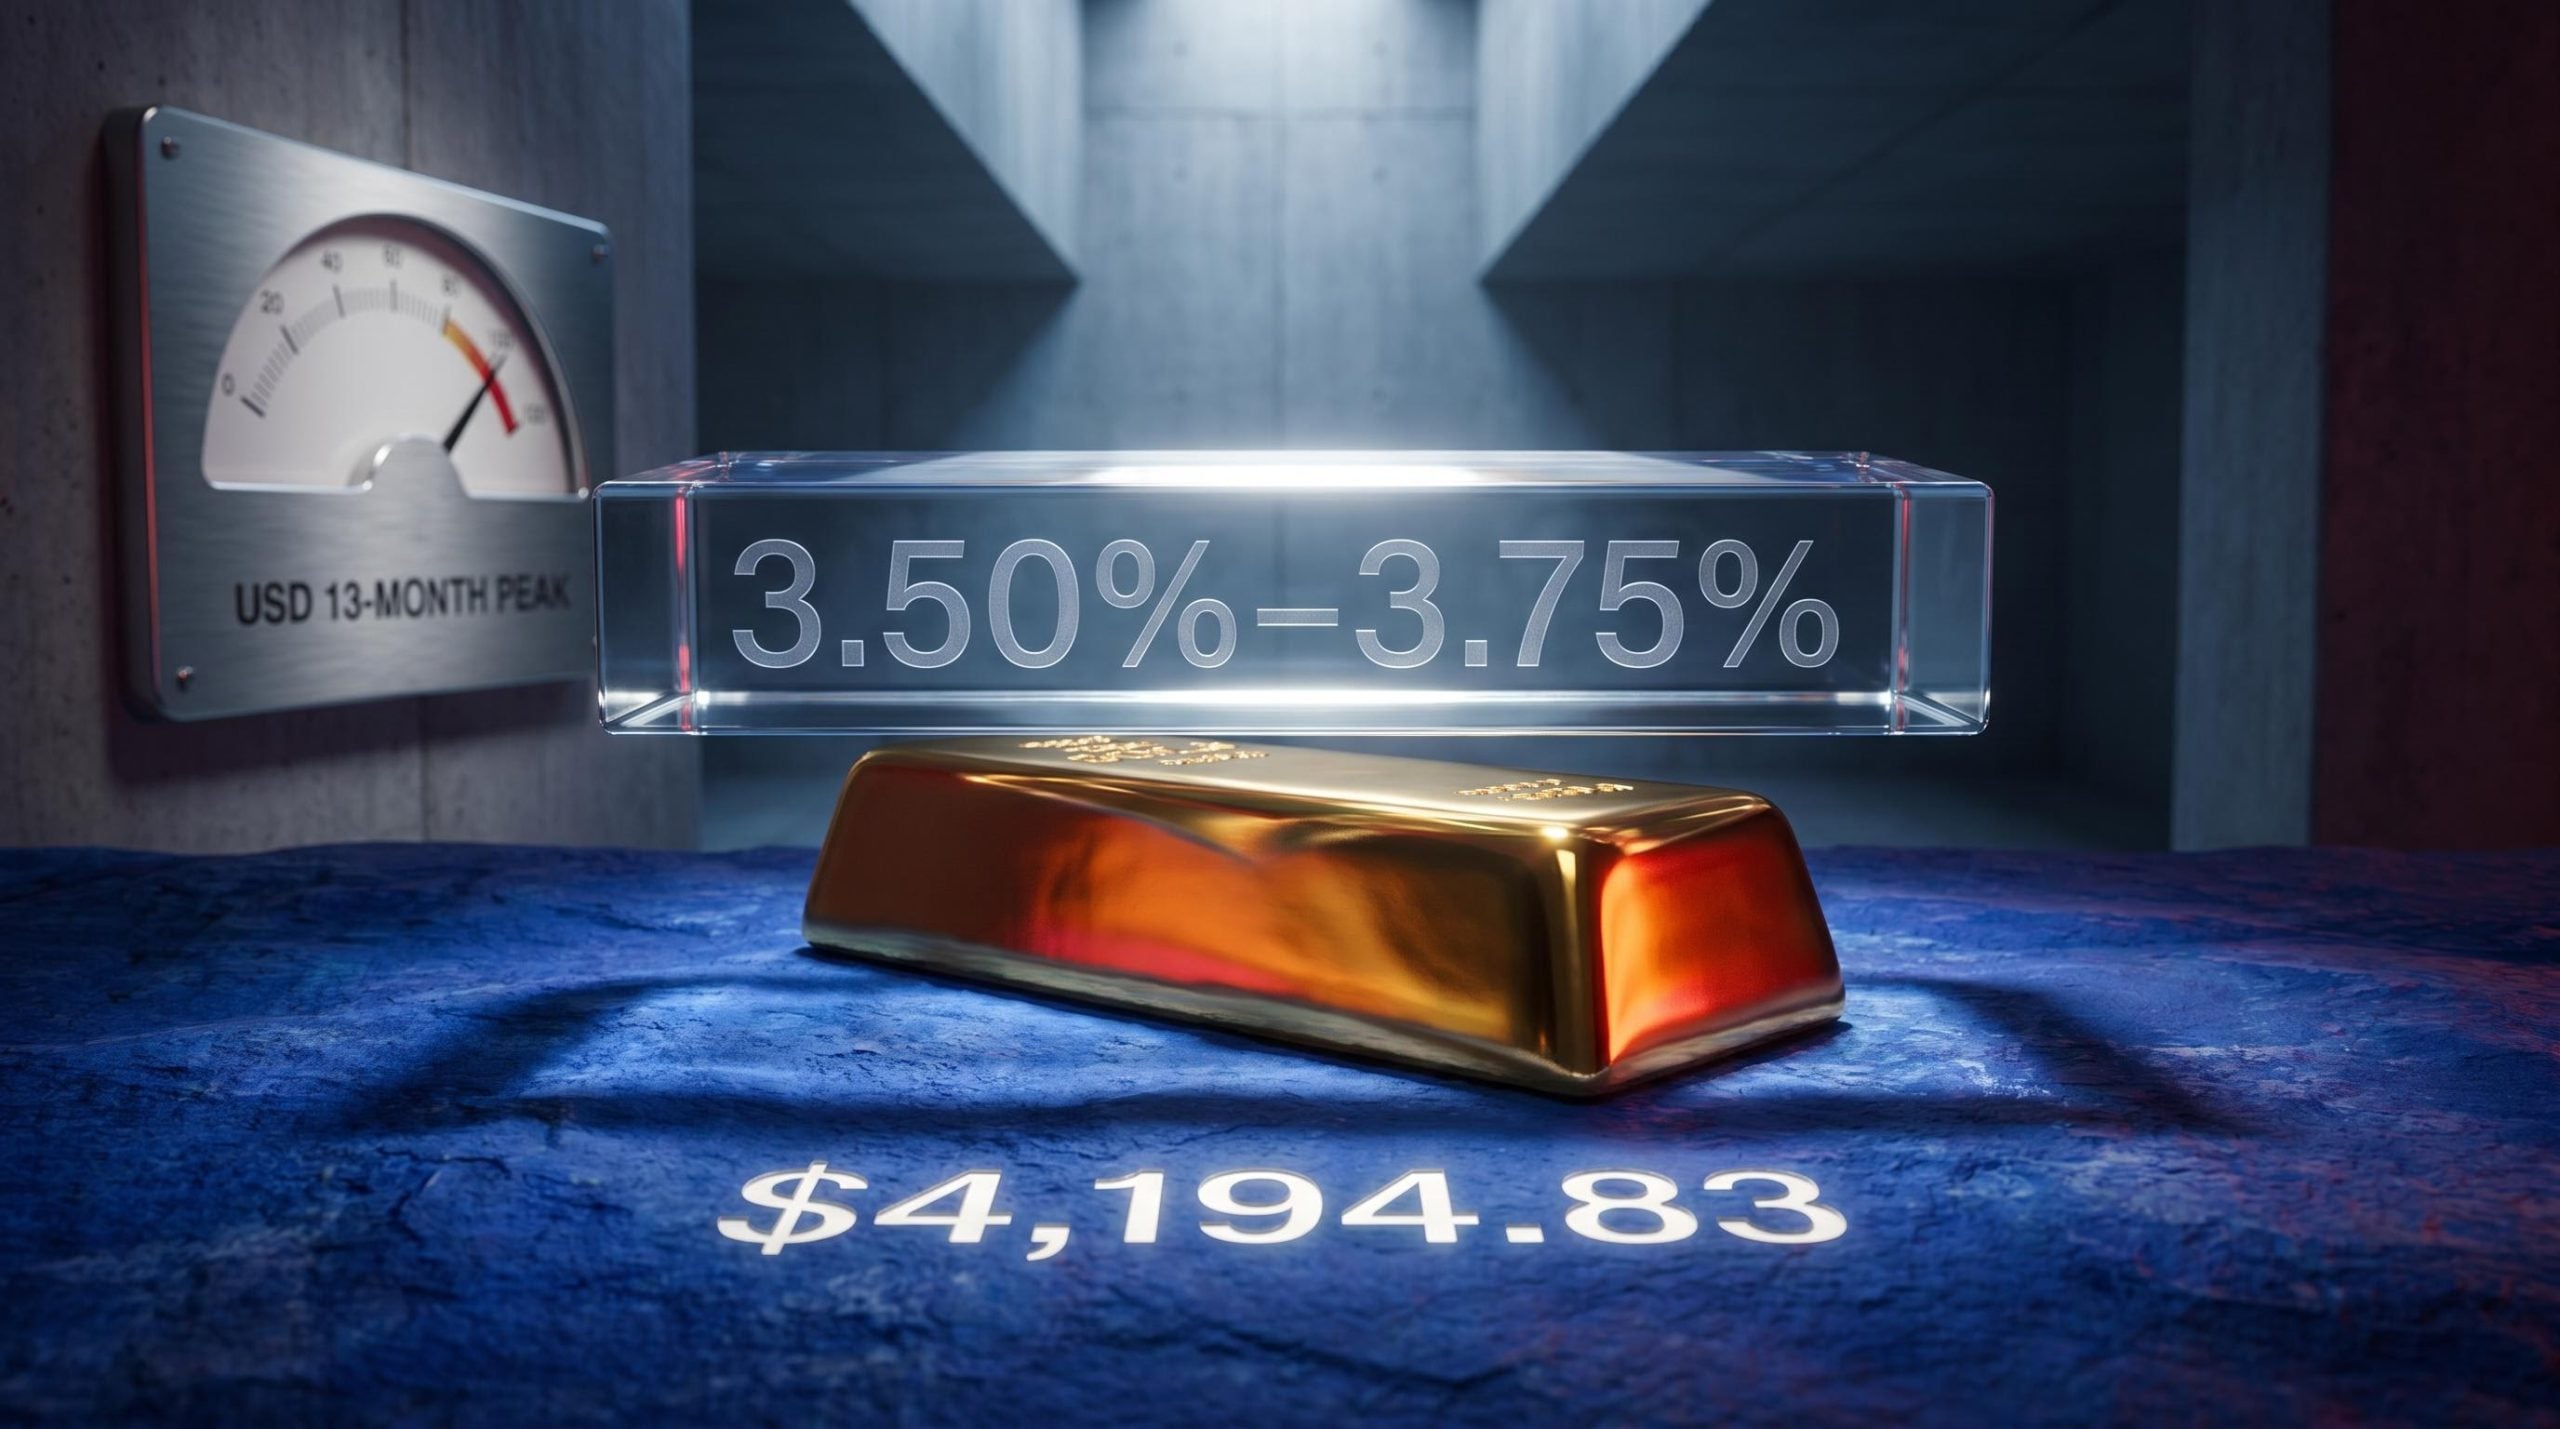
The June 17, 2026 Federal Open Market Committee (FOMC) meeting, chaired by Kevin Warsh, held the federal funds rate at 3.50%-3.75%. The decision itself was expected. What matters for gold sits in the details beneath it.
The June 2026 FOMC regime shift was more consequential than the rate hold itself: Kevin Warsh stripped forward guidance from the policy statement entirely, recentring the Fed’s mandate on price stability and leaving markets to price each meeting on incoming data alone, a posture that directly amplifies gold’s sensitivity to releases like the upcoming PCE print.
| FOMC Variable | Detail |
|---|---|
| Rate decision | Held at 3.50%-3.75% |
| Chair | Kevin Warsh |
| Median year-end projection | 3.8% |
| Participants supporting at least one more hike | Nine of 18-19 |
| USD Index | Near 13-month peak as of June 21 |
The median endpoint projection of 3.8% by year-end implies at least one more hike remains the base case, and roughly half of participants see that as the minimum. That projection keeps real yields elevated, meaning the return available on interest-bearing assets stays high relative to gold, which generates no yield. A firm rate outlook also supports the dollar; the USD Index sat near a 13-month peak as of June 21, making dollar-priced gold more expensive for non-US buyers.
ING analysts published a note indicating that a sustained high US rate environment could cap near-term gold price appreciation, framing the higher-for-longer stance as the binding constraint on the metal’s upside.
The mechanism is straightforward: high real yields raise gold’s opportunity cost, a firm dollar compresses international demand, and the absence of a clear Fed pivot removes the catalyst that would unlock a sustained move higher. Until one of those variables shifts, the ceiling holds.
Gold generates no interest, no dividends, and no coupon payments. When interest rates are elevated, holding gold means forgoing the yield available from bonds or cash equivalents. That opportunity cost is the single most direct channel through which monetary policy affects gold pricing.
The metal serves two distinct demand functions that can pull in different directions:
Safe-haven demand drivers:
Inflation-hedge demand drivers:
In a high-rate environment, the inflation-hedge function weakens because elevated rates are themselves a tool for containing inflation. Safe-haven demand, however, operates independently of rate levels, responding to geopolitical events regardless of where the federal funds rate sits.
Gold does not simply track the inverse of real rates at all times because structural support factors create a persistent floor:
Gold’s January 2026 record of $5,608.35 was itself evidence of these structural forces overwhelming the rate headwind for a period. The current correction reflects the rate constraint reasserting control.
For investors wanting to understand why gold maintained a floor above $4,070 even during the sharpest phase of this year’s selloff, our dedicated guide to gold’s structural demand shift examines the two forces reshaping the metal’s demand base: sovereign central bank accumulation exceeding 1,000 tonnes annually since 2022 and the emergence of Asian-listed gold ETFs as a major buyer pool that did not exist at scale before 2024.
Silver outpaced gold on June 21. Platinum barely participated. The divergence carries analytical signal.
| Metal | June 21 Price | June 21 Change (%) | Primary Demand Driver | Sensitivity to Risk Sentiment |
|---|---|---|---|---|
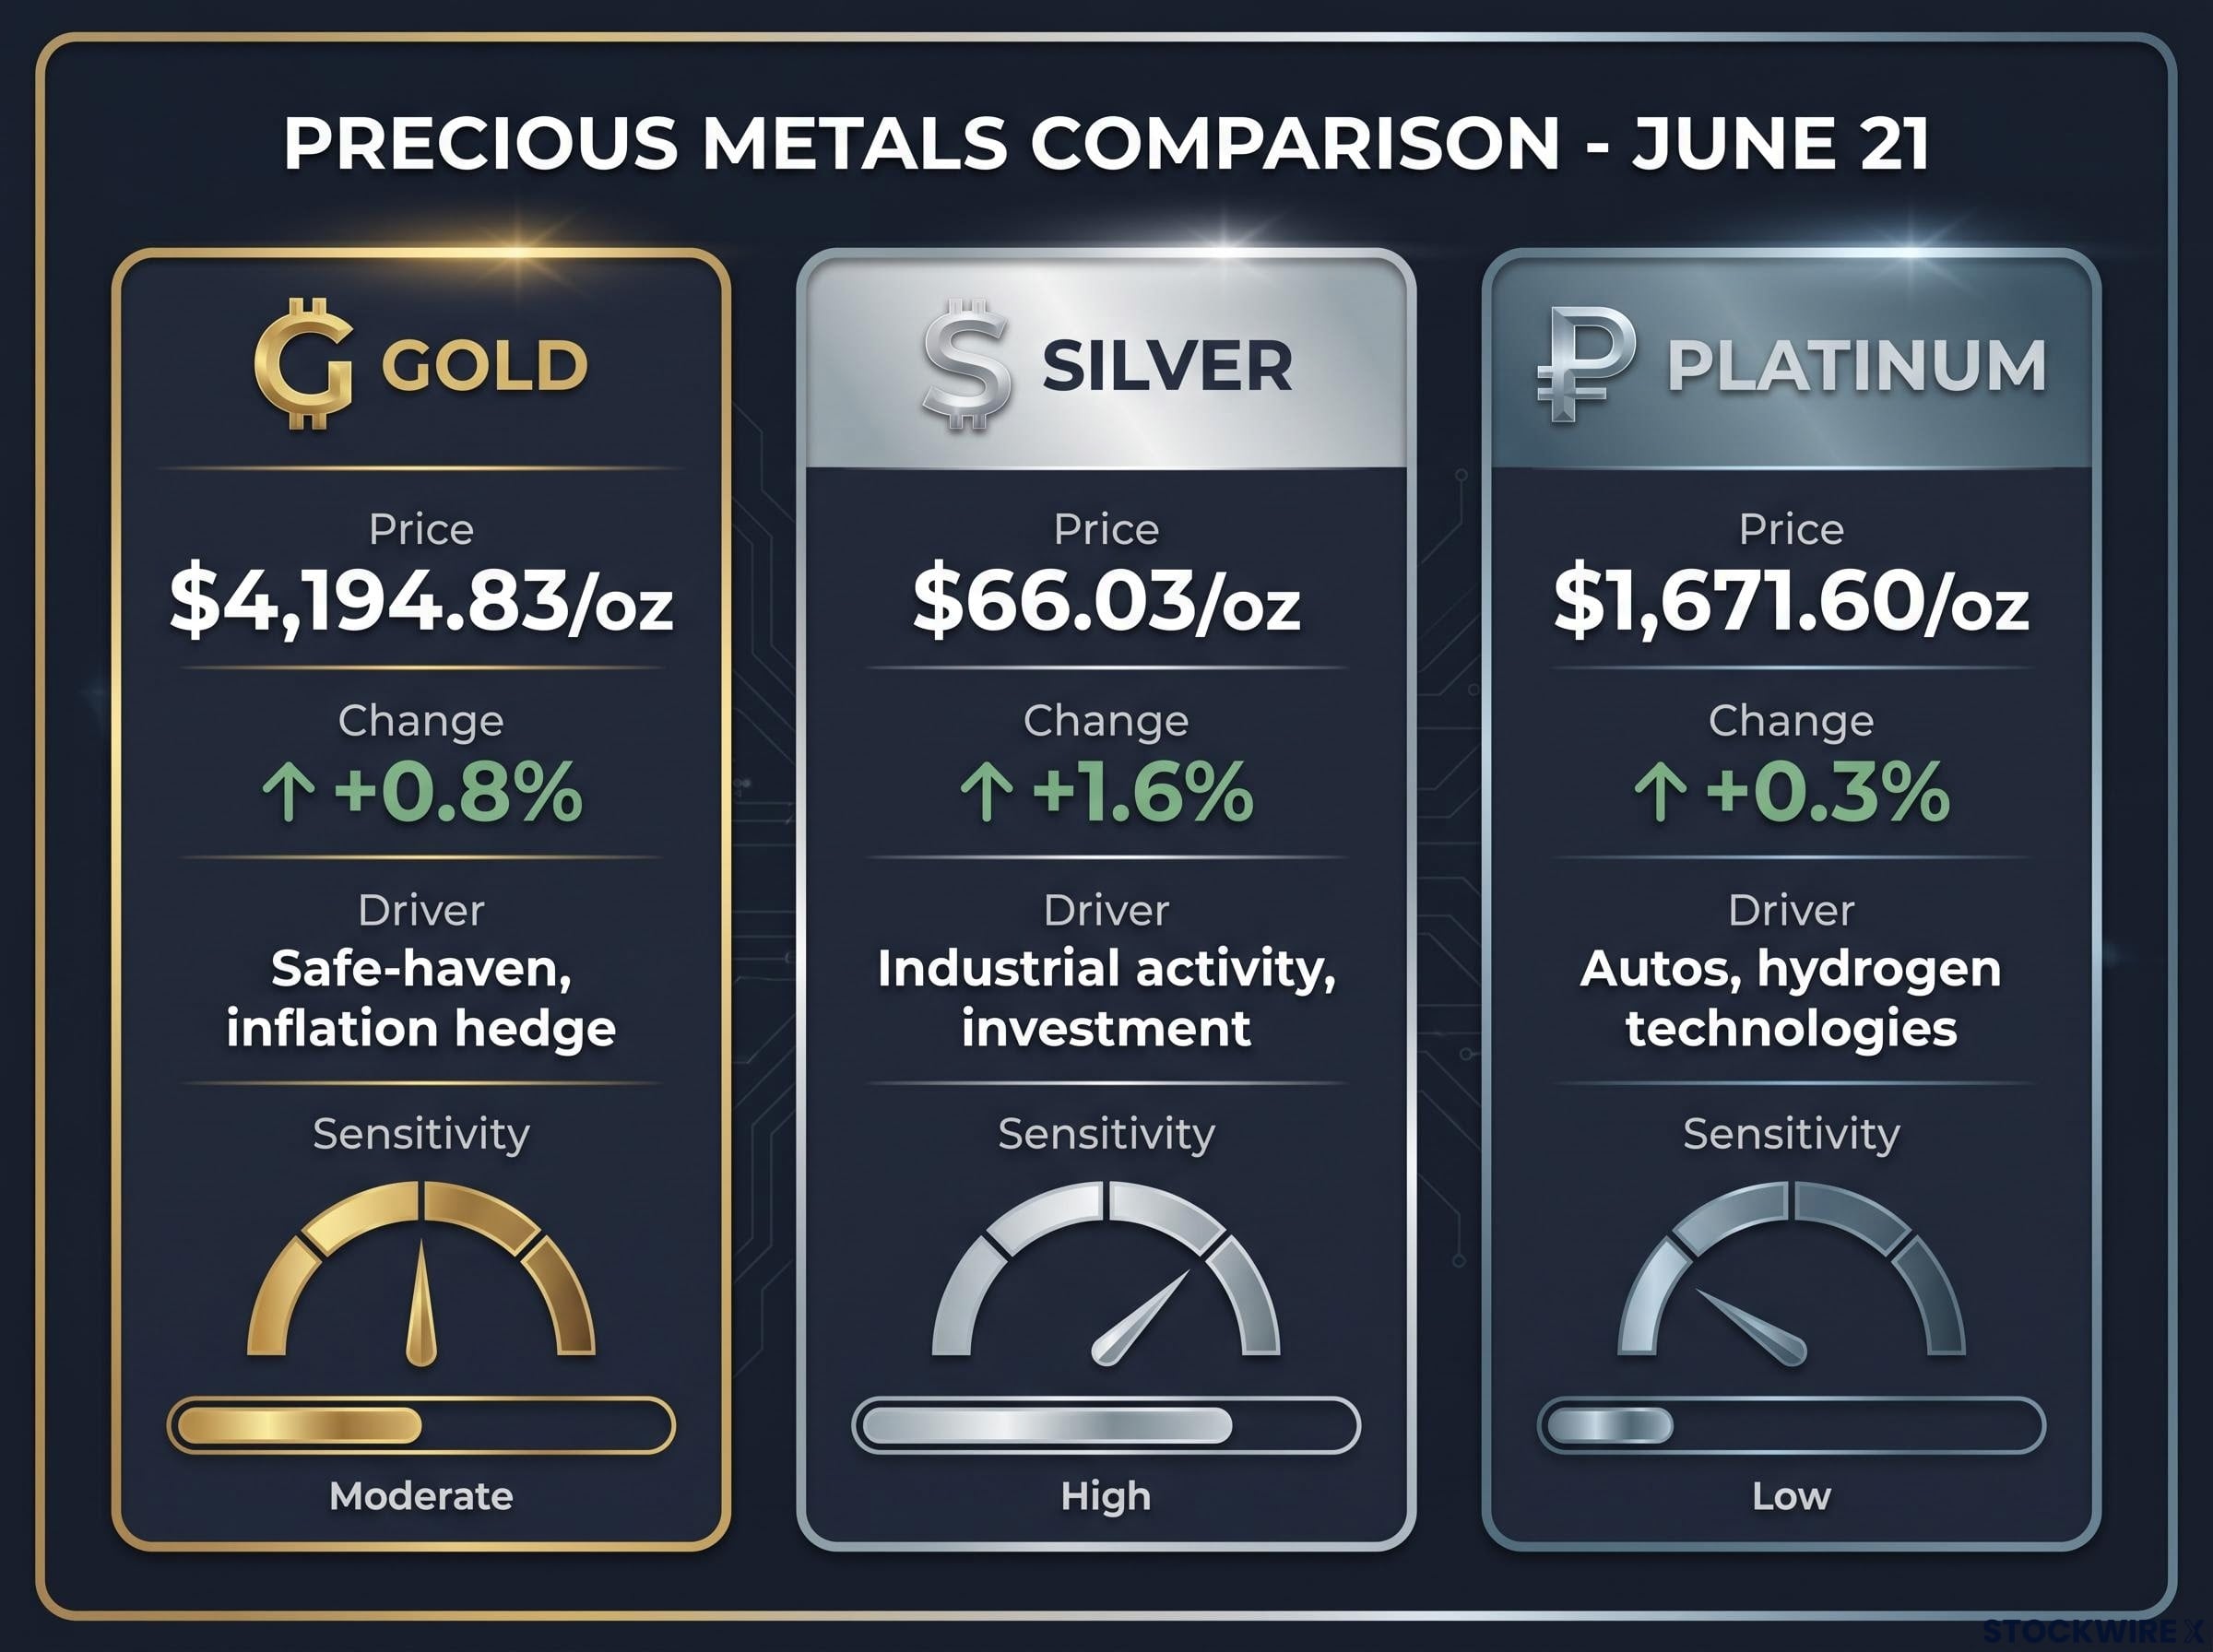
| Gold | $4,194.83/oz | +0.8% | Safe-haven, inflation hedge | Moderate |
| Silver | $66.03/oz | +1.6% | Industrial activity, investment | High |
| Platinum | $1,671.60/oz | +0.3% | Autos, hydrogen technologies | Low |
Silver’s 1.6% gain, double gold’s move, reflects its higher beta to global risk sentiment and industrial activity. When macro conditions improve even marginally, silver amplifies the signal because a larger share of its demand originates from industrial consumption rather than pure safe-haven positioning. Platinum’s 0.3% advance is consistent with its narrower demand base, concentrated in automotive catalytic converters and emerging hydrogen technologies, sectors less directly responsive to a single day’s diplomatic headlines.
All three metals face the same Fed and dollar headwinds. The difference in their responses reveals that Monday’s move was driven more by improving risk appetite than by a fundamental shift in safe-haven demand, a reading that reinforces the characterisation of gold’s bounce as corrective rather than directional.
The US PCE price index, expected later in the week of June 21, 2026, functions as a direct input into the Fed’s rate path. It is the central bank’s preferred inflation gauge, and its reading will either reinforce or soften the hawkish bias that currently constrains gold.
The Federal Reserve’s PCE inflation methodology accounts for how Americans are actually spending money in real time, adapting to shifts in consumption patterns more rapidly than the Consumer Price Index, which is precisely why PCE readings carry disproportionate weight in shaping the rate path that constrains gold.
Even under the cooler scenario, a sustained rally remains unlikely without a clear Fed pivot signal. A single softer inflation print may open the range; it would not, on its own, reverse the structural headwind that has compressed gold from $5,608 to $4,194 over the past five months. The $4,155-$4,200 zone remains the battleground.
Gold sits at the intersection of competing forces: structural support from central bank demand, sovereign diversification, and persistent geopolitical uncertainty on one side; a firm dollar, elevated real yields, and no clear Fed pivot on the other. Monday’s 0.8% bounce confirmed the metal’s resilience at the lower boundary of its recent range without signalling a clean directional break.
The base case remains range-bound trading with elevated volatility around data releases and Fed communications. The PCE print later this week is the next inflection point, capable of either reinforcing the ceiling or testing the floor. Until the rate outlook shifts in a material way, the range holds.
For readers thinking carefully about what the PCE print will actually decide, our full explainer on why gold price prediction fails examines three documented rate cycles where outcomes directly contradicted the most widely cited gold trading rules, and explains why the World Gold Council’s own GRAM model attributes dominant price influence to investor positioning rather than measurable economic fundamentals.
This article is for informational purposes only and should not be considered financial advice. Investors should conduct their own research and consult with financial professionals before making investment decisions. Past performance does not guarantee future results. Financial projections are subject to market conditions and various risk factors.
The PCE (Personal Consumption Expenditures) price index is the Federal Reserve's preferred inflation gauge, measuring how Americans actually spend money in real time. Because it directly shapes the Fed's rate path, a hotter-than-expected PCE reading strengthens the dollar and real yields, both of which are direct headwinds for gold prices.
Gold fell from its January 2026 record of $5,608.35 to around $4,194 as elevated real yields raised the opportunity cost of holding a non-yielding asset, the US dollar strengthened to a 13-month peak, and crowded long positions built during a 65% rally in 2025 were liquidated when systematic strategies triggered.
Progress in US-Iran nuclear talks reduces the perceived risk of energy supply disruption through the Strait of Hormuz, which softens crude oil prices and moderates forward inflation expectations, simultaneously trimming gold's geopolitical safe-haven premium even as it contributes to a partial bounce.
Gold generates no interest, dividends, or coupon payments, so when rates are elevated, investors forgo meaningful yields available from bonds or cash equivalents by holding gold. The Fed's current federal funds rate of 3.50%-3.75% and a median year-end projection of 3.8% keep this opportunity cost high, capping gold's upside.
Silver gained 1.6% compared to gold's 0.8% because silver carries a higher beta to global risk sentiment and industrial activity, with a larger share of its demand coming from industrial consumption rather than pure safe-haven positioning, meaning it amplifies any marginal improvement in macro conditions.