
Mid-2026’s Biggest Market Risks, Ranked by Actual Probability
19 hrs ago

Two ASX insurers sit at the centre of a decision facing income and growth investors alike heading into FY27. Market Partners analyst James Gerrish nominates Suncorp Group (ASX: SUN) as his top pick for dividend income and QBE Insurance Group (ASX: QBE) as his top pick for capital growth, a pairing that frames the choice not as which stock is superior, but which suits a given portfolio’s objectives.
Both companies are operating in a favourable insurance cycle characterised by premium repricing and rate hardening. Both have undergone structural changes that make them cleaner businesses than they were three years ago. Yet the investment cases diverge sharply: Suncorp offers franked yield and domestic simplicity; QBE offers global cycle leverage and a turnaround still building momentum, with its share price near levels not seen in roughly 15-16 years.
What follows is a structured, evidence-based framework for deciding between the two, or for holding both.
The renewed interest in ASX insurance stocks rests on two shared tailwinds and two company-specific catalysts. Both Suncorp and QBE are benefiting from the same macro environment, which means choosing between them is a question of fit rather than quality.
APRA quarterly insurance statistics for the December 2025 period confirm the sector-wide premium growth and profitability improvement that underpins the investment cases for both Suncorp and QBE, with industry net profit after tax and capital adequacy metrics reflecting the benefit of sustained rate hardening across Australian general insurance lines.
Gerrish’s nominations, based on conditions as of June 2026, treat both stocks as beneficiaries of the same cycle. The sections that follow separate the two investment cases.
The Suncorp that many Australian investors remember was a hybrid bank-insurer, a structure that complicated earnings analysis and introduced banking-cycle risk into what was fundamentally an insurance holding. That business no longer exists.
The completion of the A$4.9 billion bank sale to ANZ on 31 July 2024 left Suncorp as a pure-play general insurer. Earnings visibility improved immediately. The company announced an A$400 million on-market buyback for FY26 (commencing September 2025), a signal of capital surplus and management confidence in the post-divestiture balance sheet.
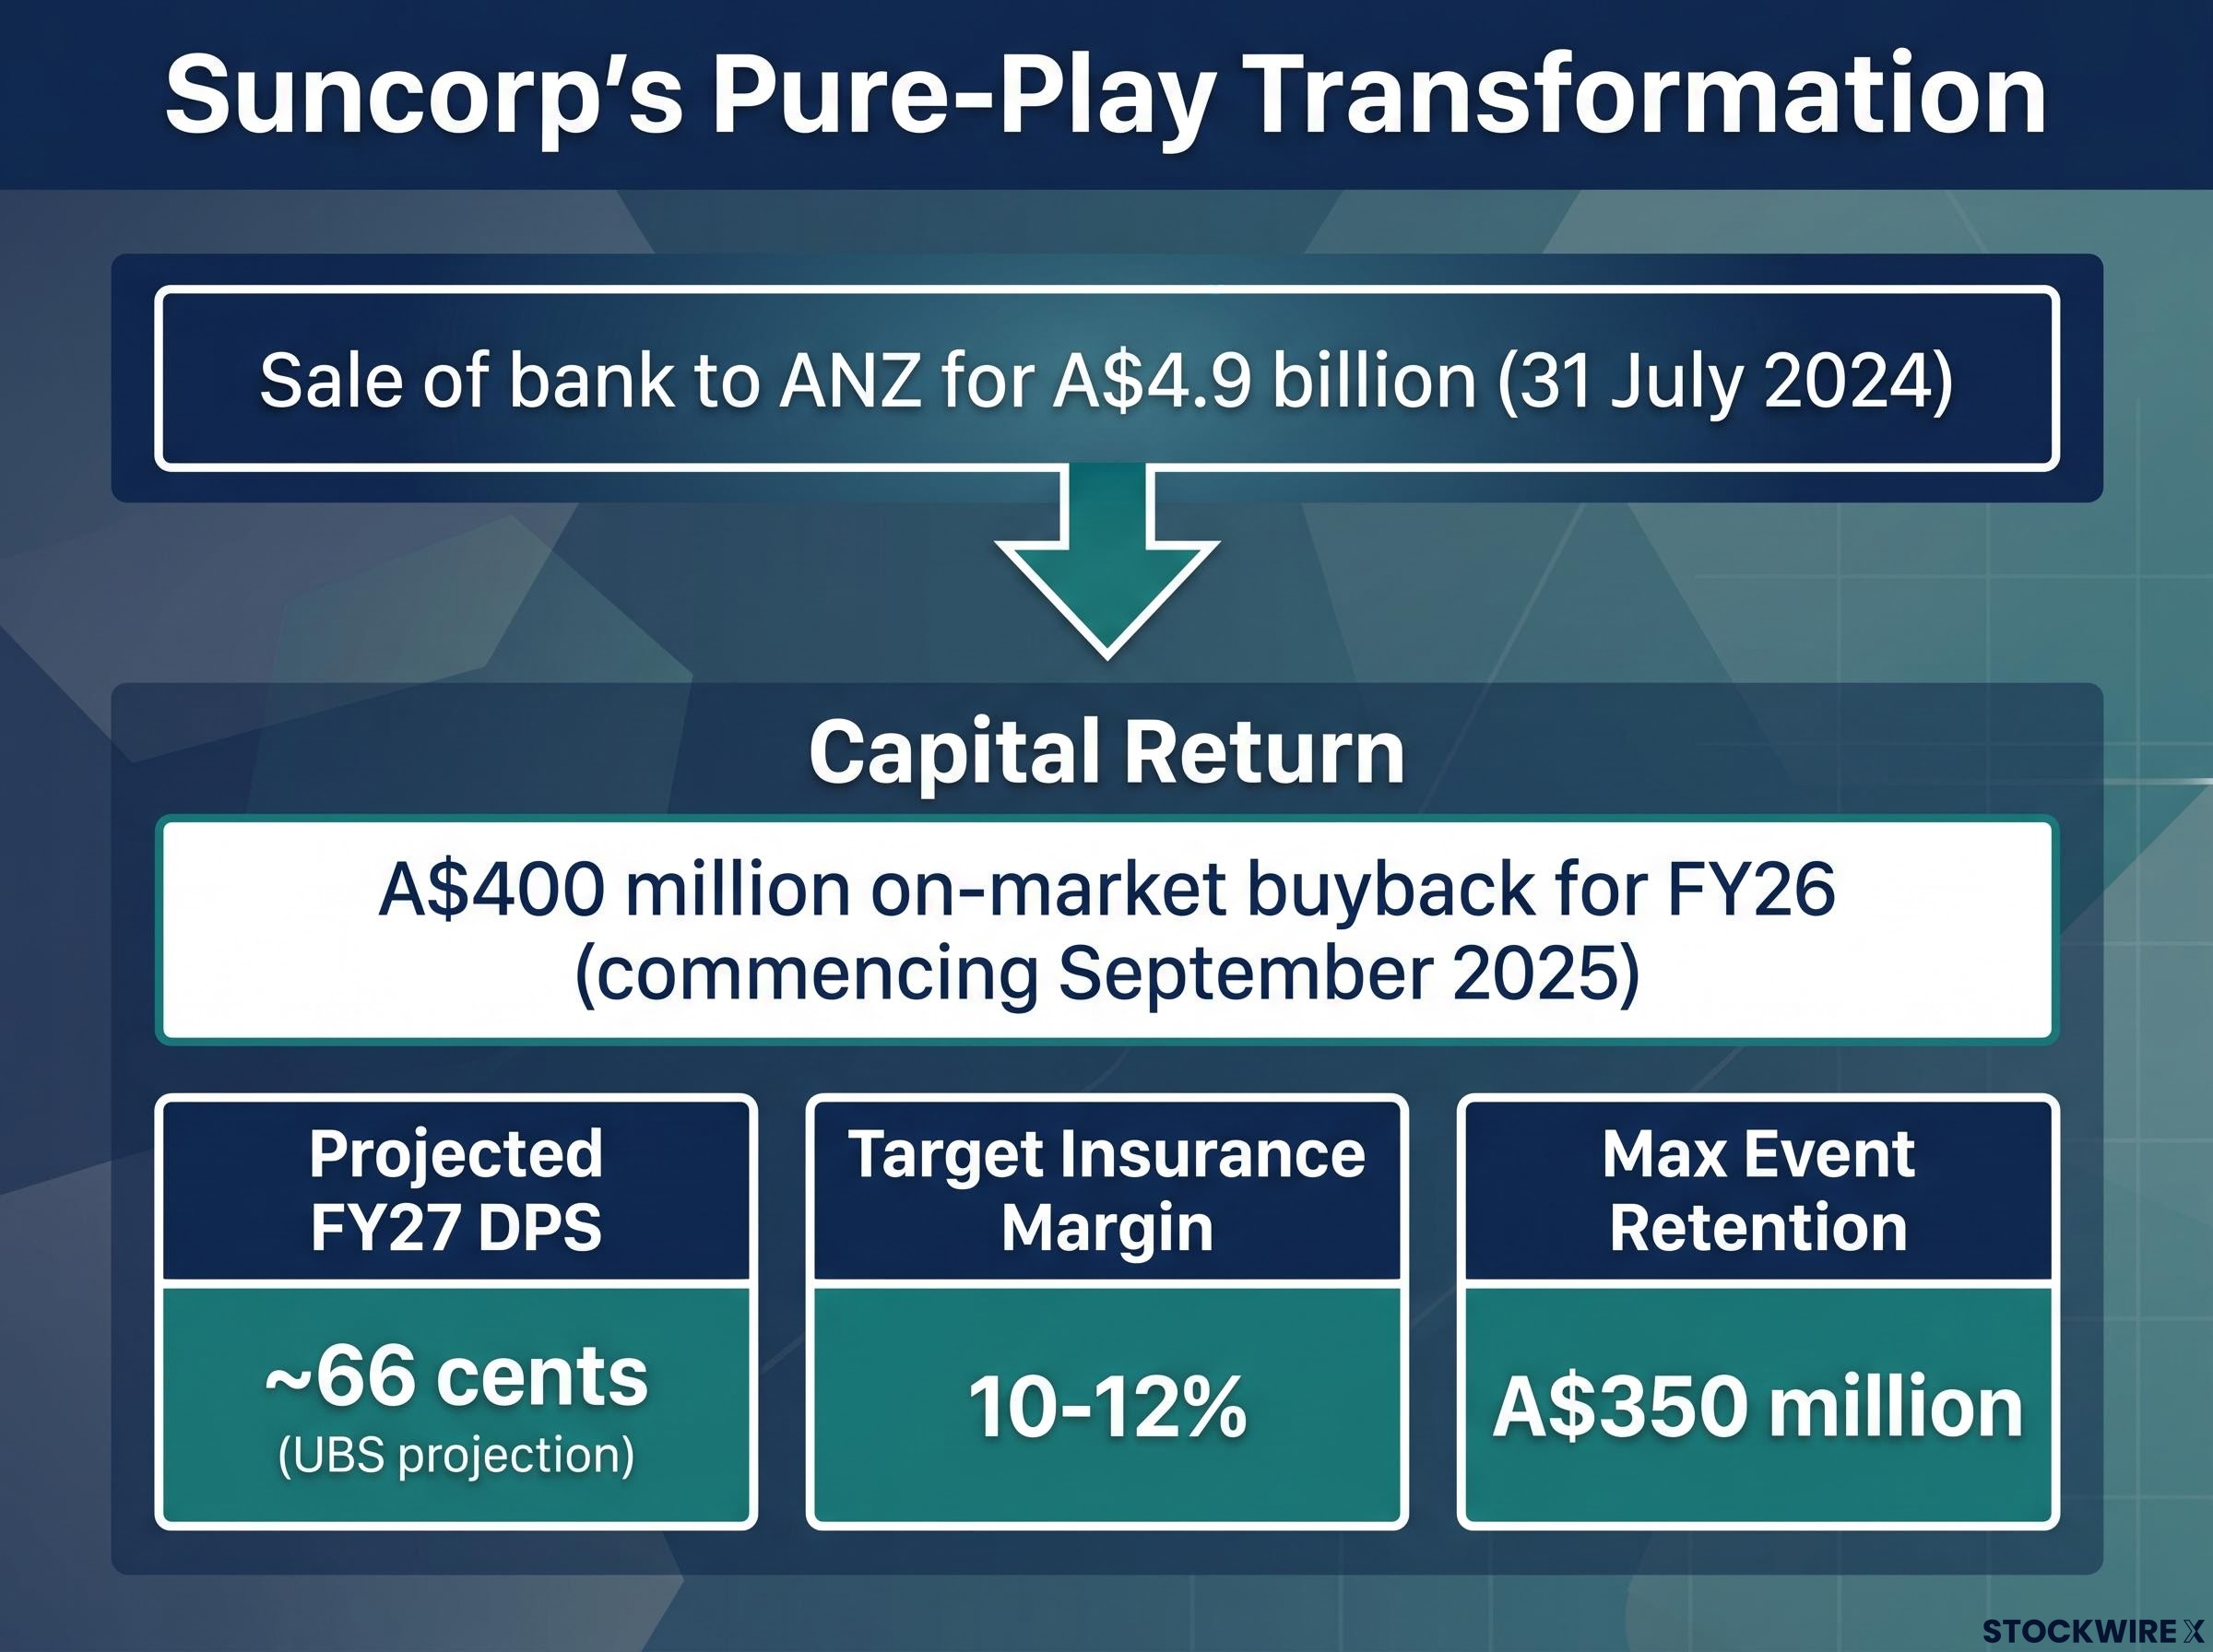
For income-focused investors, the yield profile is the headline. Suncorp’s trailing dividend yield sits at approximately 3.5%, fully franked. UBS projects approximately 66 cents in dividends per share heading into FY27, implying a grossed-up yield approaching 5.5% for eligible Australian taxpayers.
Forward Income Signal UBS projects approximately 66 cents DPS for Suncorp heading into FY27, implying a grossed-up yield of around 5.5% for investors eligible for full franking credit benefits.
Gerrish views Suncorp’s valuation, a P/E of approximately 21-23x, as sitting roughly two points below Insurance Australia Group (ASX: IAG). He considers the discount unwarranted given the post-divestiture business quality, suggesting a potential rerating catalyst.
Reinsurance transfers a portion of catastrophe payout risk away from the insurer. When a major natural disaster strikes, the reinsurer absorbs costs above a specified threshold rather than the insurer bearing the full financial impact.
Suncorp’s FY26 reinsurance programme, renewed in July 2025, reduces maximum event retention to A$350 million per event through multi-year structured cover with profit-sharing. The programme costs less than its FY25 predecessor.
The trade-off is an estimated earnings drag of approximately 2%, according to Market Partners. That is a modest cost for meaningfully reduced exposure to catastrophe-heavy years, and it directly supports the underlying insurance margin target of 10-12%. For investors relying on Suncorp’s dividend stream, the reinsurance programme is less a cost and more a form of income insurance.
Three metrics separate informed insurance stock analysis from headline-yield comparisons. Each is straightforward, and each has a direct bearing on how Suncorp and QBE should be evaluated.
The 30/70 formula that sits behind franking credit calculations means a $1,000 fully franked dividend is worth $1,428.57 to an SMSF in pension phase once the ATO refunds the attached credit as cash, a structural advantage that makes grossed-up yield comparisons far more meaningful than face dividend figures alone.
QBE’s turnaround did not happen in a single quarter. It unfolded across years of portfolio simplification, exits from underperforming lines, and a renewed focus on underwriting discipline. The results now show in the numbers.
GWP grew 7% in FY25. The combined operating ratio dropped to 91.9%, comfortably below guidance. Net insurance revenue rose faster than premiums as earlier repricing earned through the book. The share price responded, reaching closing levels of approximately A$23.50-A$24.60 as of June 2026, with recent peaks near A$24.60, prices not seen in roughly 15-16 years.
Applying blue-chip evaluation metrics including ROE, debt-to-equity, and dividend sustainability together reveals a more complete picture of QBE than any single figure, with QBE’s adjusted ROE of 19.8% in FY25 sitting well above the 10% benchmark used to assess capital efficiency, while analyst expectations for that figure to normalise toward the low-to-mid teens through the cycle underline why buying at multi-year highs requires more than a backward glance at peak returns.
Gerrish frames the turnaround’s trajectory with a candid observation: these recoveries take longer than expected, but once momentum builds, share price appreciation can extend further than anticipated.
Forward Growth Signal QBE’s medium-term target is an adjusted return on equity (ROE) of 15%+, a benchmark that, if achieved, would represent a sustained step-change in the company’s profitability profile.
FY26 COR guidance sits at approximately 92.5%, with mid-single-digit constant-currency GWP growth expected. Earnings growth expectations remain in the high single digits.
The valuation tells its own story. At approximately 12x forward earnings, QBE trades at a material discount to Suncorp’s 21-23x. That gap reflects different growth profiles and the geographic risk premium the market applies to a globally diversified insurer versus a domestic pure-play.
QBE’s FY25 dividend of A$1.09 per share (a 50% payout ratio) implies a yield of approximately 4.5-4.8%, partially franked. The yield is nominally higher than Suncorp’s, but the partial franking narrows the gap on an after-tax basis for Australian investors.
Global rate tailwinds remain supportive of QBE’s earnings trajectory, though they are not guaranteed to persist indefinitely. Buying near multi-year highs requires conviction that execution will continue.
The comparison below is not a verdict. It is a mirror. The right stock depends on where the reader sits: what they need from their portfolio, how much volatility they can absorb, and whether they prioritise income today or growth over a multi-year horizon.
| Metric | Suncorp (SUN) | QBE |
|---|---|---|
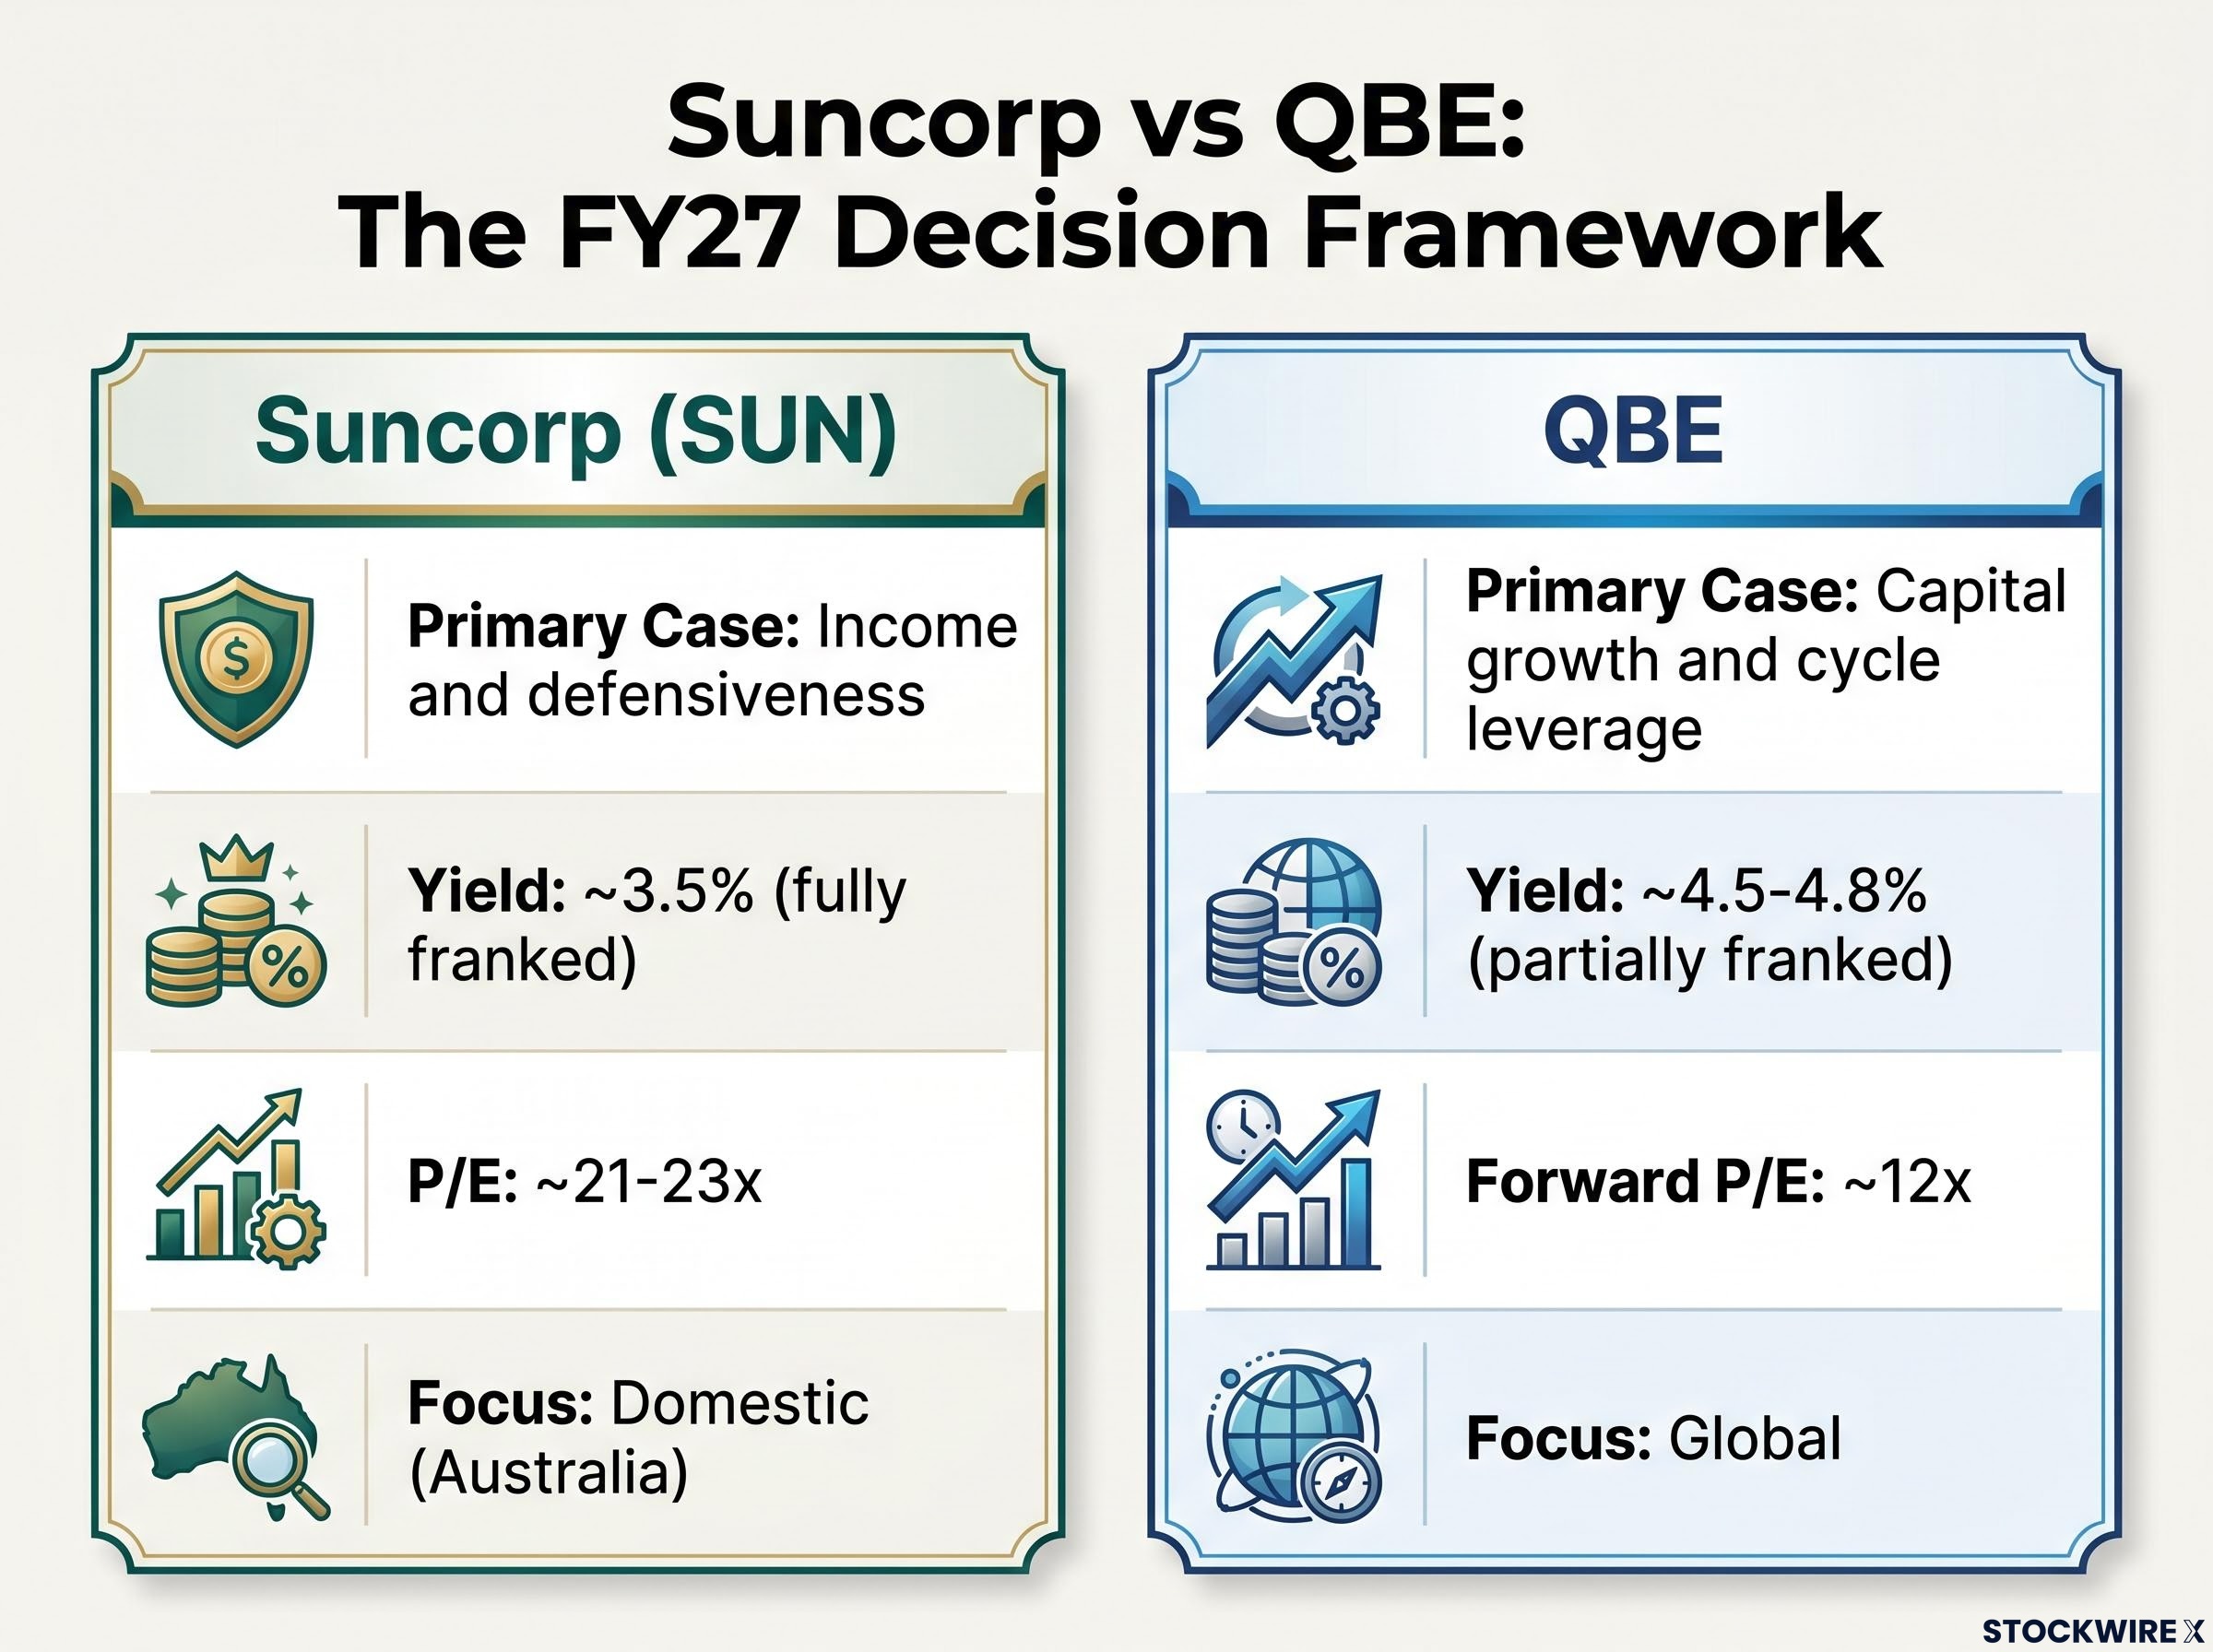
| Primary investment case | Income and defensiveness | Capital growth and cycle leverage |
| Trailing dividend yield | ~3.5% (fully franked) | ~4.5-4.8% (partially franked) |
| P/E (trailing / forward) | ~21-23x | ~12x (forward consensus) |
| Earnings growth outlook | Stable / moderate | High single-digit % |
| Franking | Fully franked | Partial |
| Geographic focus | Domestic (Australia) | Global |
| Business complexity | Lower (pure-play post-divestiture) | Higher (global diversified) |
| Key risk | Catastrophe exposure (mitigated by reinsurance); valuation gap to IAG not closing | Turnaround execution risk; global volatility |
Choose Suncorp if:
Choose QBE if:
Suncorp and QBE are not competing for the same spot in a portfolio. They occupy different roles, and the decision ultimately rests on individual cash-flow needs, time horizon, and risk tolerance.
Investors considering living off ASX dividends will find that the 5.5% grossed-up yield Suncorp is projecting into FY27 sits at the upper end of what a diversified income portfolio typically delivers, with the capital required to fund a $100,000 annual income at that yield sitting at approximately $1.82 million, a figure that contextualises the scale of allocation needed to make dividend income self-sustaining.
Both stocks are operating in a supportive insurance cycle as of June 2026. Conditions can change, and past performance is not indicative of future results. Investors should consider their own financial circumstances and consult with a financial professional before making investment decisions.
This article is for informational purposes only and should not be considered financial advice. Investors should conduct their own research and consult with financial professionals before making investment decisions.
Suncorp is positioned as a domestic, pure-play general insurer offering fully franked dividend income, while QBE is a globally diversified insurer offering capital growth through a multi-year turnaround and exposure to international insurance cycle dynamics.
A combined operating ratio (COR) measures underwriting profitability; a reading below 100% means the insurer is profitable on the policies it writes, and lower is better. QBE reported a COR of 91.9% in FY25, beating its own guidance of approximately 92.5%.
Suncorp pays fully franked dividends, giving eligible Australian investors a grossed-up yield of approximately 5.5% into FY27, while QBE's dividends are only partially franked due to its global earnings base, narrowing the after-tax income gap despite QBE's nominally higher headline yield.
The A$4.9 billion sale of Suncorp's banking arm to ANZ, completed on 31 July 2024, transformed the company into a pure-play general insurer, improving earnings visibility and enabling a A$400 million share buyback as a signal of capital surplus.
QBE's share price reaching approximately A$23.50-A$24.60 as of June 2026 reflects renewed market confidence in its turnaround, but analyst James Gerrish notes that buying near multi-year highs requires conviction that execution will continue, as turnaround recoveries can take longer than expected.