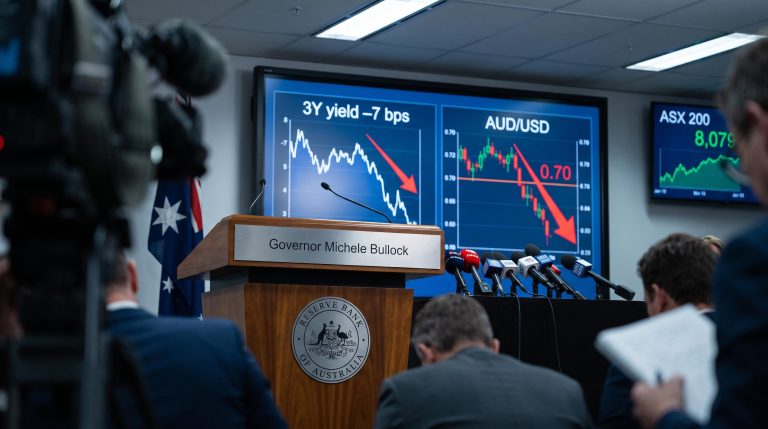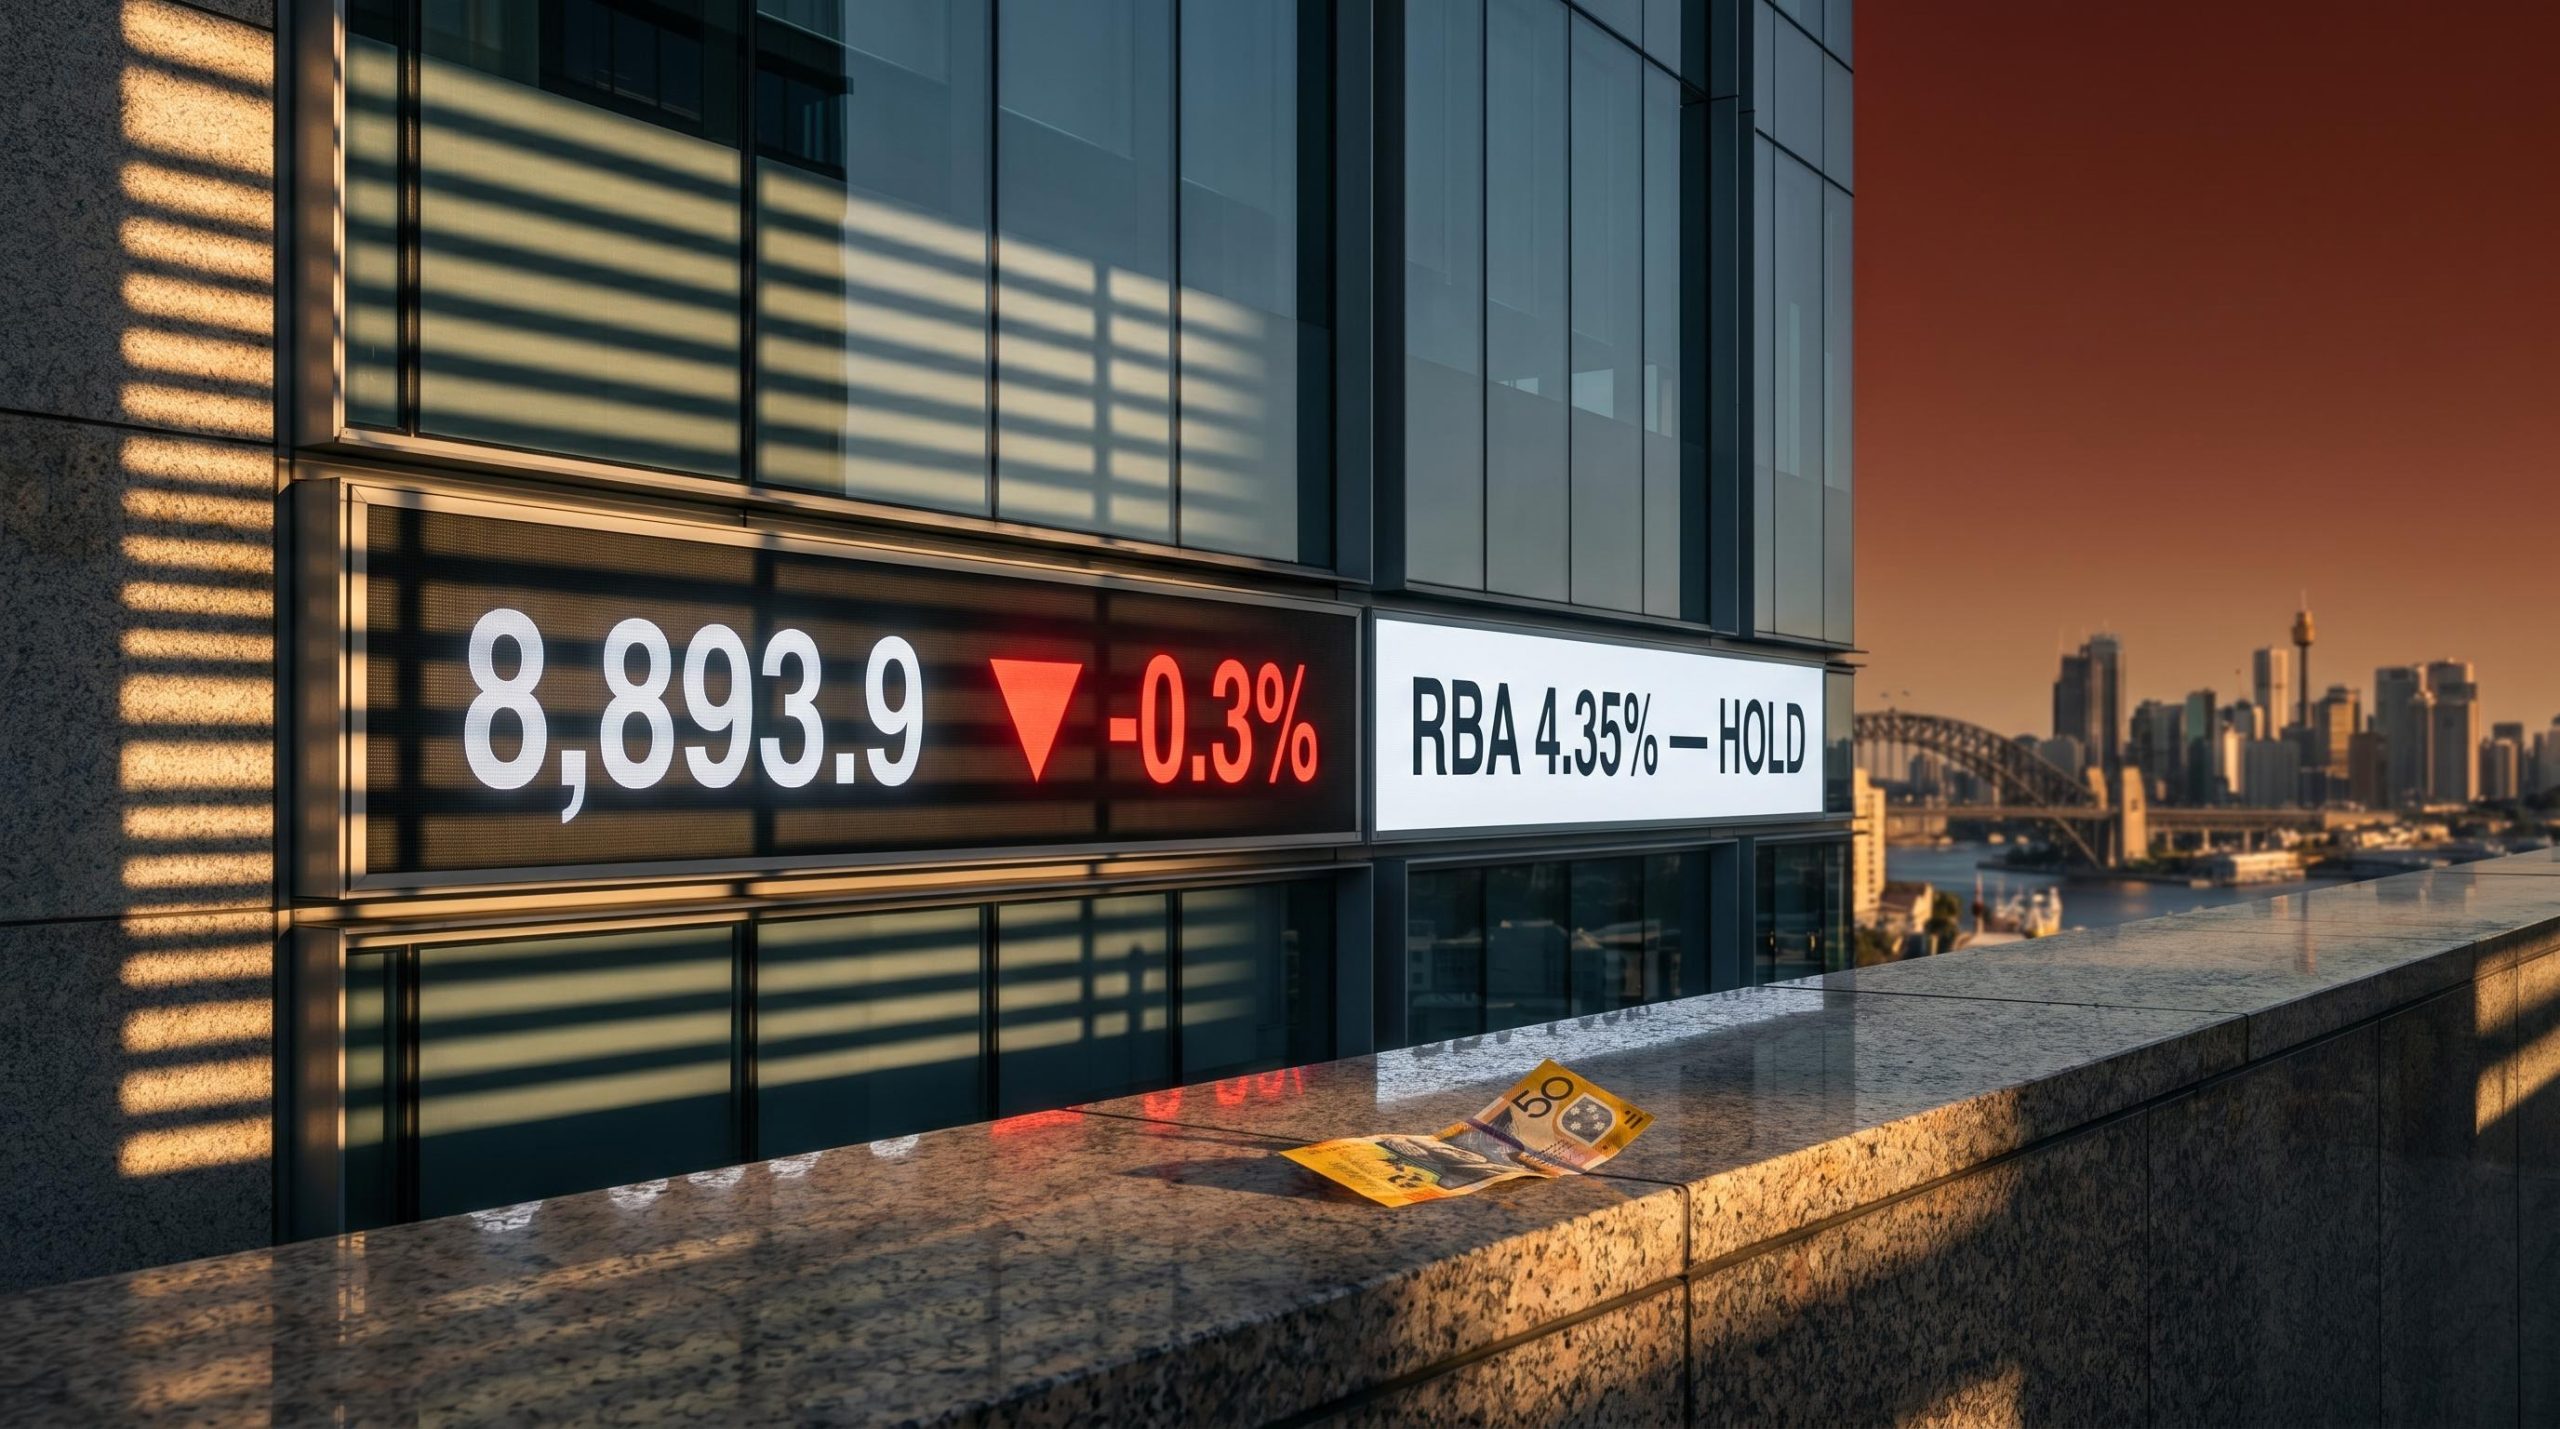
The RBA left its cash rate unchanged on Wednesday, and the S&P/ASX 200 fell anyway. That apparent contradiction is the story of the session. The index dropped 0.3% to 8,893.9 by 10:13am AEST on 18 June 2026, snapping a three-session winning streak that had carried it to a two-month high. The RBA held at 4.35%, exactly as markets expected. The decline was not caused by the decision itself but by the tone of the Board’s statement, which kept further rate hikes on the table and offered nothing to validate hopes of near-term easing. What follows explains why central bank language moves markets even when rates stay put, what the ASX 200’s technical structure signals about near-term risk, and how a simultaneous Federal Reserve decision compounds the pressure on Australian equities.
RBA holds at 4.35% but signals it is not done fighting inflation
The hold was priced in before the announcement. Futures markets had assigned it near-certainty, and no credible forecaster expected a move. The decision itself changed nothing.
The Board’s statement did.
The RBA characterised inflation as persistent and made no attempt to soften the message. Growth is slowing, the Board acknowledged, but the inflation problem has not been resolved to the point where the current rate is guaranteed to be the peak.
Trimmed mean inflation rose to 3.4% in April 2026, above the RBA’s 2-3% target band and trending higher since its June 2025 trough, which explains why the Board’s statement characterised the inflation problem as unresolved and kept further hikes explicitly on the table rather than signalling a clear path toward easing.
The RBA’s June 2026 monetary policy statement confirmed the cash rate hold at 4.35% while explicitly noting that inflation remains elevated and that further tightening has not been ruled out, providing the precise language that repriced rate expectations across Australian equity and bond markets on the day.
The RBA Board noted that inflation remains elevated and sticky, and that further rate increases have not been ruled out if conditions warrant.
That language matters because it explicitly refuses to open the door to an easing cycle. Markets had been pricing in at least one rate cut before year-end. The statement pushed back against that timeline without raising rates, achieving a tightening effect through communication alone.
The gap between the decision (expected, neutral) and the language (hawkish, restrictive) is the gap that produced Wednesday’s sell-off.
When big ASX news breaks, our subscribers know first
Why a rate hold can still push equities lower
Equities are not priced off today’s interest rate. They are priced off where investors expect rates to be over the coming quarters and years. That distinction turns central bank forward guidance into the more powerful market variable, often more consequential than the rate decision itself.
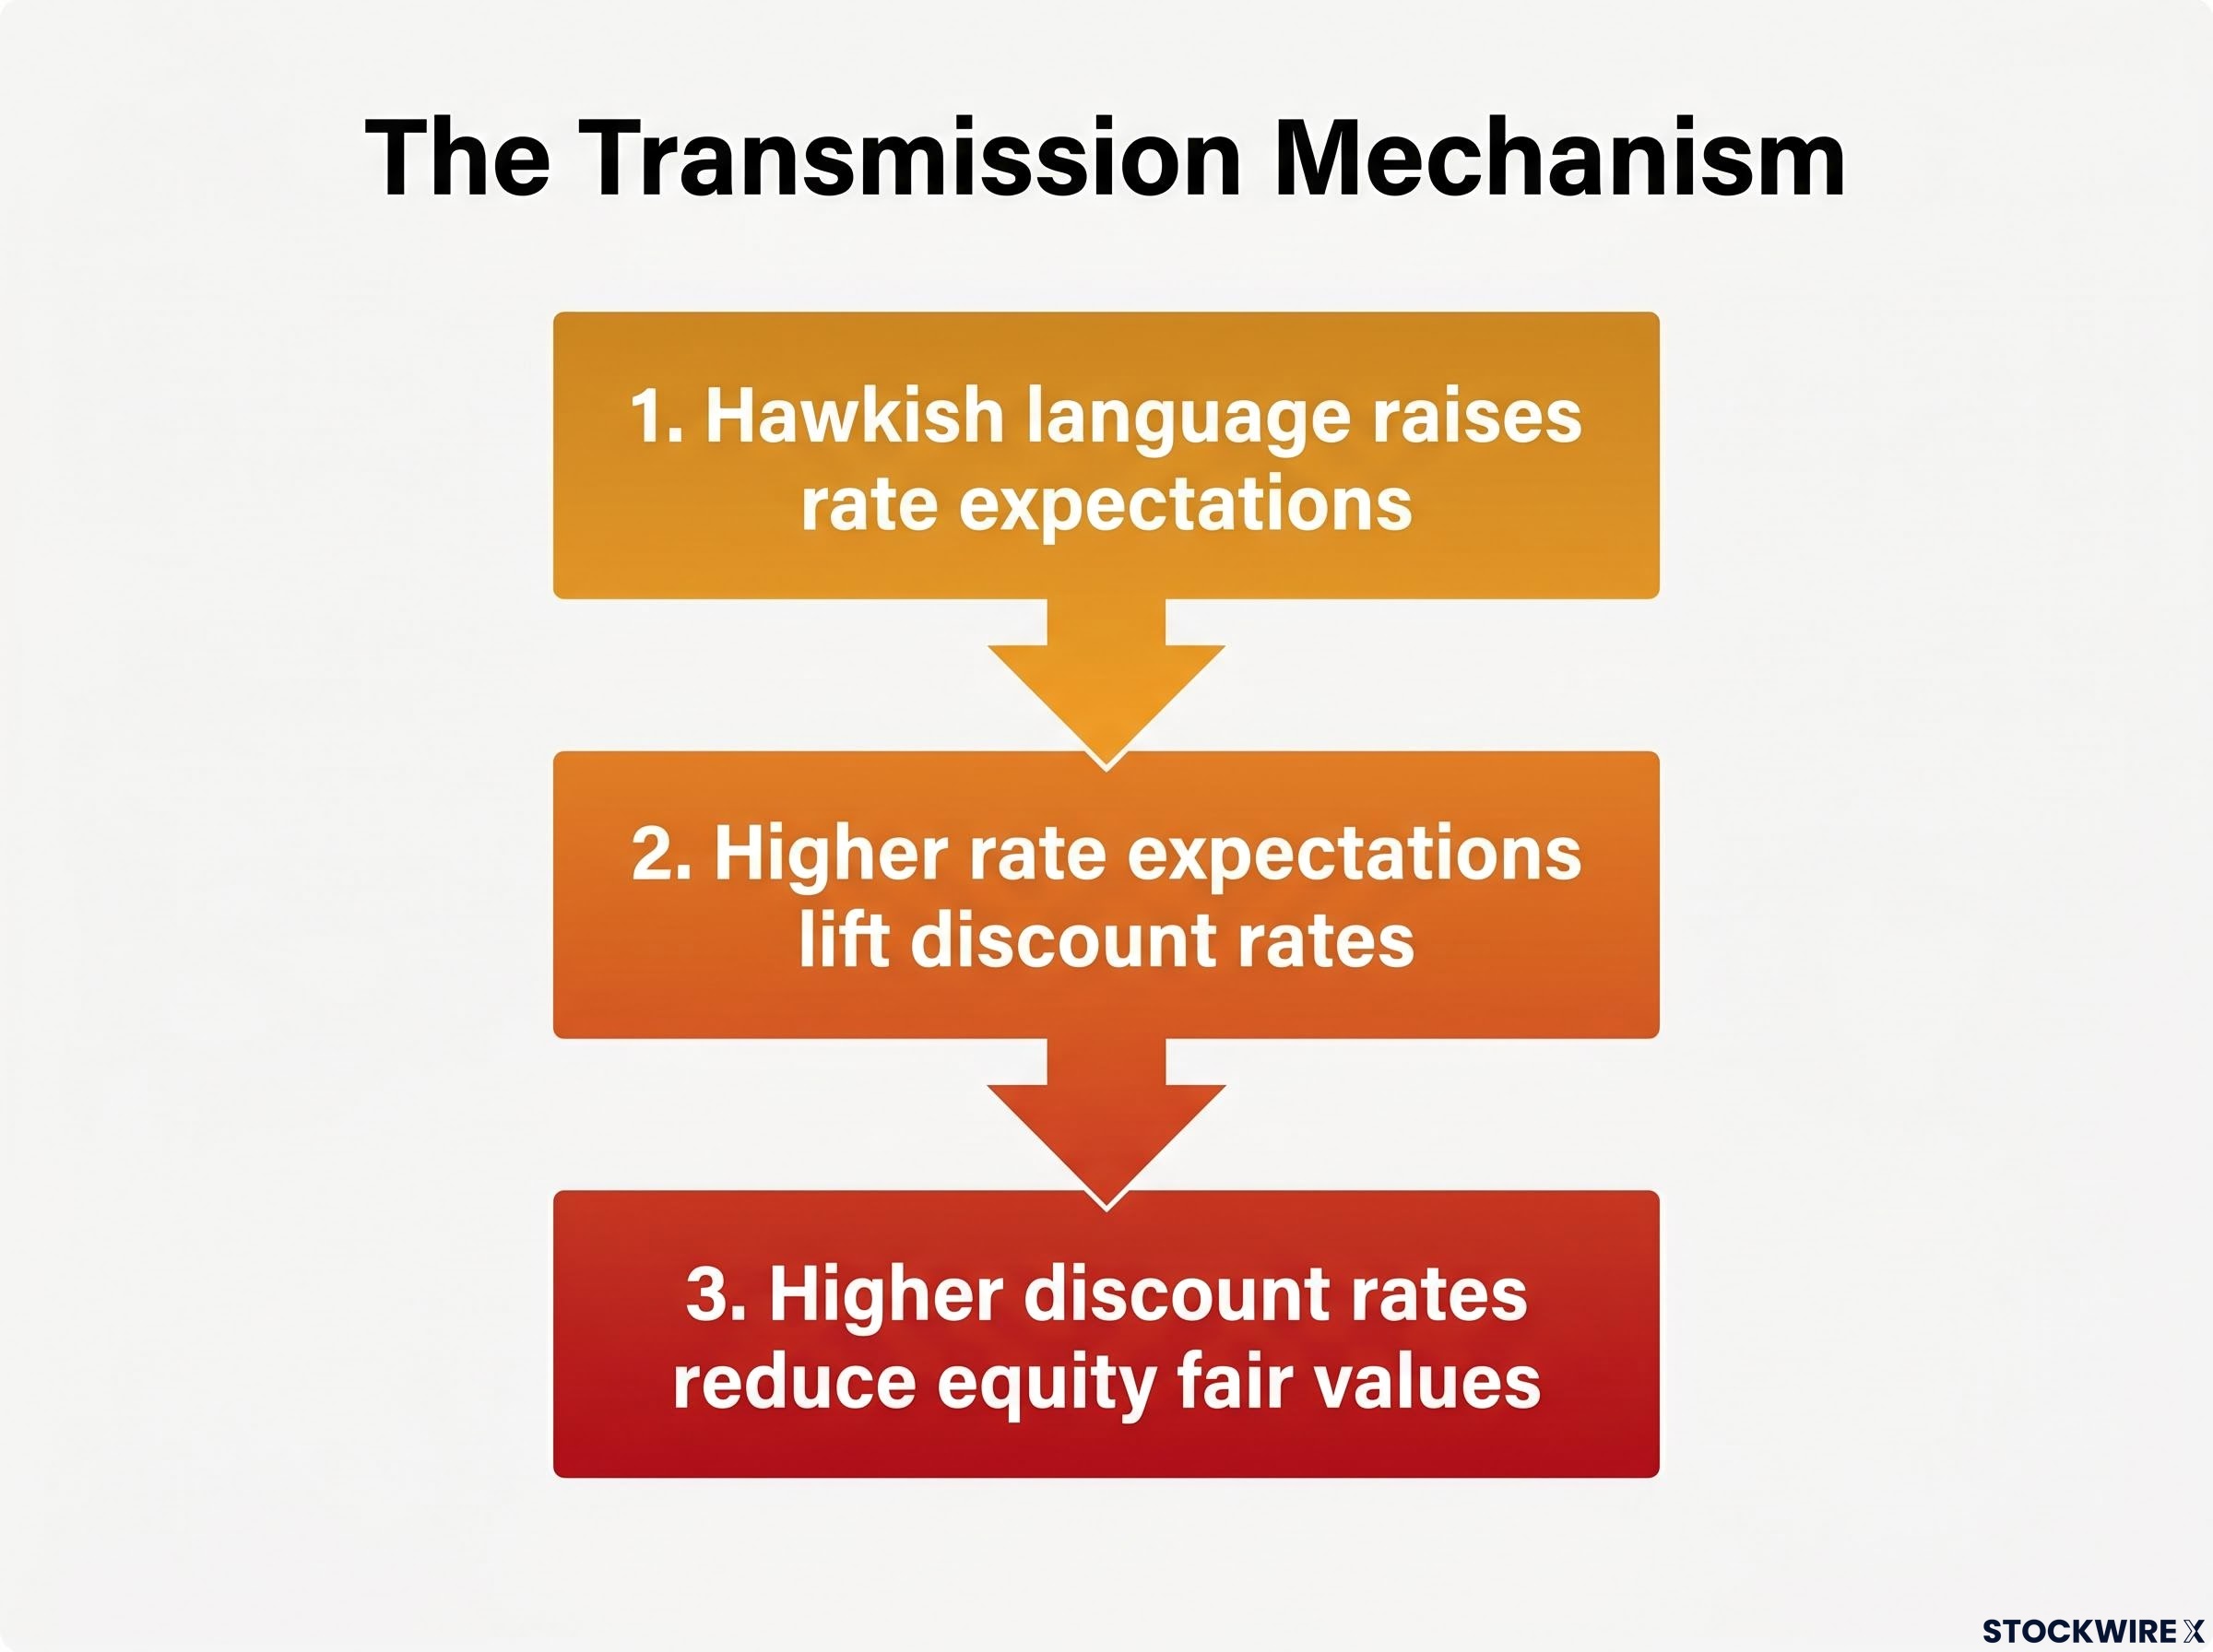
The transmission mechanism works in three steps:
- Hawkish language raises rate expectations. When a central bank signals that rates could rise further, or simply refuses to signal cuts, markets adjust their probability-weighted forecasts for future policy rates upward.
- Higher rate expectations lift discount rates. The rate used to value future corporate earnings moves higher, reflecting the increased cost of capital and the improved returns available from risk-free alternatives.
- Higher discount rates reduce equity fair values. The same stream of expected future earnings is worth less in present-value terms, mechanically lowering the price investors are willing to pay for shares.
This is not a theoretical framework. It played out on the ASX in real time this month.
How this played out in the ASX this week
Earlier in June 2026, the ASX 200 sold off sharply when markets brought forward expectations of the next Fed rate hike. That decline reversed when oil prices fell and rate expectations eased, fuelling a three-session rally to a two-month high heading into Wednesday’s RBA meeting.
The RBA’s statement interrupted that momentum. The 0.3% decline was the market repricing the probability of higher-for-longer domestic rates, applying the same mechanism in the opposite direction to the rally that preceded it.
The Fed compounds the headwind from 14,000 kilometres away
The RBA was not the only central bank delivering a hawkish hold. The Federal Reserve, under new Chair Kevin Warsh, held the federal funds rate at 3.50-3.75% but revised its median year-end 2026 dot plot higher, signalling that its restrictive stance would persist longer than markets had anticipated.
Warsh’s June statement ran just 130 words with forward guidance eliminated entirely, a deliberate reversal of two decades of Fed communication practice, which means the dot plot revision rather than the statement language became the primary signal markets used to reprice rate expectations after the decision.
ASX 200 futures had already pointed to a weaker open following the Fed’s dot plot revision, meaning the RBA decision landed into a market that was already softened by the global rate outlook.
| Central Bank | Decision | Rate Level | Forward Signal |
|---|---|---|---|
| RBA | Hold | 4.35% | Further hikes not ruled out |
| Fed | Hold | 3.50-3.75% | Dot plot revised higher |
A more hawkish Fed supports the US dollar and lifts global bond yields, both headwinds for Australian equities and the Australian dollar. The RBA and Fed are now both operating in hawkish-hold mode simultaneously. That dual posture explains why the pullback occurred at a technically sensitive level rather than being absorbed as routine noise.
What the ASX 200’s technical structure says about near-term risk
The pullback registers as a consolidation within an ongoing recovery, not a trend reversal. The index continues to trade above its principal moving averages, and the broader structure built off the rebound from the mid-8,400s remains intact.
ASX constituent-level damage has run significantly deeper than the headline index suggests, with 84.5% of ASX 200 members trading at least 10% below their 52-week highs as recently as May 2026, a divergence driven by capitalisation-weighting that allows mega-caps to anchor the index while rate-sensitive sectors sustain widespread drawdowns of 30-50% from their peaks.
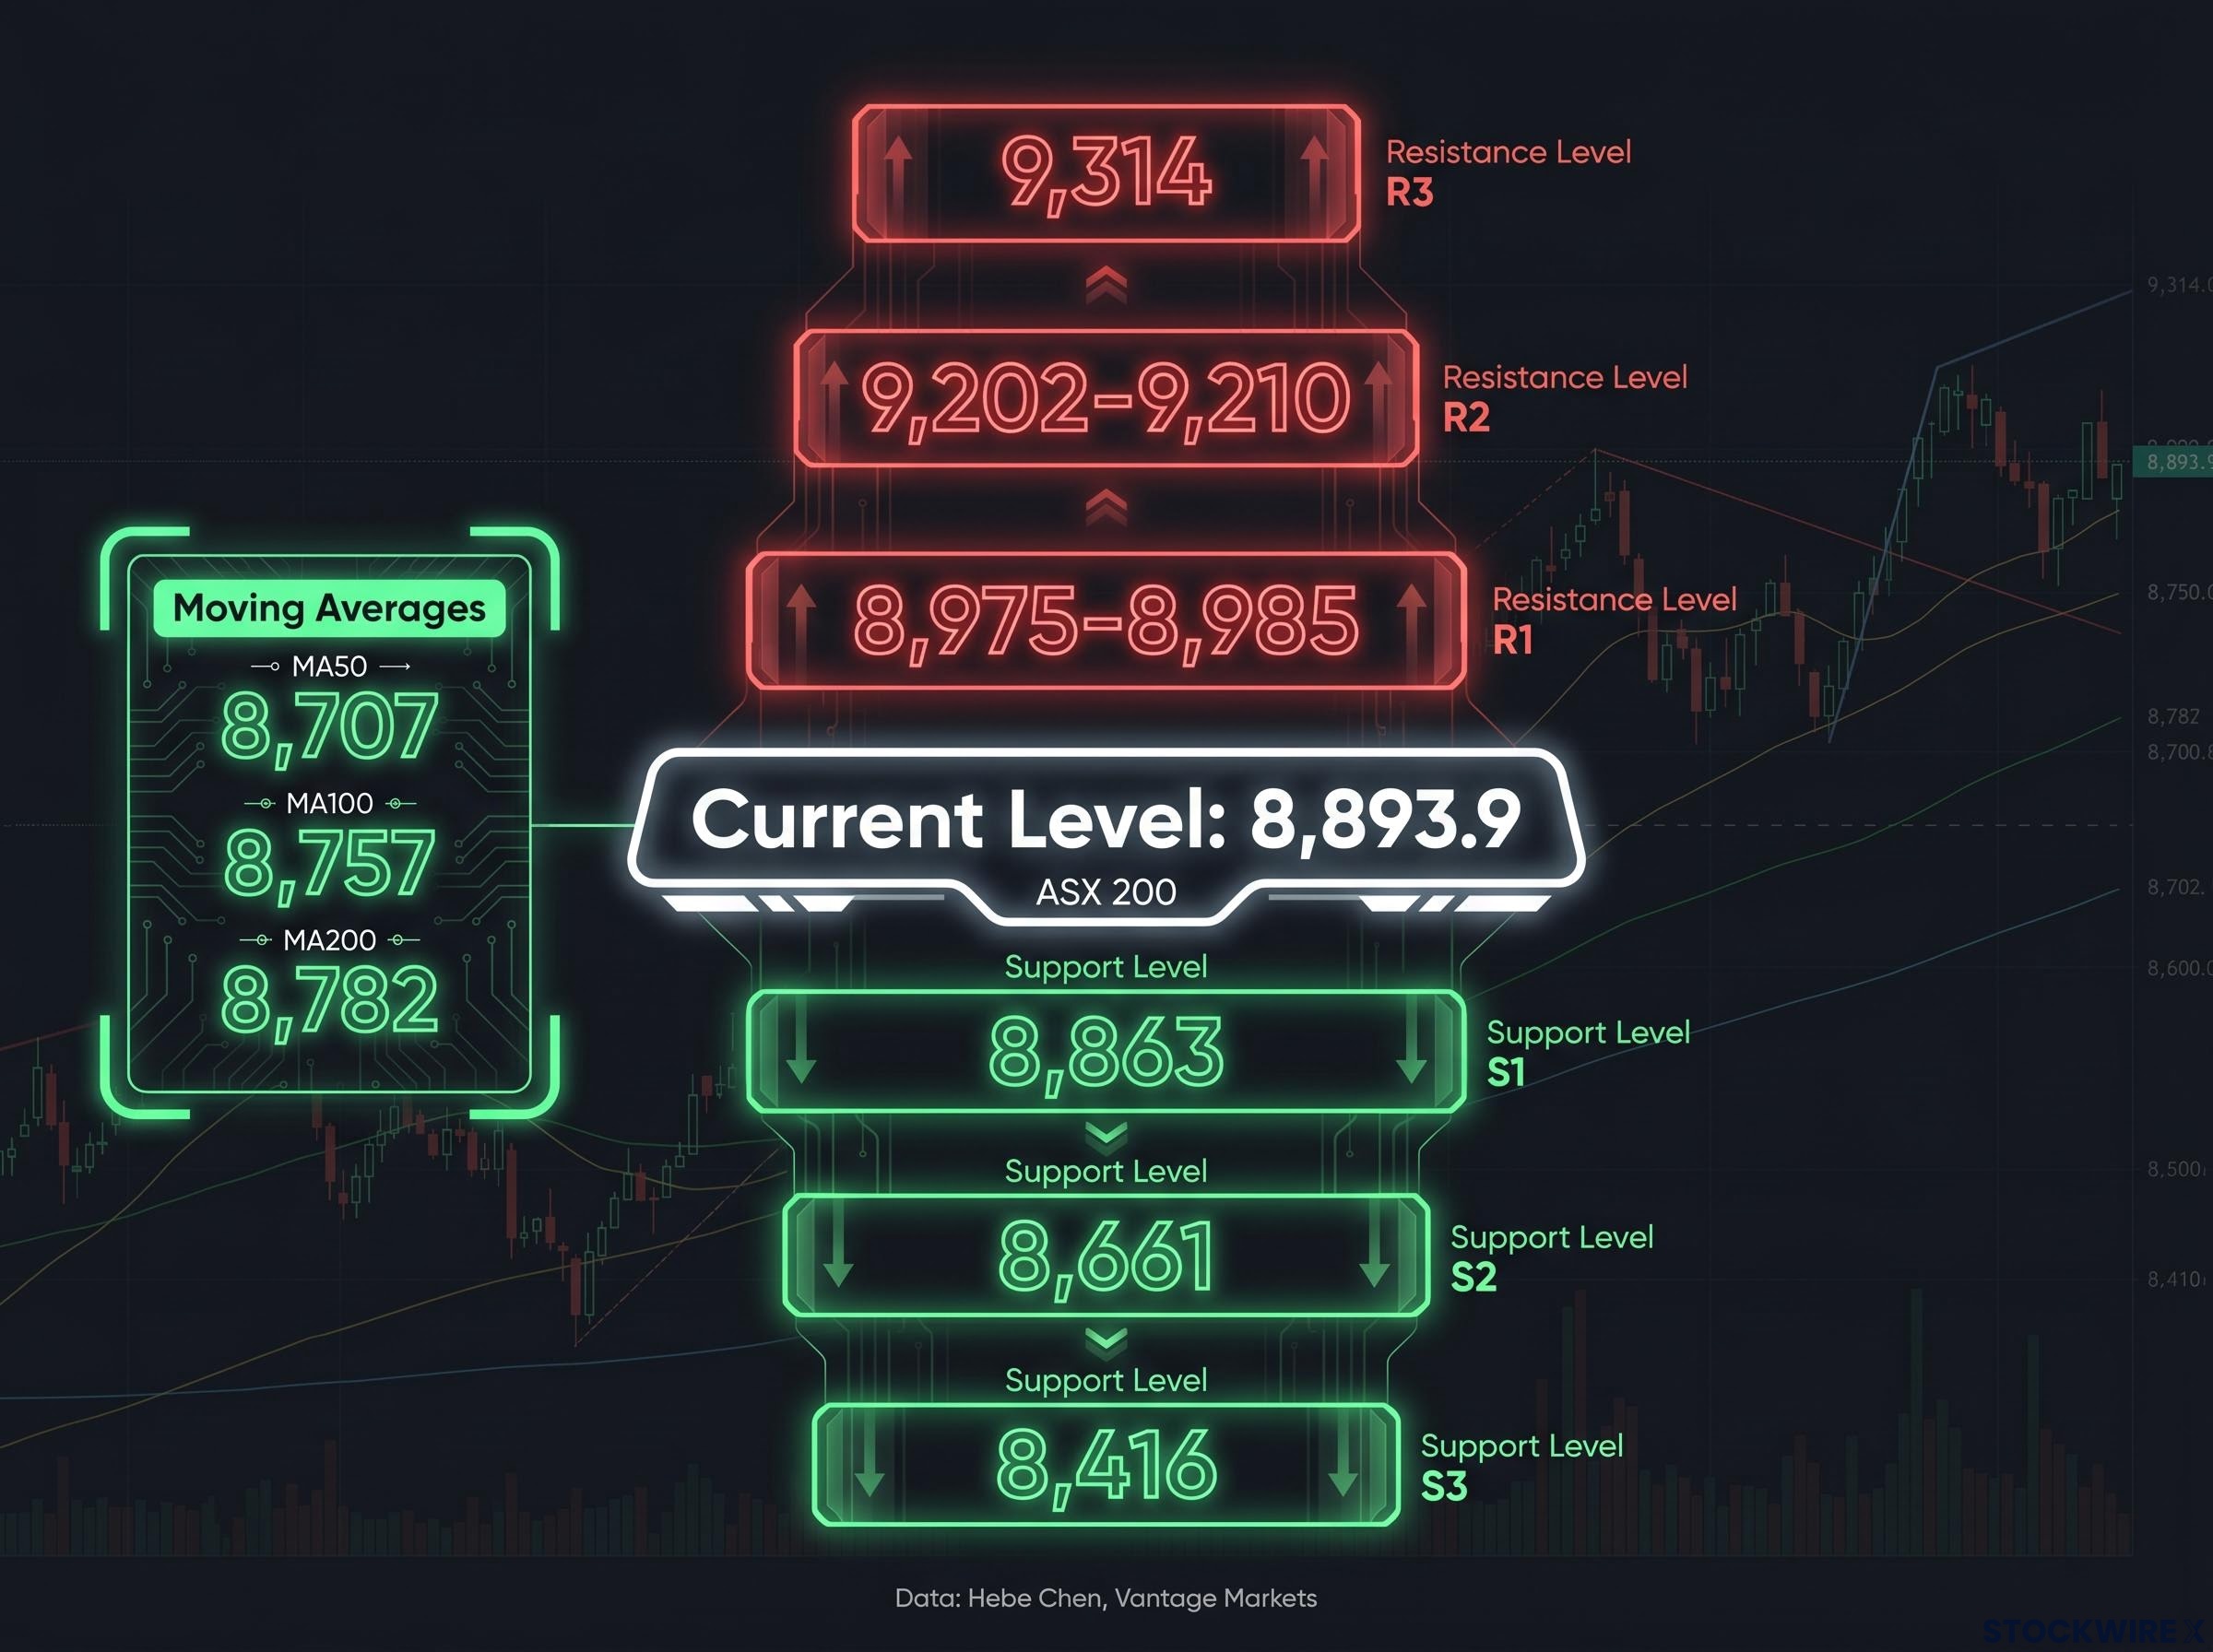
According to Hebe Chen, Senior Market Analyst at Vantage Markets, the specific levels framing near-term risk are:
Support levels:
- 8,863: near-term support
- 8,661: the next tier; a breach here shifts focus materially lower
- 8,416: medium-term support if 8,661 fails
Resistance levels:
- 8,975-8,985: immediate resistance
- 9,202-9,210: additional resistance
- 9,314: further resistance above
The moving average cluster at 8,707, 8,757, and 8,782 provides a structural floor beneath the current price, reinforcing the recovery thesis as long as the index holds above those levels.
The 8,600s region functions as the line in the sand for the medium-term recovery. A clean break below the mid-8,600s would increase downside risk materially and validate a more defensive posture.
The difference between 8,863 holding and 8,661 breaking is the difference between a brief pause in a recovery and a reassessment of whether the recovery is intact at all.
The triggers that will determine whether this pullback deepens or reverses
Rather than waiting passively for the next scheduled central bank meeting, investors can monitor a specific set of data points and price levels that will shape the near-term direction:
- RBA rhetoric shift. Board minutes and member speeches are the near-term communication channels to watch. Any pivot toward emphasising downside growth risks over upside inflation risks would be the first signal toward a genuine policy shift.
- Australian CPI trajectory. Sustained easing in consumer prices would reduce pressure on the Board to maintain its current posture and bring rate-cut expectations forward.
- Fed communications. Further dot plot commentary and public remarks from Chair Kevin Warsh on the balance of risks will shape global rate expectations.
- US payrolls and inflation data. Softening in either would increase the probability that the Fed moves from guarded to accommodative, a tailwind for global equities including the ASX.
- Oil price direction. Falling oil has been a tailwind for both inflation expectations and risk sentiment in recent weeks. A renewed spike would complicate the outlook for both central banks.
- Technical trigger levels. The price chart offers a binary framework for positioning.
For investors wanting to monitor the CPI trajectory that will determine whether the RBA’s posture shifts, our dedicated guide to Australia’s inflation trajectory examines the structural components driving persistent inflation above the 2-3% target band, including the 25.4% annual surge in electricity costs and the broad-based nature of price increases across roughly two-thirds of tracked CPI items.
The technical binary to watch
The ASX 200 holding above 8,661 preserves the recovery thesis. A confirmed close below that level shifts attention to 8,416 and validates a more defensive posture.
On the upside, a break above 8,975-8,985 on rising volume would signal that the consolidation is complete and the uptrend is resuming.
The RBA’s tone has done its job, but the next move depends on the data
Wednesday’s 0.3% decline, measured against the three-session rally that preceded it, reflects a market adjusting expectations rather than abandoning the recovery thesis. The index remains above its principal moving averages. The broader technical structure holds.
Both the RBA and the Fed are now operating in a data-dependent mode where language does the work that rate changes once did. That makes every inflation print, every payrolls release, and every shift in Board rhetoric a potential catalyst.
Rate decisions move markets less than rate expectations, and expectations are shaped by language.
The conditions that would shift the outlook are specific: sustained inflation easing opens the door to a genuine RBA pivot; continued stickiness keeps the current posture in place. For investors parsing the next central bank statement, the lesson from today is to read past the headline decision and into the sentence structure beneath it.
This article is for informational purposes only and should not be considered financial advice. Investors should conduct their own research and consult with financial professionals before making investment decisions. Past performance does not guarantee future results, and forward-looking statements regarding central bank policy are subject to change based on evolving economic conditions.