Australia’s headline inflation rate eased to 4.2% in the twelve months to April 2026, down from 4.6% in March. The number looks like relief. It is not the full story. In March, automotive fuel prices surged 32.8% in a single month, the most extreme monthly fuel spike in the Australian Bureau of Statistics (ABS) dataset’s recent history, driven by Middle East conflict-driven oil price volatility. The federal government’s decision to halve the fuel excise effective 1 April 2026 then pulled prices partially back in April. Two forces, one geopolitical and one fiscal, collided inside a single inflation print. What follows unpacks what the headline conceals: why the trimmed mean tells a different story from the Consumer Price Index (CPI), what diesel doing the opposite of petrol reveals about supply chains, and why transport inflation at 6.6% annually still understates the pressure on freight-dependent sectors.
Headline CPI eased in April, but the monthly journey tells a different story
The ABS released its monthly CPI indicator on 27 May 2026, and the deceleration was immediate in the headline: annual all-groups CPI fell from 4.6% in March to 4.2% in April. Seven of eleven expenditure groups recorded slower annual growth in April compared with March.
The monthly movement told a quieter version of the same story. Prices rose 0.4% in April, a fraction of the 1.1% surge recorded in March. That March figure had been the sharpest single-month acceleration in over a year.
But zoom out further, and the relief thins. In April 2025, annual CPI sat at 2.4%. Twelve months later, it has nearly doubled.
- Annual all-groups CPI: 4.2% to April 2026, down from 4.6% to March 2026
- Monthly CPI movement: +0.4% in April, compared with +1.1% in March
- April 2025 baseline: 2.4% annual CPI
Sue-Ellen Luke, ABS Head of Prices Statistics, released the April 2026 monthly CPI indicator on 27 May 2026.
The easing is real, but it is not a return to the pre-conflict cost environment. Readers tracking mortgage costs, inflation-linked assets, or Reserve Bank of Australia (RBA) rate expectations should treat this as a partial reversal, not a resolution.
When big ASX news breaks, our subscribers know first
How a conflict halfway around the world delivered a 32.8% monthly fuel shock
The transmission chain runs in a straight line. Middle East conflict disrupted oil supply routes and lifted Brent crude prices. Australian wholesale fuel distributors, who price off international benchmarks with a retail lag of roughly two to four weeks, passed the increase through. By March, it had arrived at the bowser.
The IEA’s characterisation of Middle East geopolitical tension as a structural inflation risk rather than a transient spike means the risk premium embedded in current oil prices is expected to decompress slowly over months, not unwind quickly, a dynamic that shapes the persistence of cost pressures across every freight-dependent and energy-intensive sector in the Australian economy.
The result was a 32.8% monthly surge in automotive fuel prices in March 2026. The movement was severe enough that the ABS excluded automotive fuel from the trimmed mean calculation in both March and April, a statistical flag reserved for the most extreme price swings in either direction.
April brought a partial reversal. Fuel prices fell 7.0% month-on-month. But even after that decline, fuel remained 23.5% above its February 2026 pre-conflict level. The headline improved; the underlying cost shock did not unwind.
| Period | Monthly Movement | Annual Movement | Vs February 2026 Baseline |
|---|---|---|---|
| February 2026 (baseline) | — | — | 0.0% |
| March 2026 | +32.8% | +24.2% | +32.8% |
| April 2026 | -7.0% | +18.6% | +23.5% |
That 23.5% gap above pre-conflict levels is the number that matters most for consumers and businesses with direct fuel-cost exposure.
What the fuel excise halving did, and did not, fix
The federal government halved the fuel excise effective 1 April 2026. The mechanism is straightforward:
- What the cut does mechanically: The excise is a fixed per-litre tax applied at the wholesale level. Halving it reduces the tax component of each litre sold, lowering the retail price by a roughly equivalent amount, assuming retailers pass the saving through.
- Why its effect varies by fuel type: The excise applies uniformly, but the underlying wholesale price of each fuel type moves independently based on global refining margins and supply-demand dynamics. A fuel whose wholesale price is rising sharply can absorb the excise relief entirely.
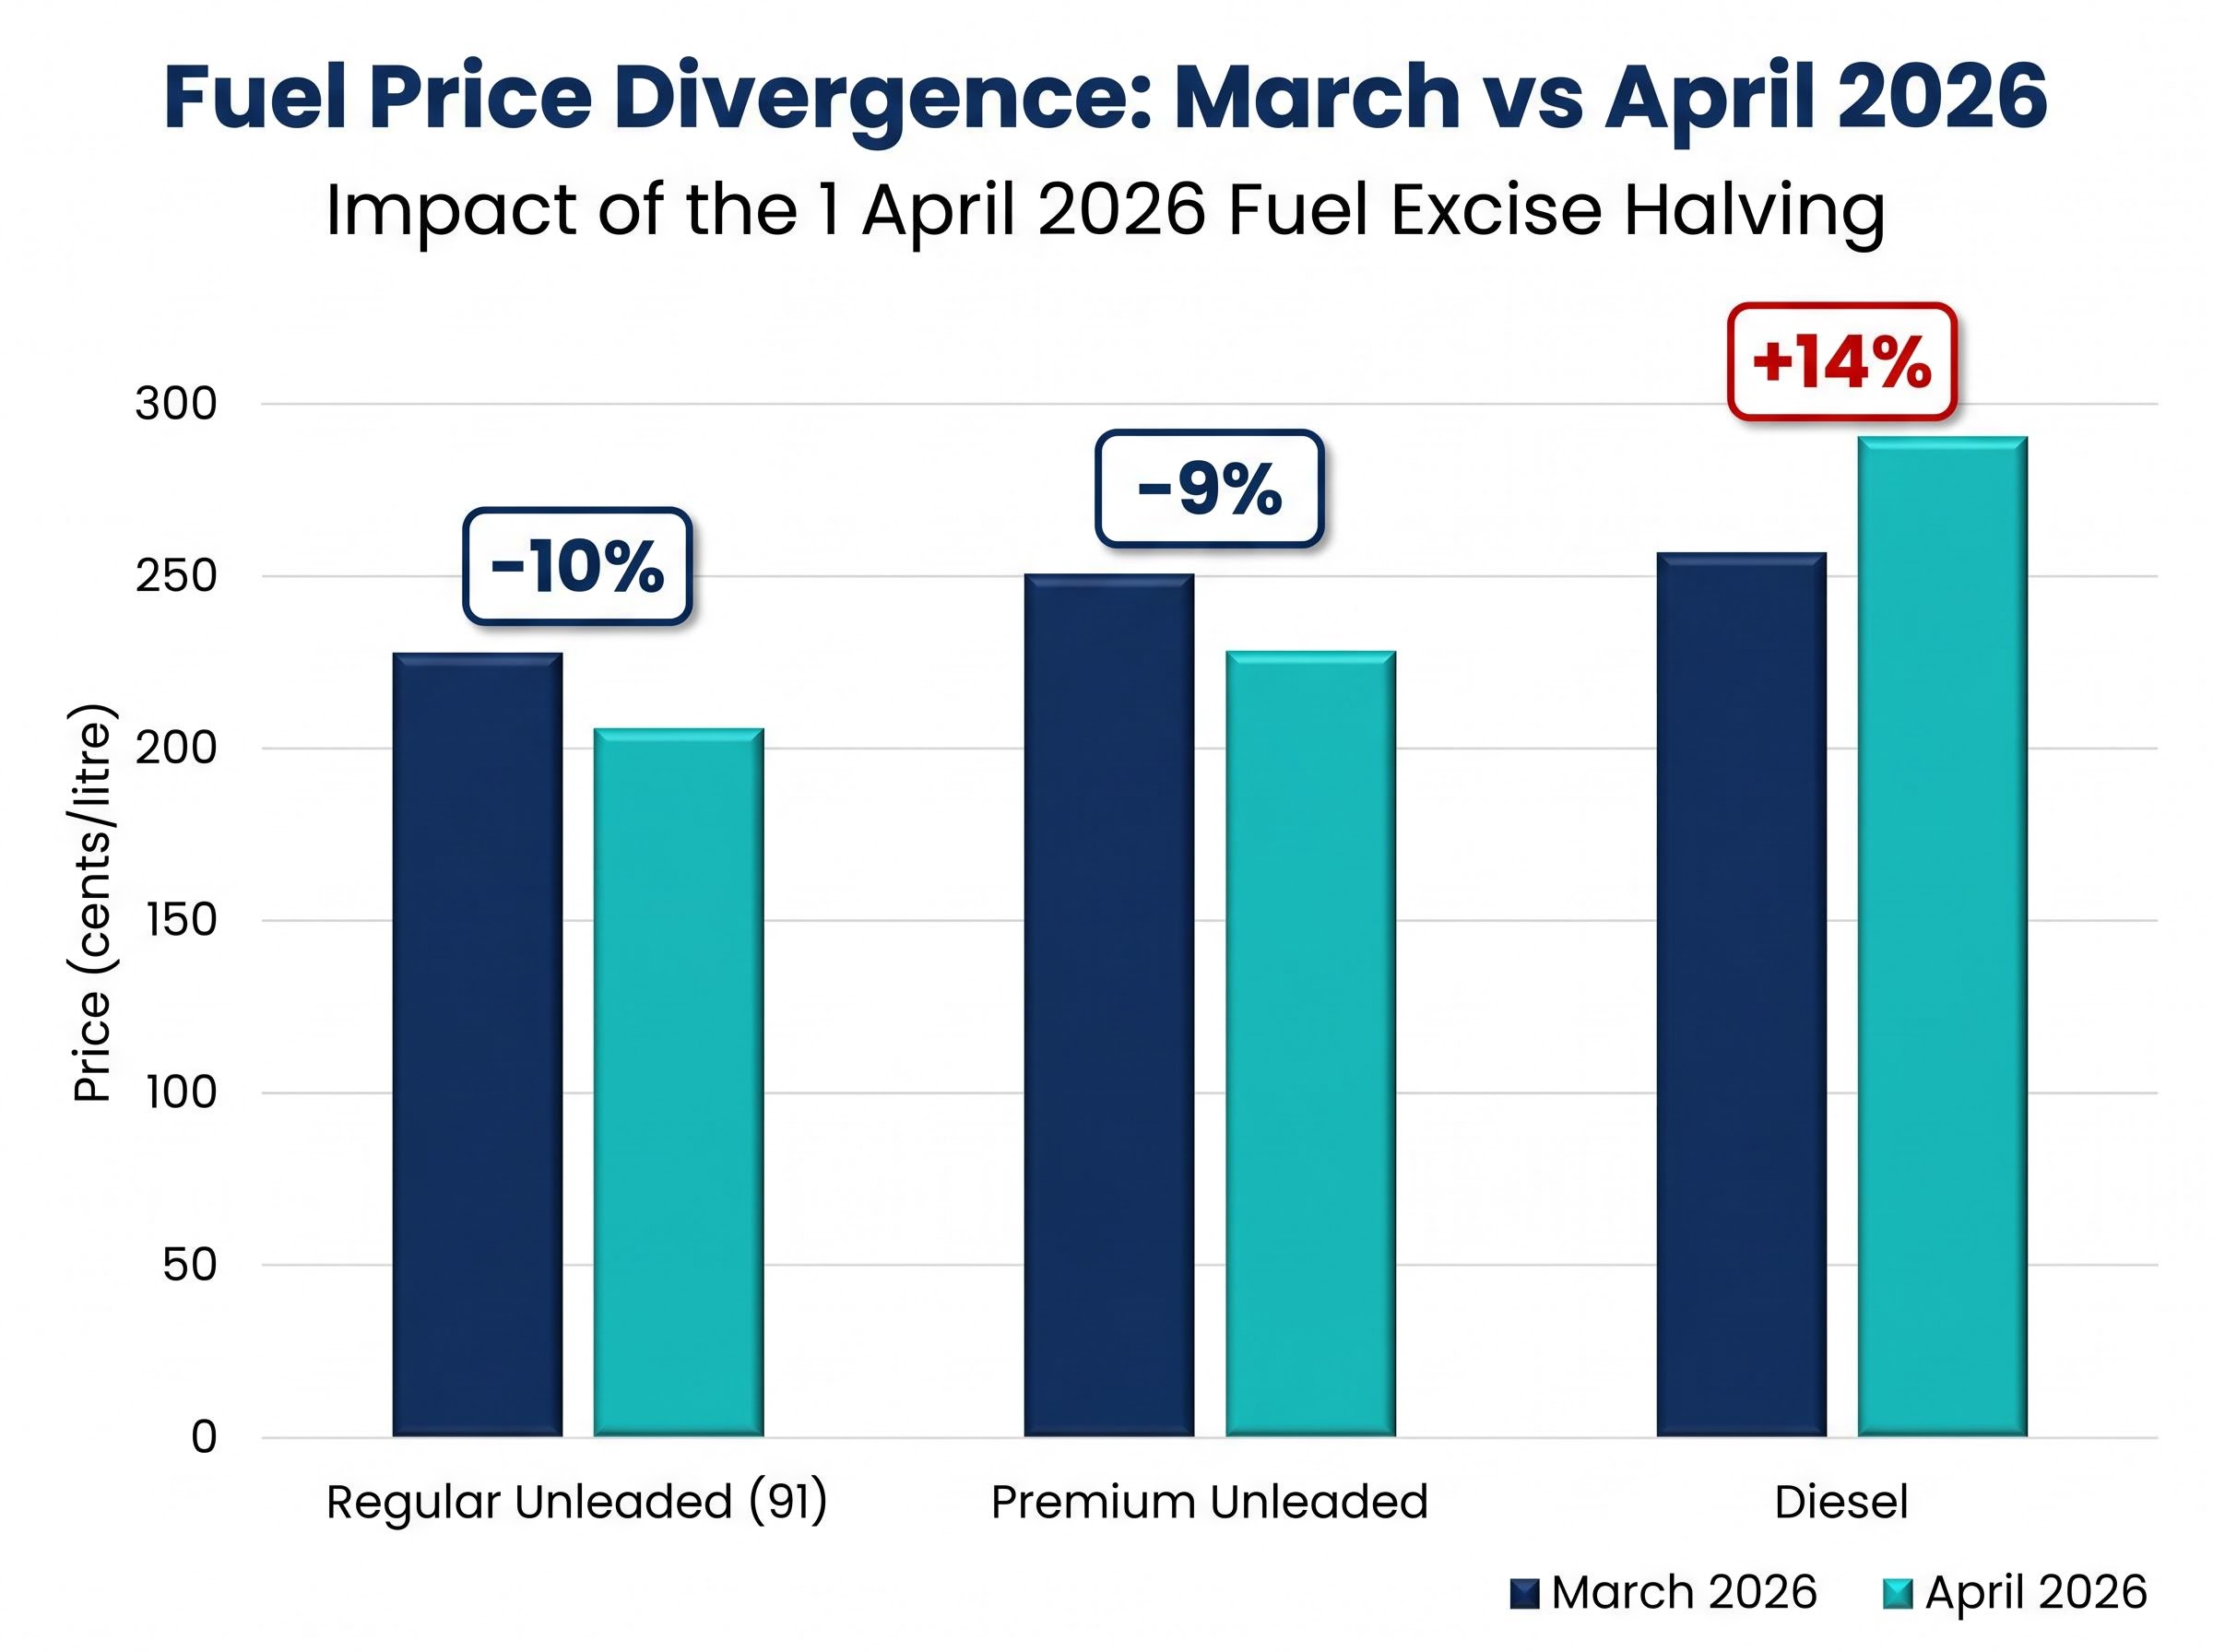
That second point explains April’s split outcome. Regular unleaded petrol (91 octane) fell from approximately 228 cents per litre in March to approximately 206 cents per litre in April, a decline of roughly 10%. Premium unleaded dropped to approximately 228 cents per litre, around 9% lower.
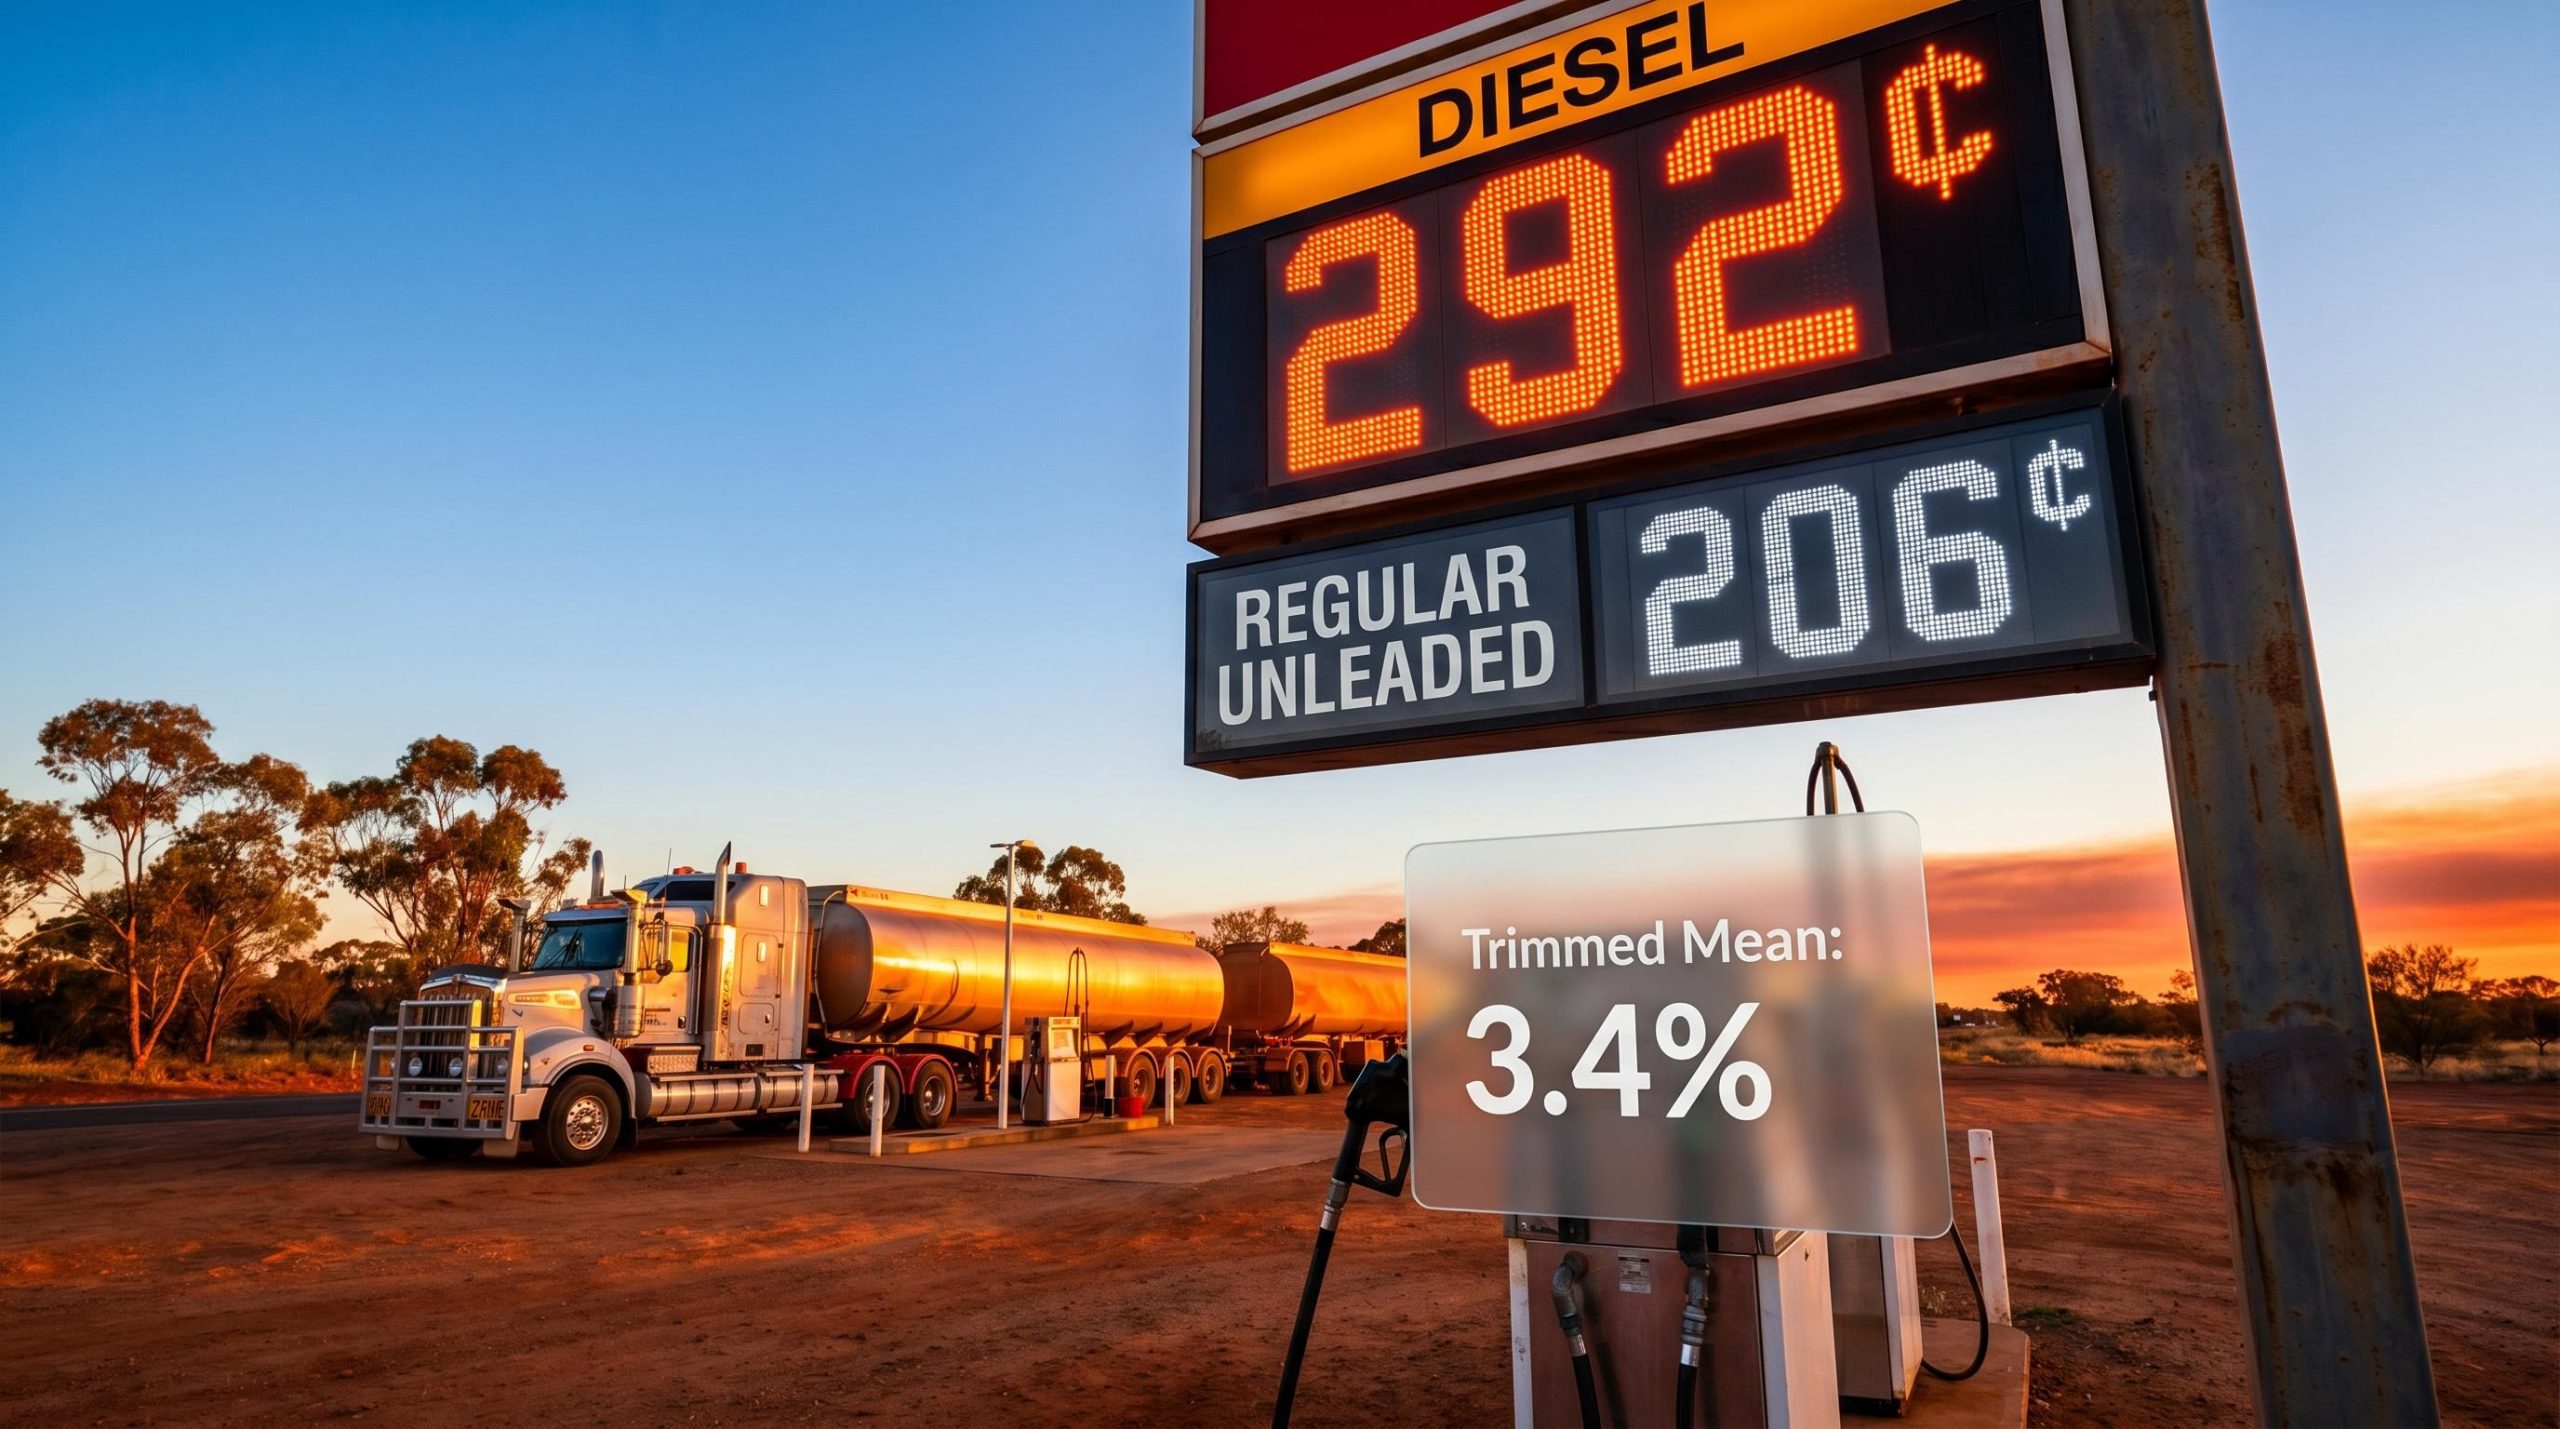
Diesel went the other way. It rose from approximately 256 cents per litre in March to approximately 292 cents per litre in April, an increase of roughly 14% despite the excise cut.
| Fuel Type | March 2026 Avg (cents/litre) | April 2026 Avg (cents/litre) | Monthly Change |
|---|---|---|---|
| Regular unleaded (91) | ~228 | ~206 | -10% |
| Premium unleaded | ~250 | ~228 | -9% |
| Diesel | ~256 | ~292 | +14% |
Diesel is the fuel of freight, construction, and agriculture. Its counter-directional move signals that global oil market pressure was strong enough to absorb the excise relief entirely for heavy transport users. Consumers saw savings at the bowser. Logistics operators did not.
Why the trimmed mean diverges from headline CPI, and what it tells policymakers
Headline CPI measures everything. That is its strength and its limitation. When a single commodity swings violently enough to drag the entire index, the headline number can mislead.
The trimmed mean exists to solve this problem. It strips out a set percentage of the most extreme price movements, at both the top and bottom of the distribution, each period. What remains is the middle of the price-change distribution: the underlying inflation trend, stripped of outliers.
Trimmed mean: 3.4%. Headline CPI: 4.2%. The difference is almost entirely fuel.
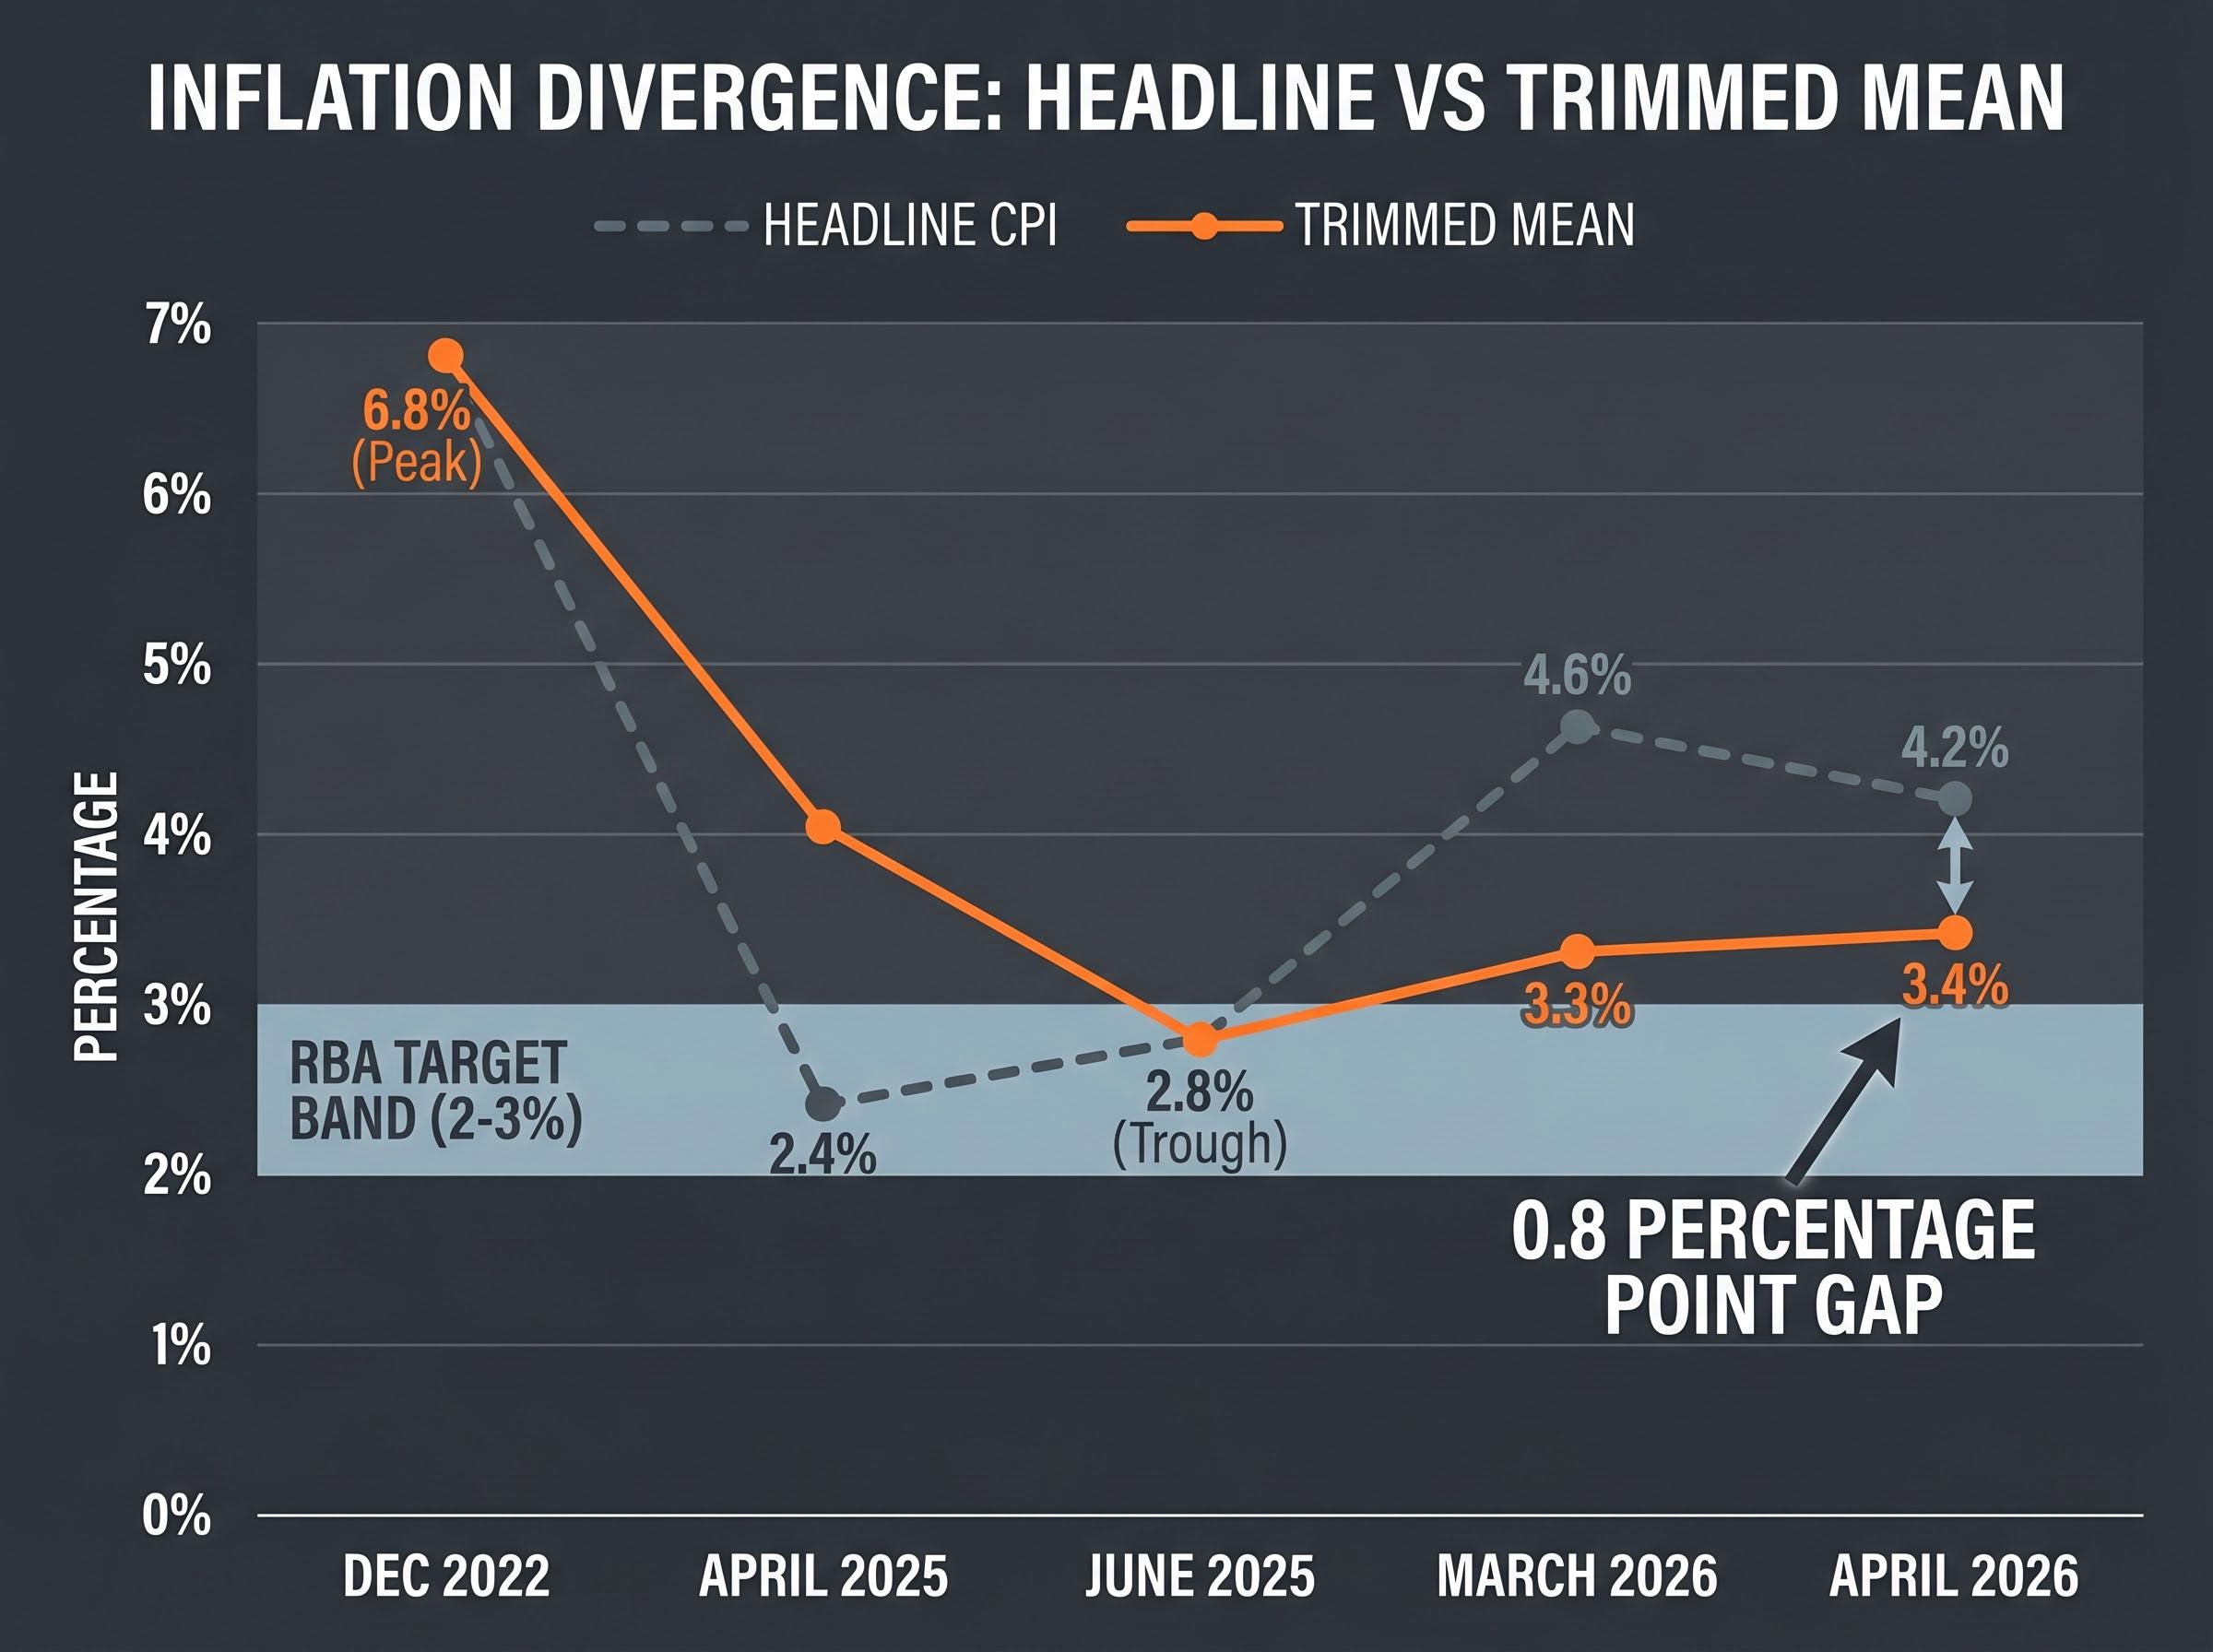
The trimmed mean rose to 3.4% annually in April 2026, up from 3.3% in March. It has been gradually climbing since its trough of 2.8% in June 2025, after peaking at 6.8% in December 2022.
- December 2022 peak: 6.8%
- June 2025 trough: 2.8%
- April 2026 current: 3.4%
The 0.8 percentage point gap between headline CPI and the trimmed mean is almost entirely attributable to fuel volatility. The RBA targets underlying inflation, not the headline figure. For readers watching rate cut expectations, the trimmed mean is the metric that matters.
Why automotive fuel was excluded in March and April 2026
The trimmed mean removes the most extreme movements at both tails of the distribution each period. In March, the 32.8% fuel surge placed automotive fuel firmly in the upper tail. In April, the 7.0% fall pushed it into the lower tail.
A single commodity distorted the headline figure in both directions across consecutive months. The trimmed mean’s exclusion mechanism worked exactly as designed, revealing that underlying inflation was moving slowly upward while the headline swung violently around it.
Where oil prices are hiding in your electricity bill, rent, and building materials
The fuel shock did not stop at the petrol station. Elevated oil prices embedded themselves in categories that most consumers do not associate with energy costs.
The housing group recorded 6.3% annual inflation to April 2026, the largest single contributor to headline CPI, easing slightly from 6.5% in March. Within that group, new dwelling construction costs rose 4.7% annually, partly reflecting elevated freight and logistics expenses on building materials. Timber, steel, and concrete all travel by road; when diesel rises 14% in a single month, the delivery cost of every pallet lifts with it.
Electricity prices surged 22.5% annually to April 2026, driven primarily by the removal of previous government rebates rather than the oil shock itself. The structural nature of that increase means it will persist regardless of fuel price direction.
Postal services rose 12.4% annually, reflecting fuel surcharges passed through by parcel delivery operators exposed to the same diesel cost pressures hitting the broader freight sector.
| Category | Annual Inflation (April 2026) | Key Driver |
|---|---|---|
| New dwelling construction | +4.7% | Freight costs on building materials |
| Postal services | +12.4% | Parcel delivery fuel surcharges |
| Transport group | +6.6% | Automotive fuel, vehicle running costs |
Three indirect transmission channels carried the oil price shock beyond the bowser:
- Freight costs on materials: Diesel-dependent haulage lifted input costs for construction, manufacturing, and retail supply chains
- Parcel delivery surcharges: Logistics operators passed fuel costs through to business customers and consumers via variable surcharges
- Energy input costs: Electricity pricing, while primarily driven by rebate removal, compounds the broader energy cost burden on households and businesses
Investors in residential construction companies, logistics operators, and real estate investment trusts should note the breadth of this pass-through. The oil price shock did not stay in the transport column.
The gap that matters: where inflation stands now that the dust has partly settled
The April print improved the headline. It did not close the gaps that matter.
Fuel remains 23.5% above its pre-conflict February 2026 level, despite the excise relief. The trimmed mean sits at 3.4% and has been trending upward, not downward, since June 2025. Housing inflation at 6.3% shows no sign of structural relief.
Beyond the well-documented categories, other groups showed stickiness or acceleration in April:
- Housing: 6.3% annually, the largest CPI contributor
- Health: 4.0% annually, up from 3.0% in March, the only group to accelerate in April
- Education: 4.8% annually, unchanged from March
Clothing and footwear eased from 7.1% in March to 5.9% in April but remains elevated. Alcohol and tobacco held broadly flat at 4.3%.
Fuel remains 23.5% above its pre-conflict February 2026 level, despite the April excise relief.
For consumers, the partial petrol price reversal does not restore pre-conflict living costs. For investors and analysts watching the RBA, the trimmed mean’s gradual rise since mid-2025 carries more weight than the headline improvement in shaping rate cut timing expectations.
Fuel, freight, and the RBA’s next move: what the April data means for what comes next
The RBA targets underlying inflation within a 2-3% band. The trimmed mean at 3.4% sits above that band, and its trajectory since June 2025 (from 2.8% to 3.4%) points upward.
That trajectory complicates the rate cut case. Headline CPI may have eased, but the measure the RBA watches most closely is moving in the wrong direction.
Diesel at approximately 292 cents per litre in April signals that freight-exposed sectors face continued cost pressure. The excise cut’s temporary nature introduces further uncertainty: if the policy is not extended, retail petrol prices will face upward pressure from excise restoration on top of any continued global oil volatility.
Three variables will shape the next monthly CPI print:
- Fuel price trajectory: Whether petrol and diesel prices stabilise, or whether the Middle East conflict drives renewed oil price increases
- Electricity costs: Whether the 22.5% annual increase persists in the absence of government rebates
- Trimmed mean direction: Whether the gradual upward trend from 2.8% to 3.4% continues or flattens
Underlying inflation at 3.4% remains above the 2-3% target band. The trimmed mean has been rising, not falling, since June 2025.
Rate cut expectations will be most sensitive to trimmed mean trajectory and housing persistence, not the headline swing driven by fuel excise. Readers positioning in rate-sensitive assets, including real estate investment trusts, banks, and mortgage-exposed equities, should weight these underlying measures over the headline print.
The RBA’s third consecutive rate hike to 4.35% on 5 May 2026, decided by an 8-1 Board vote, confirmed that all four inflation measures remained above the 2-3% target band, leaving open the question of whether a fourth hike follows in July depending on how the Q2 CPI data resolves.
One month of relief at the petrol bowser does not rewrite the inflation story
Headline CPI improved in April 2026. The improvement is concentrated in a partial fuel price reversal, not a broad-based disinflation. Strip out the fuel volatility, and the underlying picture is one of gradual, persistent upward pressure.
The trimmed mean at 3.4% and rising is the metric for RBA watchers. The 23.5% fuel gap above pre-conflict levels is the metric for consumers and freight-exposed businesses. Neither number supports the conclusion that the inflation challenge is receding.
The next monthly CPI indicator will reveal whether the April partial reversal holds, or whether renewed oil price pressure, persistent housing costs, and accelerating health inflation reassert themselves.
Investors wanting to map the portfolio implications of persistent energy cost pressure will find our full explainer on ASX exposure to the oil shock valuable; it covers the compressed equity risk premium, Goldman Sachs and JPMorgan modelling of Brent at USD $140-150 under sustained Hormuz closure, the 2026 budget’s capital gains and negative gearing changes, and why the RBA cash rate is expected to remain elevated until mid-2027.
This article is for informational purposes only and should not be considered financial advice. Investors should conduct their own research and consult with financial professionals before making investment decisions.