What CHM CDH17’s Phase 1 Data Means for Chimeric Therapeutics
3 hrs ago

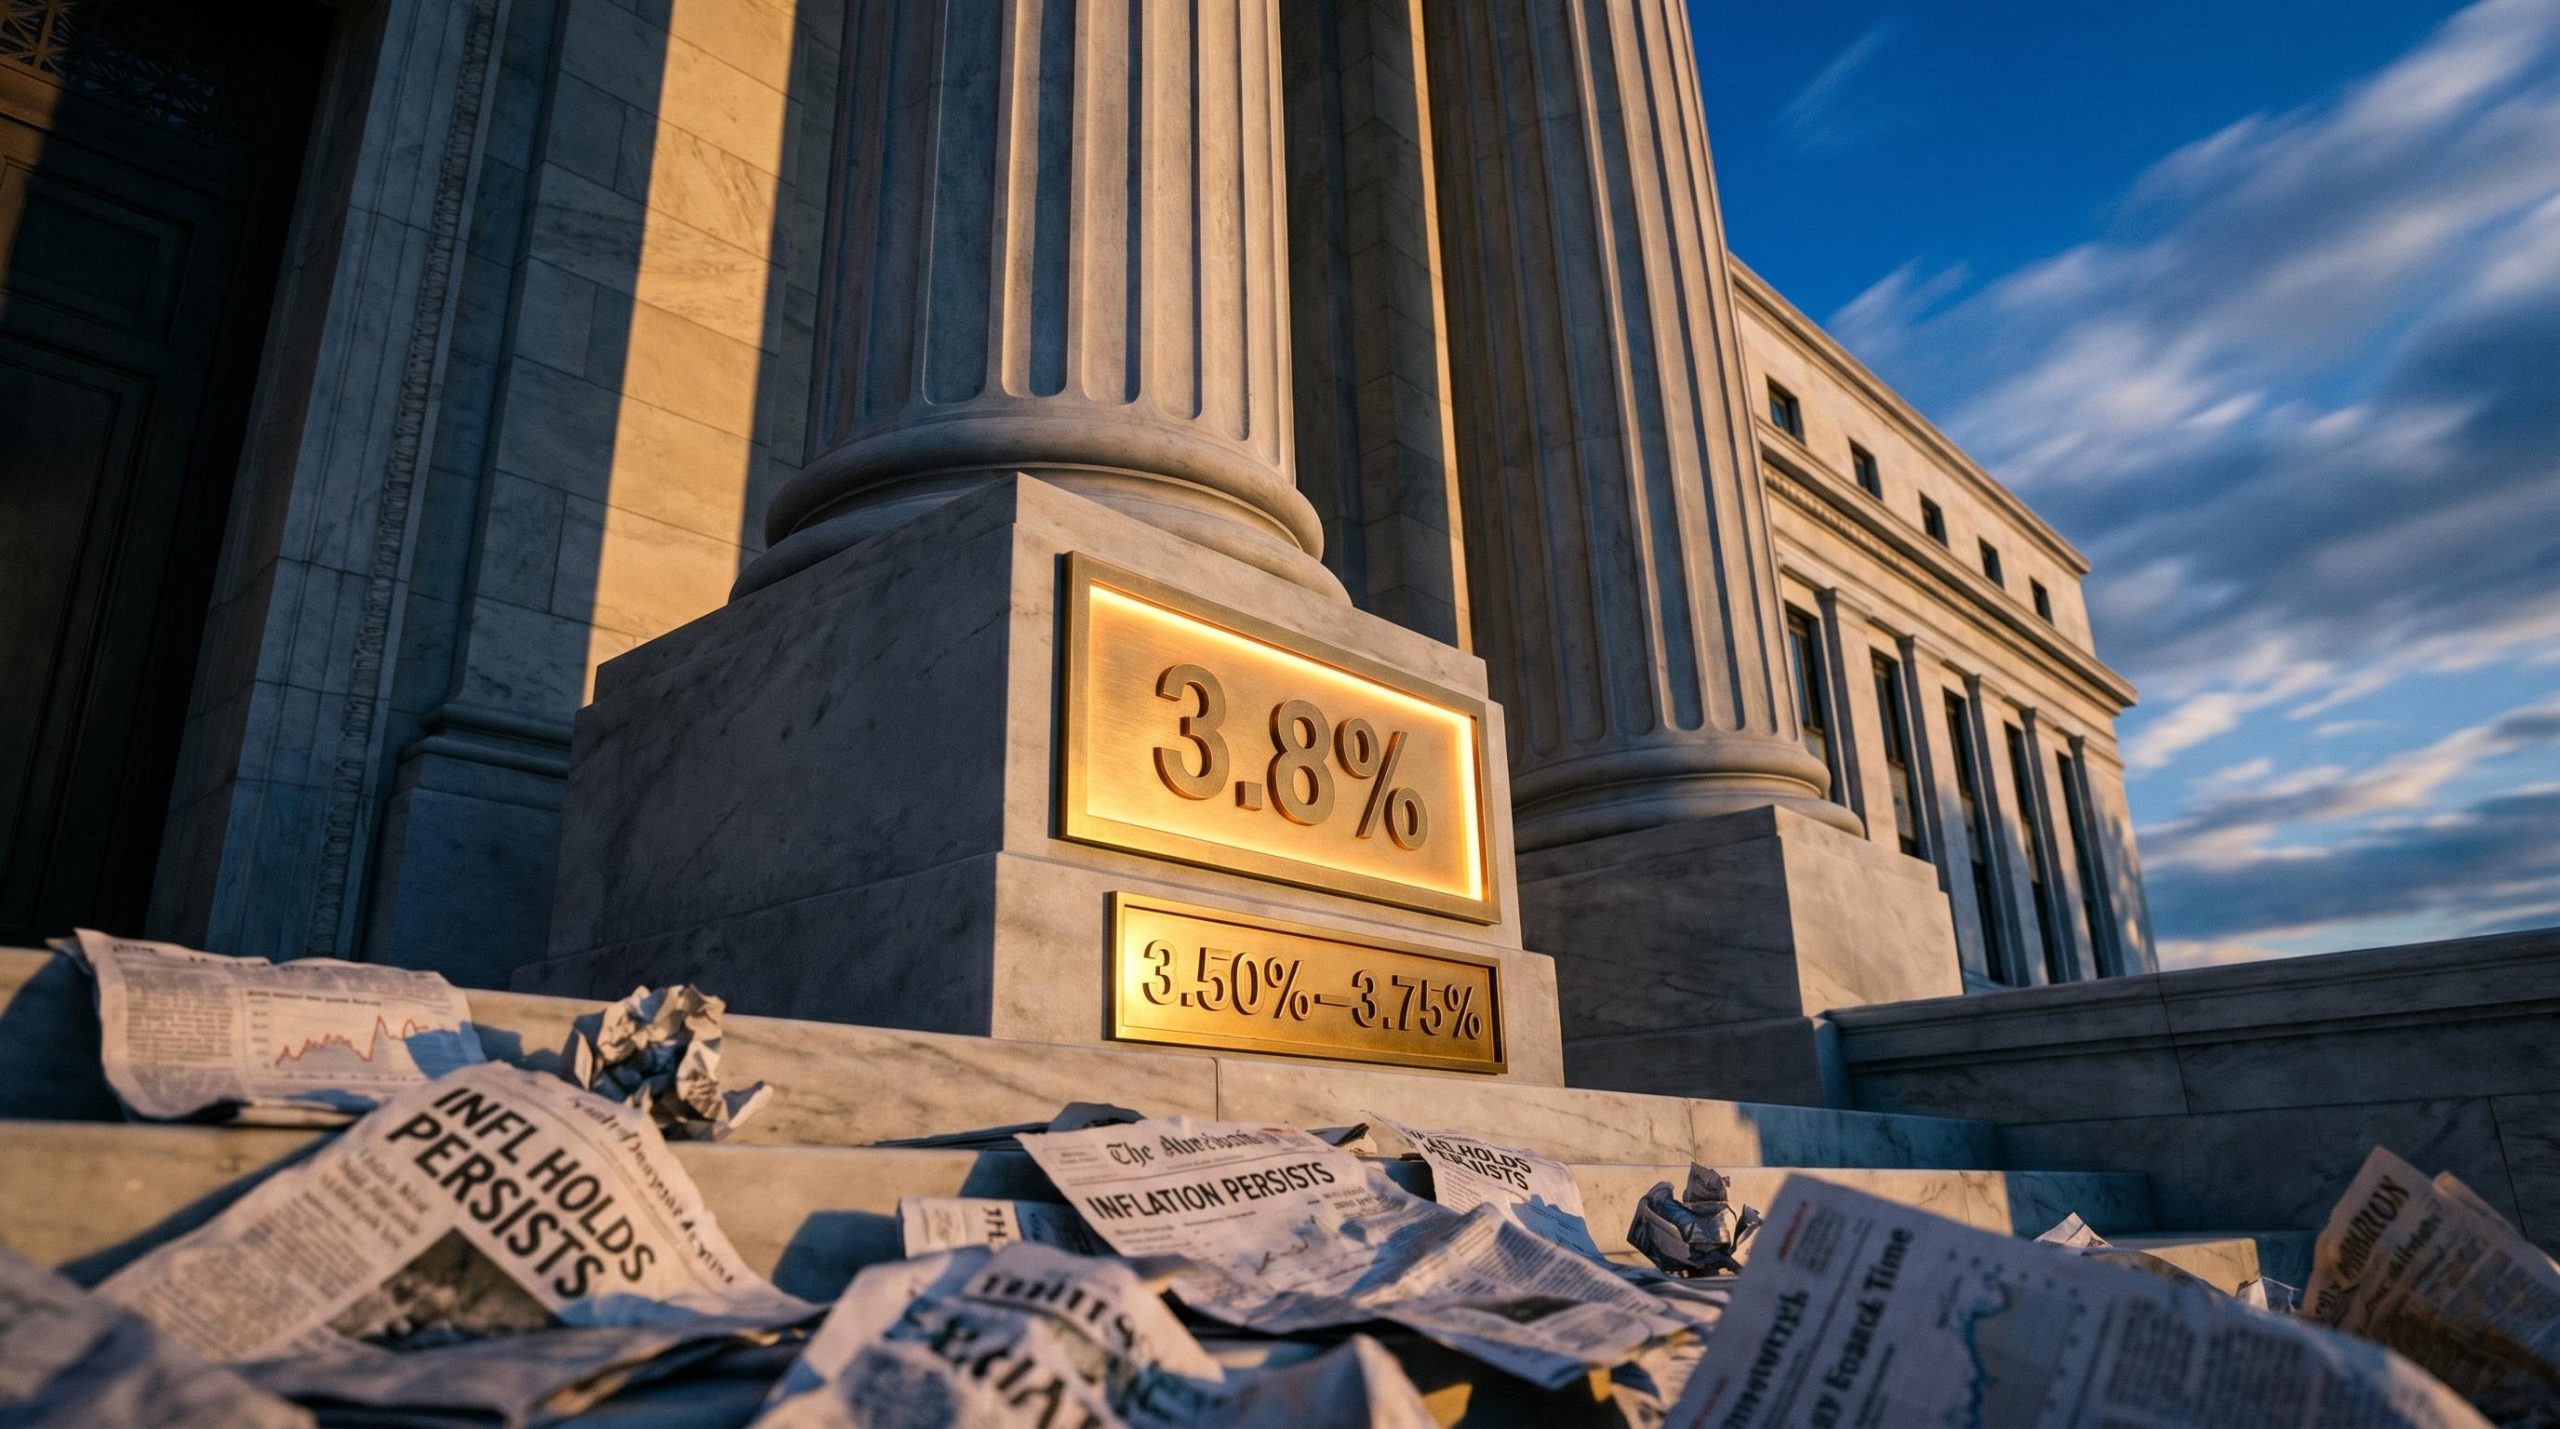
Brent crude fell to $78.35 per barrel on 17 June 2026, its lowest level since March, as traders repriced a world in which the Strait of Hormuz reopens and Iranian oil flows again. Three months earlier, the same contract was trading above $110. A preliminary 14-point U.S.-Iran framework agreement, set for formal signing on 20 June, has triggered a rapid repricing across energy markets. But the cascade does not stop at crude prices. The same oil shock that drove Brent above $110 reignited inflation and forced the Federal Reserve, now under newly appointed Chair Kevin Warsh, to hold rates steady at 3.5%-3.75% and shelve any 2026 rate cuts. A Middle East ceasefire does not automatically unlock lower borrowing costs. What follows is a unified analytical framework connecting the deal’s specific provisions to energy price mechanics, the Fed’s constrained rate path, and the risks that could unwind the peace dividend before it fully arrives.
The framework agreement between Washington and Tehran, scheduled for a formal signing ceremony on Friday, 20 June 2026 per The New York Times, covers a broad set of provisions. Deutsche Bank analysts have cautioned that the accord reads as a high-level memorandum of understanding rather than a comprehensive final settlement, a characterisation echoed in wider market commentary. Implementation risks remain substantial.
The framework’s 60-day negotiation window, within which binding terms on enrichment limits, asset releases, and the mine clearance timetable must be agreed, is the mechanism that makes the current diplomatic text a high-level memorandum rather than a concluded treaty, a distinction with direct consequences for how long the peace dividend can be treated as durable.
The reported provisions include:
President Donald Trump indicated separately that restrictions on vessel transit through the Strait of Hormuz would lift on the same date as the signing.
The agreement initiates, but does not conclude, nuclear negotiations. A follow-on period of talks is expected to commence after signing, with the scope and timeline still being defined. U.S. officials have signalled explicitly that military pressure could return if those negotiations fail, meaning the diplomatic framework is reversible by design. For anyone pricing the peace deal as a done deal, that distinction matters more than anything else in this article.
The Strait of Hormuz is not simply another oil transit route. It is a simultaneous chokepoint for both crude oil and liquefied natural gas, meaning the closure that began in late February 2026 disrupted two global energy markets at once rather than one. That dual exposure is what separates a Hormuz shutdown from other supply disruptions and explains why prices moved as far as they did.
The 57% oil price surge from roughly $70 per barrel in late February to above $110 by mid-May was not a gradual drift but a supply removal event concentrated almost entirely at one transit point, with bypass pipeline alternatives structurally incapable of replacing the lost volume.
Before the conflict, approximately one-fifth of the world’s combined oil and LNG volumes transited the Strait of Hormuz, equivalent to roughly 20-21 million barrels per day of oil, or approximately 20% of global daily demand.
When the joint U.S.-Israeli military campaign shut the waterway, the effect was an instantaneous supply shock on a scale that drained global stockpiles over a matter of weeks. Brent surged above $110 per barrel at the peak. Those stockpile drawdowns created structural tightness that persists beyond the signal in futures prices, because inventories cannot be rebuilt overnight even once physical flows resume.
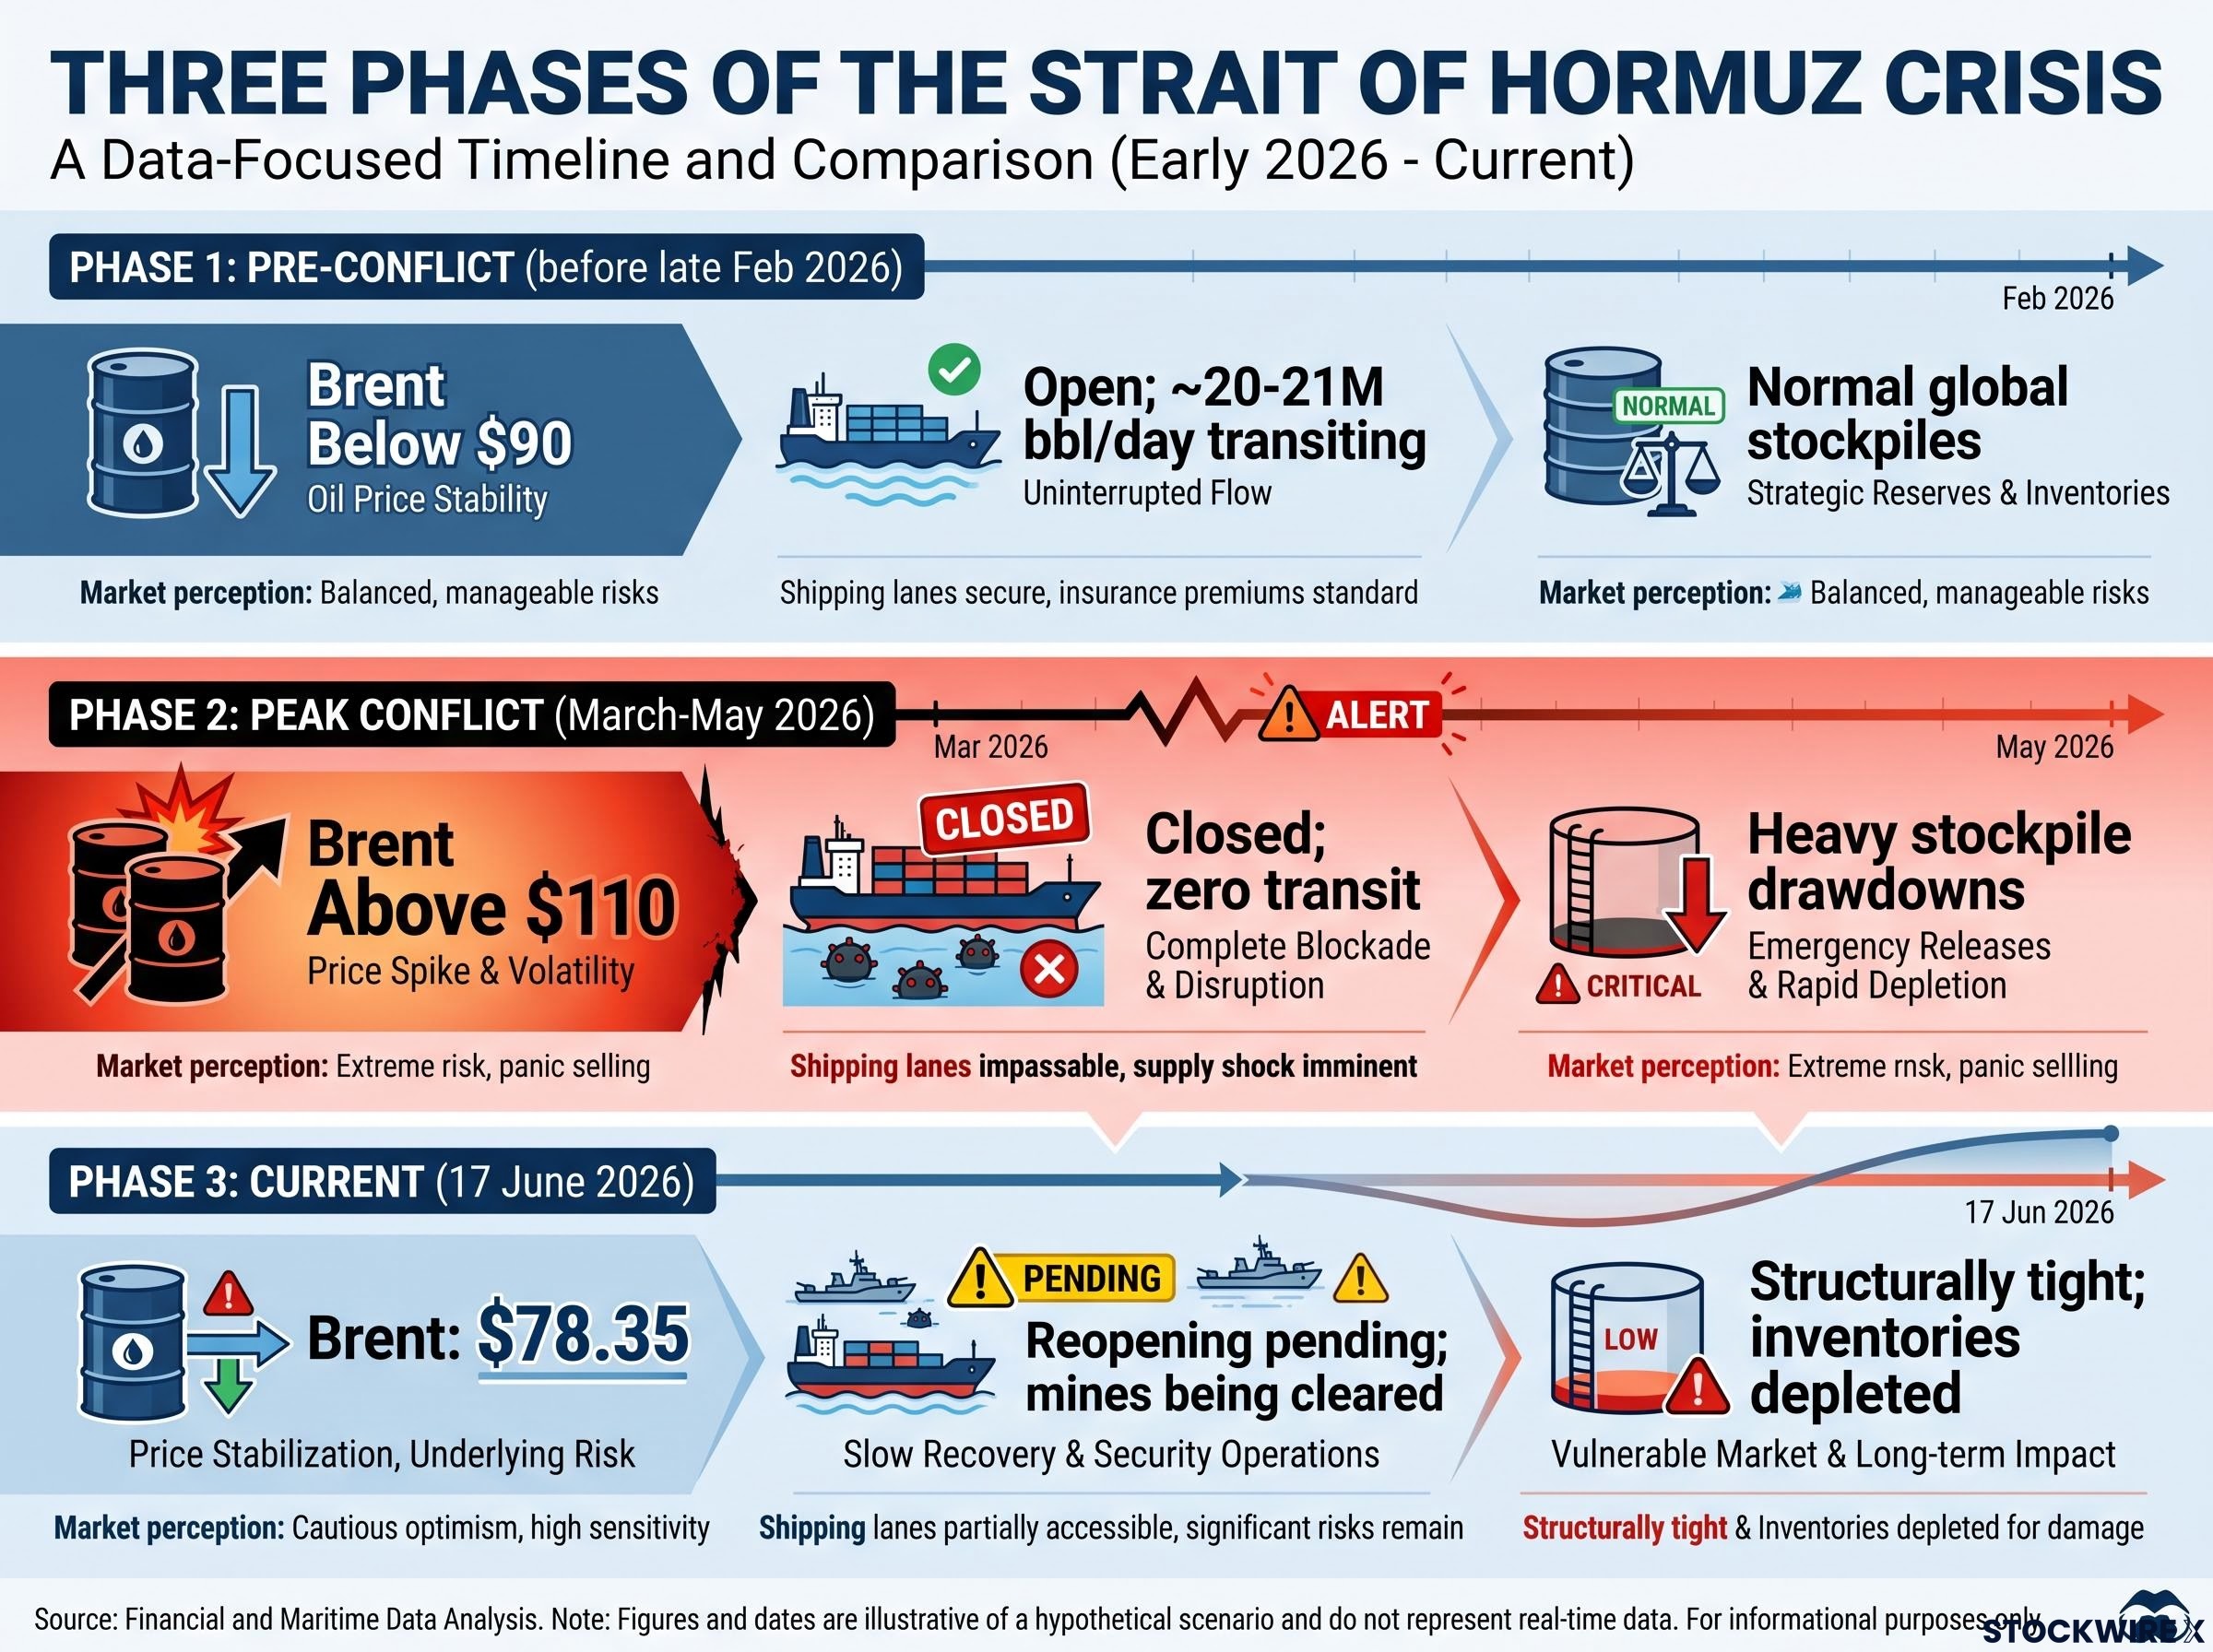
The table below captures how dramatically conditions shifted across the three phases of this crisis.
| Phase | Brent price level | Strait status | Supply condition |
|---|---|---|---|
| Pre-conflict (before late Feb 2026) | Below $90 | Open; ~20-21M bbl/day transiting | Normal global stockpiles |
| Peak conflict (March-May 2026) | Above $110 | Closed; zero transit | Heavy stockpile drawdowns |
| Current (17 June 2026) | $78.35 | Reopening pending; mines being cleared | Structurally tight; inventories depleted |
Understanding this mechanism clarifies why the recovery in crude prices will not fully mirror the path up, and why energy-intensive sectors should not assume immediate margin relief simply because futures have moved.
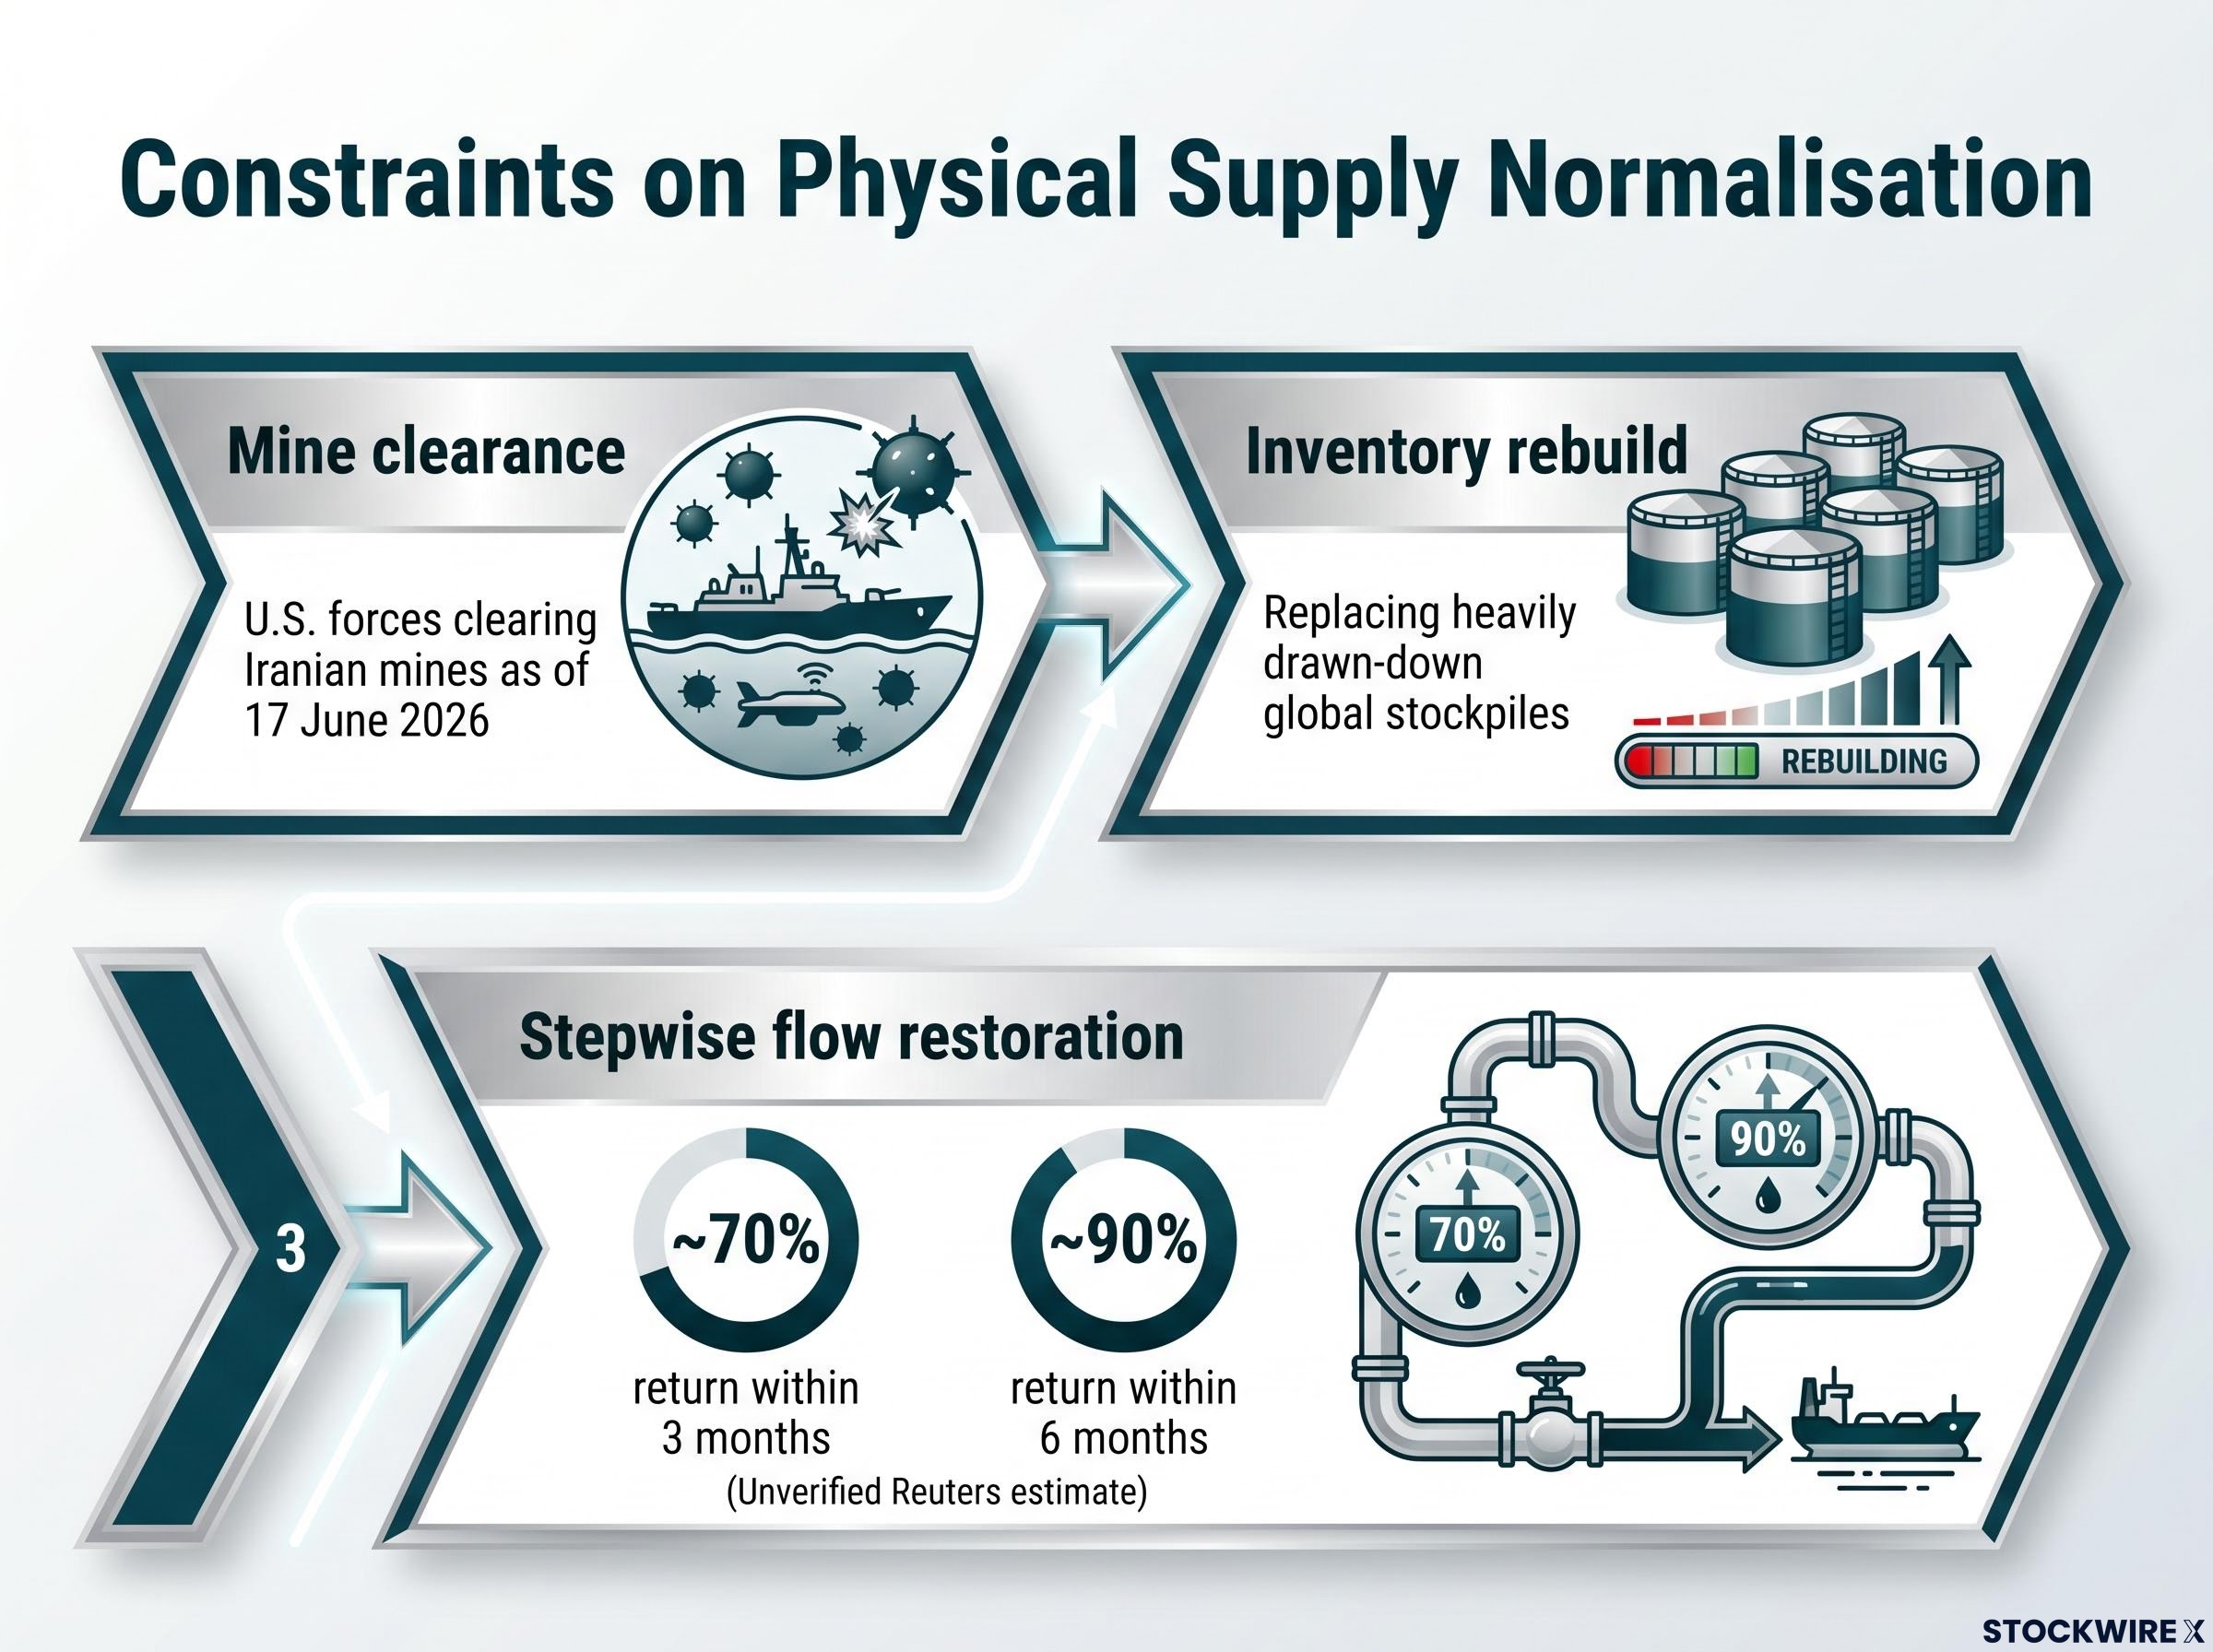
Futures markets price expected outcomes quickly. Physical supply does not work the same way. Three sequenced constraints stand between the signed framework and the restoration of normal energy flows:
Saudi Aramco’s chief executive warned that supply normalisation into 2027 remained a realistic base case even before the framework agreement was signed, a projection that frames the current stepwise flow estimate of 70-90% recovery within three to six months as an optimistic scenario rather than a consensus view.
The gap between where oil futures are pricing and where physical supply actually sits is the key analytical tension for anyone positioning in energy equities, transport stocks, or inflation-linked assets over the next one to three months.
Transport, airlines, and energy-intensive industries stand to benefit earliest from lower input costs, but margin relief will track the actual normalisation of physical flows and inventories rather than futures prices alone. Energy-importing economies, including India, Japan, South Korea, and Europe, are positioned to gain most from sustained lower oil and LNG costs through improved trade balances and reduced fuel expenses.
On the other side, oil producers and energy equities that benefited from the price spike face a more challenging backdrop as the market prices in larger future supply and a narrower risk premium.
The Strait closure and the resulting surge above $110 re-accelerated headline inflation at precisely the moment earlier disinflation had led markets to expect a sequence of rate cuts. That timing mismatch forced the Federal Reserve to hold its benchmark rate steady at 3.5%-3.75% at its June 2026 meeting, the first presided over by Chair Kevin Warsh.
The FOMC vote to hold rates at 3.5%-3.75% at the June 2026 meeting confirmed that elevated energy prices feeding into inflation data outweighed any optimism around a potential diplomatic resolution in the Middle East, a dynamic that Warsh’s first presiding meeting made structurally difficult to ignore.
The problem is one of data lags. The inflationary impact of the earlier oil shock is already embedded in recent CPI and PCE prints. Those are the numbers Fed officials must respond to now. The disinflationary effect of falling crude prices will only appear in headline inflation with a delay of several months, as lower oil works through refining, wholesale, and retail channels into consumer energy prices. The Fed historically waits for several months of confirmed data before changing course after a supply-driven inflation shock.
BofA Securities projected the Fed’s updated economic forecasts would reflect higher inflation, reduced unemployment, and no rate reductions for the full year 2026, with a small number of policymakers pencilling in rate increases.
Investors who interpret the peace deal as an immediate green light for rate-sensitive assets are confusing futures-market speed with central bank reaction speed. The Fed’s rate path will track CPI and PCE data, not crude futures.
Warsh occupies an unusually constrained position. The White House has applied sustained pressure for aggressive rate reductions, a campaign that included legal threats against the institution and Warsh’s predecessor. Jerome Powell declined those calls repeatedly before being succeeded and remains as a Fed governor.
Warsh’s first press conference will be closely parsed for any signal on how he intends to balance that political pressure against inflation data that does not yet support easing. The tone he strikes could move rate expectations more than the peace headlines themselves.
The deal’s positive market signal is real, but four specific risks could erode or reverse it. Each has a distinct market transmission mechanism, which is what makes them worth tracking separately rather than bundling into a general sense of uncertainty.
The Strait of Hormuz sovereignty dispute that caused Iran to reject an earlier framework version over permanent transit authority illustrates how rapidly a signed deal can unravel when the underlying sovereignty question is deferred rather than resolved, the same dynamic that makes nuclear negotiation failure the highest-probability reversal risk in the current framework.
| Risk | Primary market transmission | Assets most exposed |
|---|---|---|
| Nuclear talks failure | Energy prices spike; risk premium returns | Oil futures, energy equities, broad risk assets |
| Mine-related incident | Shipping disruption; insurance repricing | Tanker stocks, oil futures, transport equities |
| OPEC+ supply offset | Limits downside in crude prices | Energy equities, energy-importing economies |
| Hawkish Warsh tone | Rate expectations repriced higher | Fixed income, rate-sensitive equities, REITs |
These risks are not equally probable, but each connects to a distinct set of portfolio exposures.
The analytical framework across this article rests on a three-layer sequencing logic. Oil futures price the expected end state almost immediately; physical supply normalises over weeks to months as mines are cleared, insurance recalibrates, and tankers return; and the Fed’s rate response follows only after CPI and PCE data confirm that lower energy costs are filtering through to headline inflation. Treating the peace deal as a single binary event collapses those three distinct timeframes into one, and that is where mispricing occurs.
The indicators below are ordered by which will signal progress earliest:
Nuclear negotiation progress remains the single largest structural tail risk. If those talks stall or collapse, every downstream implication covered here reverses.
For rate cuts to arrive before year-end 2026, several conditions would need to hold simultaneously: the signing must proceed, physical flows must normalise quickly enough to pull headline inflation lower within two to three monthly data cycles, and Warsh’s Fed must judge that the disinflationary trend is durable rather than transient. If any link in that chain breaks, the peace dividend stalls at energy prices and does not reach borrowing costs.
This article is for informational purposes only and should not be considered financial advice. Investors should conduct their own research and consult with financial professionals before making investment decisions. Forward-looking statements regarding oil prices, Federal Reserve policy, and diplomatic outcomes are speculative and subject to change based on market developments and geopolitical conditions.
The US-Iran framework agreement is a preliminary 14-point accord scheduled for formal signing on 20 June 2026 that includes a permanent ceasefire, removal of the US naval blockade, immediate sanctions waivers on Iranian crude exports, and asset unfreezing, all of which are expected to allow oil flows through the Strait of Hormuz to resume.
Brent crude dropped from above $110 per barrel to $78.35 because the Strait of Hormuz closure had removed roughly 20-21 million barrels per day of oil and LNG transit from global markets, and the prospect of that volume returning triggered rapid futures repricing even before physical flows resumed.
One unverified Reuters estimate suggested flows could return to approximately 70% of pre-war levels within three months and roughly 90% within six months, though Saudi Aramco's chief executive had flagged supply normalisation into 2027 as a realistic base case, meaning full recovery is not guaranteed quickly.
The Fed held rates at 3.5%-3.75% in June 2026 because the inflationary impact of the earlier oil price surge above $110 is already embedded in current CPI and PCE data, and the disinflationary effect of falling crude will only filter through to headline inflation with a delay of several months.
The four key risks are: failure of the follow-on nuclear negotiations (which could trigger a return of military pressure), a mine-related shipping incident in the Strait, OPEC+ producers offsetting Iranian supply increases through coordinated cuts, and a hawkish tone from Fed Chair Kevin Warsh repricing rate expectations higher.