
On 10 June 2026, the Nasdaq dropped roughly 1% while the Dow Jones Industrial Average quietly climbed 0.2%. That single-session divergence is not noise. It is the visible surface of a deeper capital reallocation that has been building across the first half of 2026, as elevated AI and mega-cap technology valuations prompt institutional money to seek better risk/reward in sectors that have lagged for years. What follows lays out the evidence for the rotation, names the sectors absorbing the flows, gives readers specific ETF price levels to monitor, and explains how to track whether the move has staying power or is merely a short-term pause.
One session, two markets: what June 10 revealed about the current trend
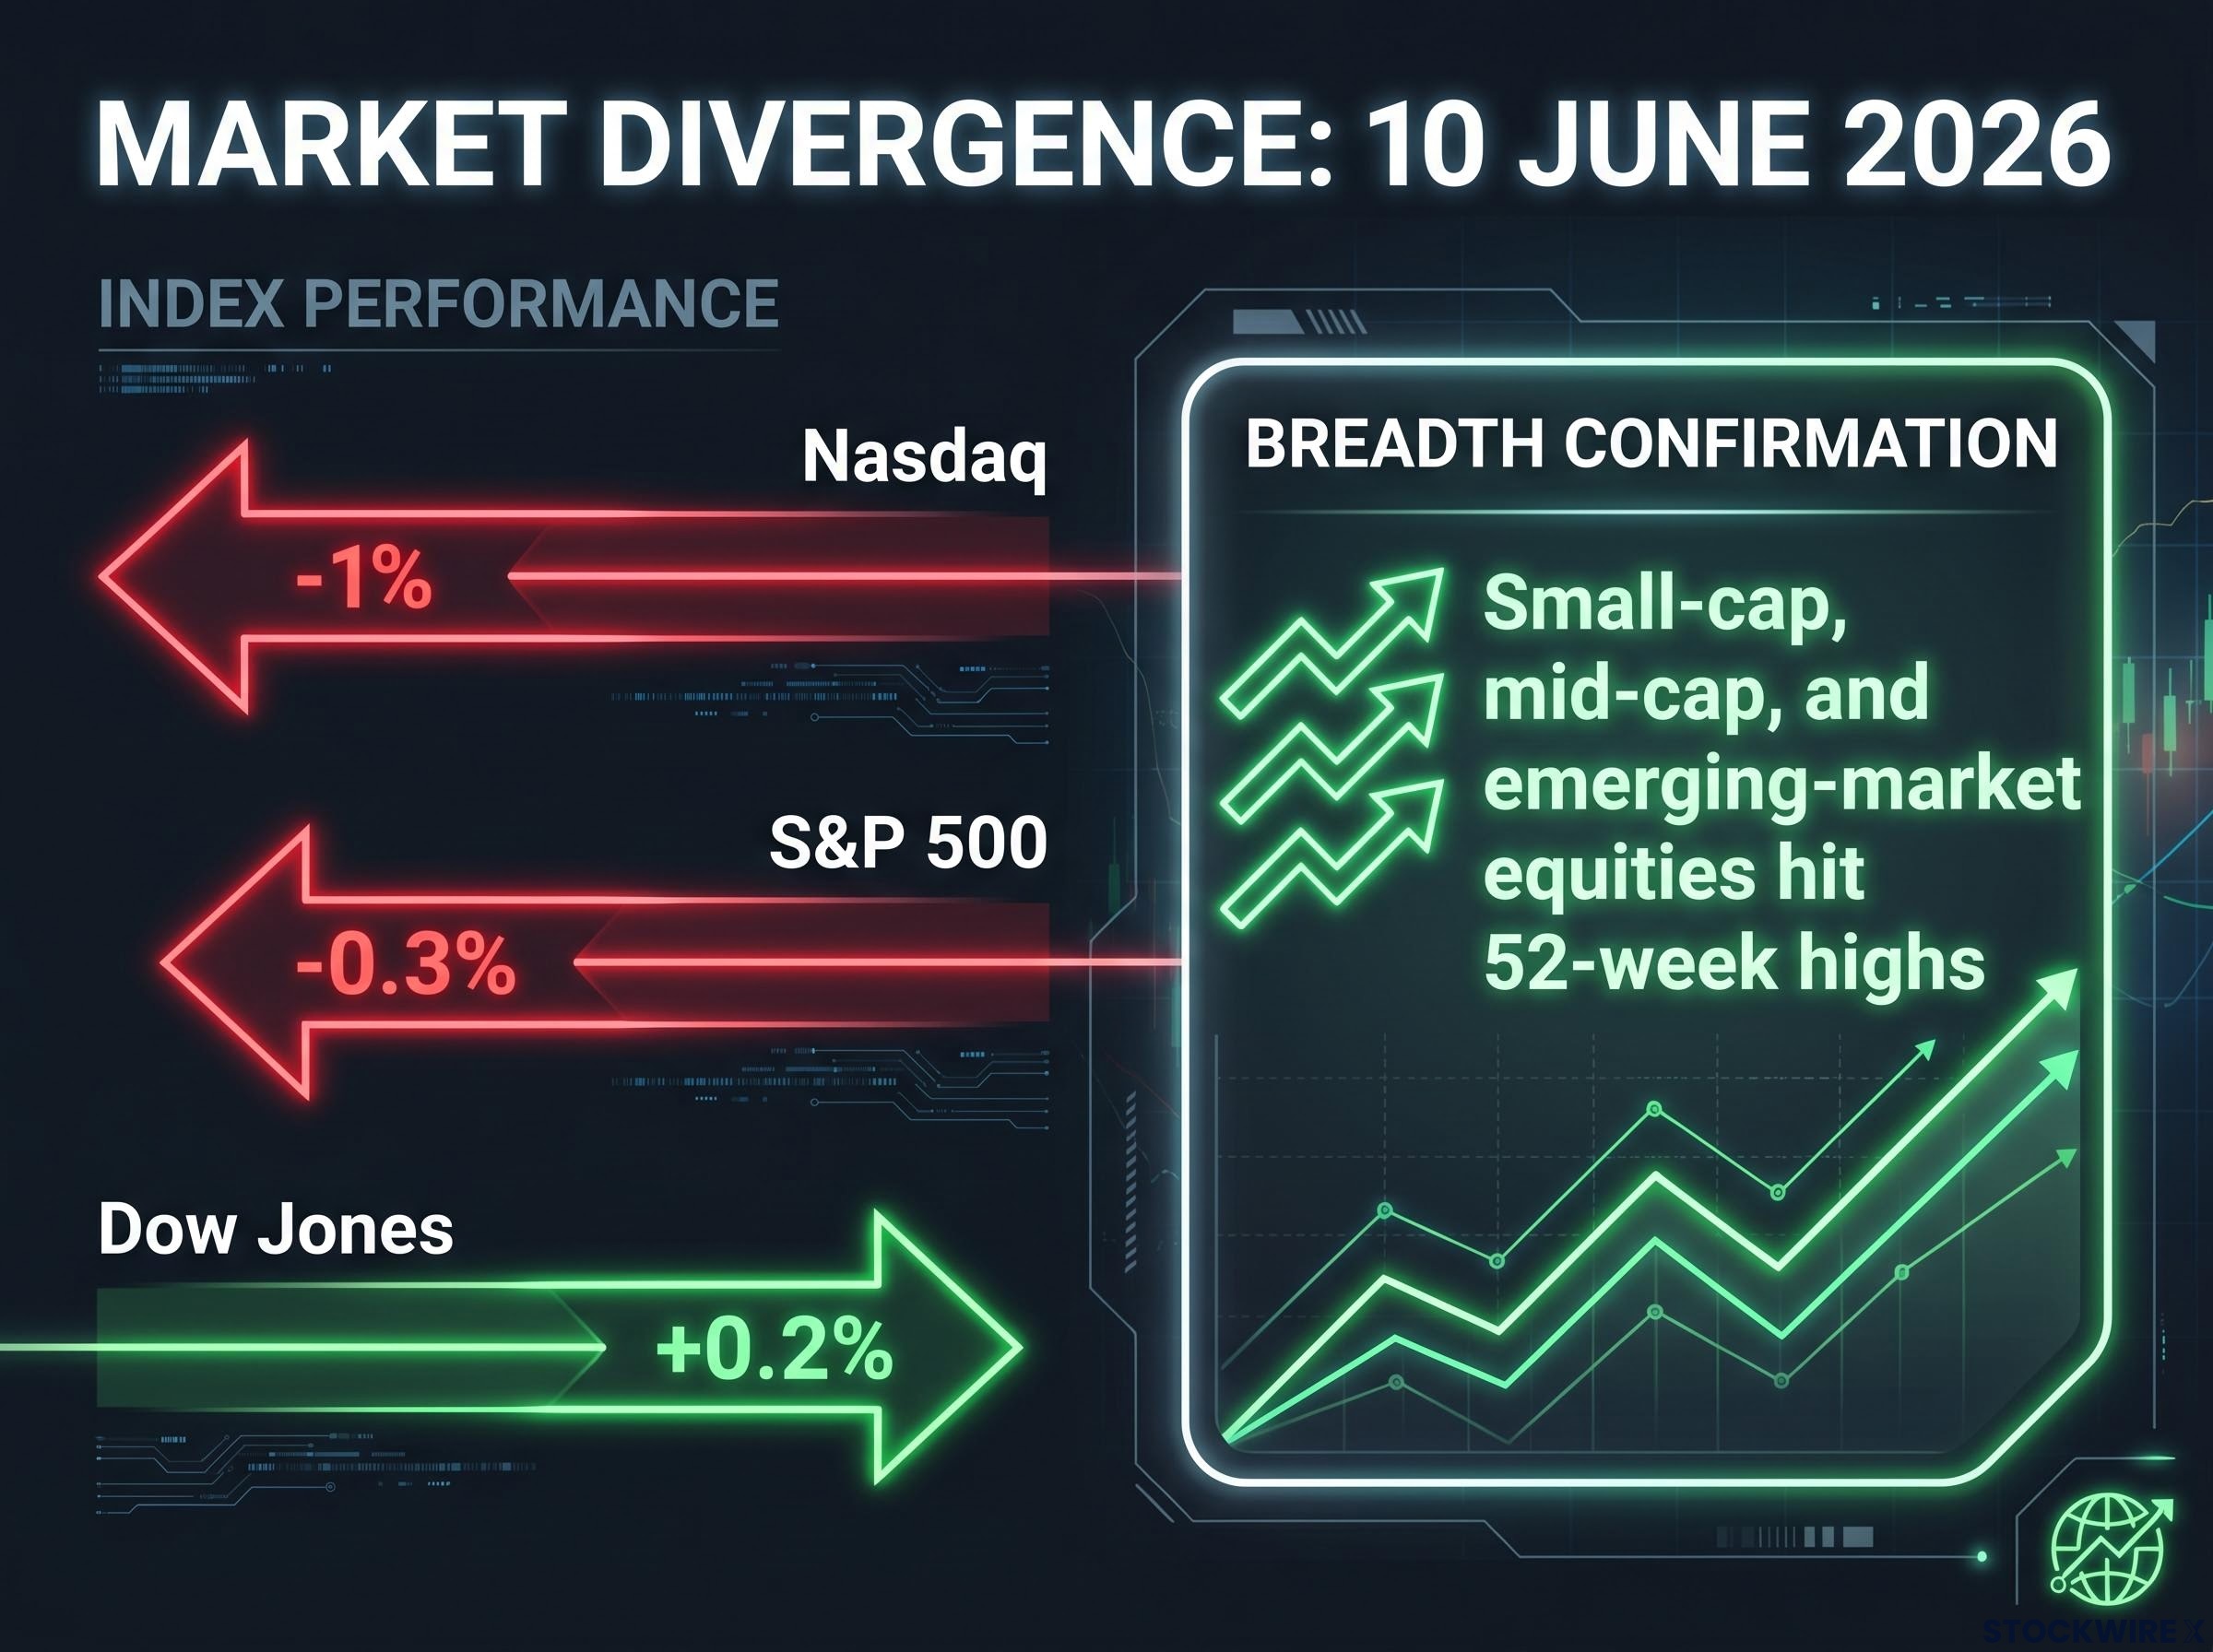
The divergence on 10 June was sharp enough to warrant closer examination. Three indexes, three directions:
- Nasdaq Composite: approximately -1%
- S&P 500: approximately -0.3%
- Dow Jones Industrial Average: approximately +0.2%
The Dow’s composition explains why it moved inversely to the tech-heavy Nasdaq. Its weighting tilts toward financials, healthcare, consumer goods, and industrial names rather than the mega-cap growth stocks that dominate the Nasdaq and the upper tiers of the S&P 500. When capital rotates out of technology and into those traditional-economy segments, the Dow gains while the Nasdaq falls.
Keith Lerner, co-chief investment officer at Truist Wealth, framed the tech pullback as a healthy rotation within an ongoing bull market, describing it as tactical de-crowding rather than a structural rejection of the technology sector.
Corroborating this interpretation, small-cap, mid-cap, and emerging-market equities hit 52-week highs during this period. That breadth signal matters. If the selling were a broad risk-off move, those segments would be falling alongside tech. Instead, institutional capital is being reallocated, not withdrawn.
Barclays’ assessment of rotation from chip stocks into software and defence names, published just days before the June 10 divergence, corroborates the institutional rebalancing thesis and adds a geographic dimension: European equities, with lower technology weightings and cheaper valuations than US indices, are a parallel destination for capital leaving AI hardware.
When big ASX news breaks, our subscribers know first
Why capital is leaving stretched AI and technology valuations
Three forces are converging to push money out of AI and mega-cap technology names.
The first is valuation compression. After a powerful AI-led advance, many large-cap growth stocks trade at elevated forward multiples with limited margin for disappointment. The second is the mathematical pull of undervalued alternatives: when one segment of the market is priced for perfection and another trades at a discount, institutions naturally reweight. The third is the macro repricing around interest-rate expectations.
AI stock valuation risk is compounded by a structural problem that index-level volatility masks: the top five US companies now control roughly 30% of total market capitalisation, meaning passive investors carrying what they believe to be diversified exposure are in practice running concentrated AI-thematic positions.
| XLK/SPY Ratio Level | Interpretation |
|---|---|
| 0.2422 | Intermediate support (former resistance); a hold here suggests the tech pullback is a pause, not a reversal |
| 0.2338 | Secondary and more significant support; a sustained break below this level would be considered technically bearish for tech leadership |
As of 9 June 2026, the XLK/SPY ratio dropped sharply toward its 20-day EMA support zone. Despite the pullback, XLK has maintained year-to-date outperformance versus the S&P 500, meaning this is compression, not collapse. The distinction between the 0.2422 and 0.2338 levels gives investors a concrete framework for deciding whether this is a tactical pause or a more structural leadership change.
The rate sensitivity argument
Long-duration growth cash flows are particularly sensitive to shifts in the rate environment. When bond markets price a peak-rate or less restrictive Federal Reserve stance, the discount rate applied to future earnings changes, and that change disproportionately affects technology companies whose valuations depend on cash flows years into the future.
This creates a structural tailwind for value, cyclicals, and income sectors, one that operates independently of any short-term price action in tech.
Institutional strategists have characterised the positioning response as a barbell: retaining core quality technology exposure while adding defensive and value positions on the other side. The move is not a wholesale exit from tech but a rebalancing toward better near-term risk/reward.
Healthcare and real estate are flashing the clearest technical recovery signals
Healthcare was among the worst-performing sectors in 2025, making its 2026 recovery meaningful from a mean-reversion perspective. The XLV ETF’s technical picture has shifted materially.
The EMA crossover confirmation sequence for both XLV and XLRE follows the same pattern:
- The 20-day EMA crosses above the 40-day EMA, restoring short-term bullish momentum
- The ETF achieves decisive breakouts above multiple prior resistance levels
- Former resistance converts into support, confirming institutional accumulation
- The next resistance threshold becomes the level that must be cleared for trend continuation
For XLV, the April 2026 low serves as downside support, and the US$155 level represents the resistance that must be breached for bullish continuation. The breakout above multiple prior resistance levels suggests the momentum shift is more than a dead-cat bounce.
XLRE followed a slightly different path, consolidating in a range-bound phase between April and May 2026 before breaking higher. The US$43 level, which previously acted as resistance, has converted into support. The next significant resistance sits at US$45, a swing high within Fibonacci retracement analysis.
| Sector ETF | Key Support | Next Resistance / Target |
|---|---|---|
| XLV (Healthcare) | April 2026 low | US$155 |
| XLRE (Real Estate) | US$43 (former resistance now support) | US$45 |
Both setups offer defined decision points. If XLV clears US$155 on volume, the bullish thesis strengthens. If XLRE holds US$43 on pullbacks, the consolidation-to-breakout pattern remains intact. These are the levels where the rotation thesis for healthcare and real estate either accelerates or stalls.
The broader rotation picture: industrials, energy, and consumer staples leading the charge
Individual ETF setups tell part of the story. The year-to-date performance data tells the rest, and the scale of outperformance in three sectors is striking relative to the broader market.
| Sector | YTD Return | Index Contribution | Key Holdings |
|---|---|---|---|
| Industrials | +16%+ | +1.36 pp | Caterpillar, GE Vernova |
| Consumer Defensives | +13.3% | +0.6 pp | Walmart (+13.7%), Costco |
| Energy | +22%+ | +0.64 pp | Exxon Mobil, Chevron |
These figures, reported by Morningstar through 18 February 2026 with performance trends extending into mid-year, gain their full weight in context. The Morningstar US Market Index returned just +0.93% over the same period. Industrials outperformed the broad market by roughly 17 times. Energy outperformed by more than 23 times.
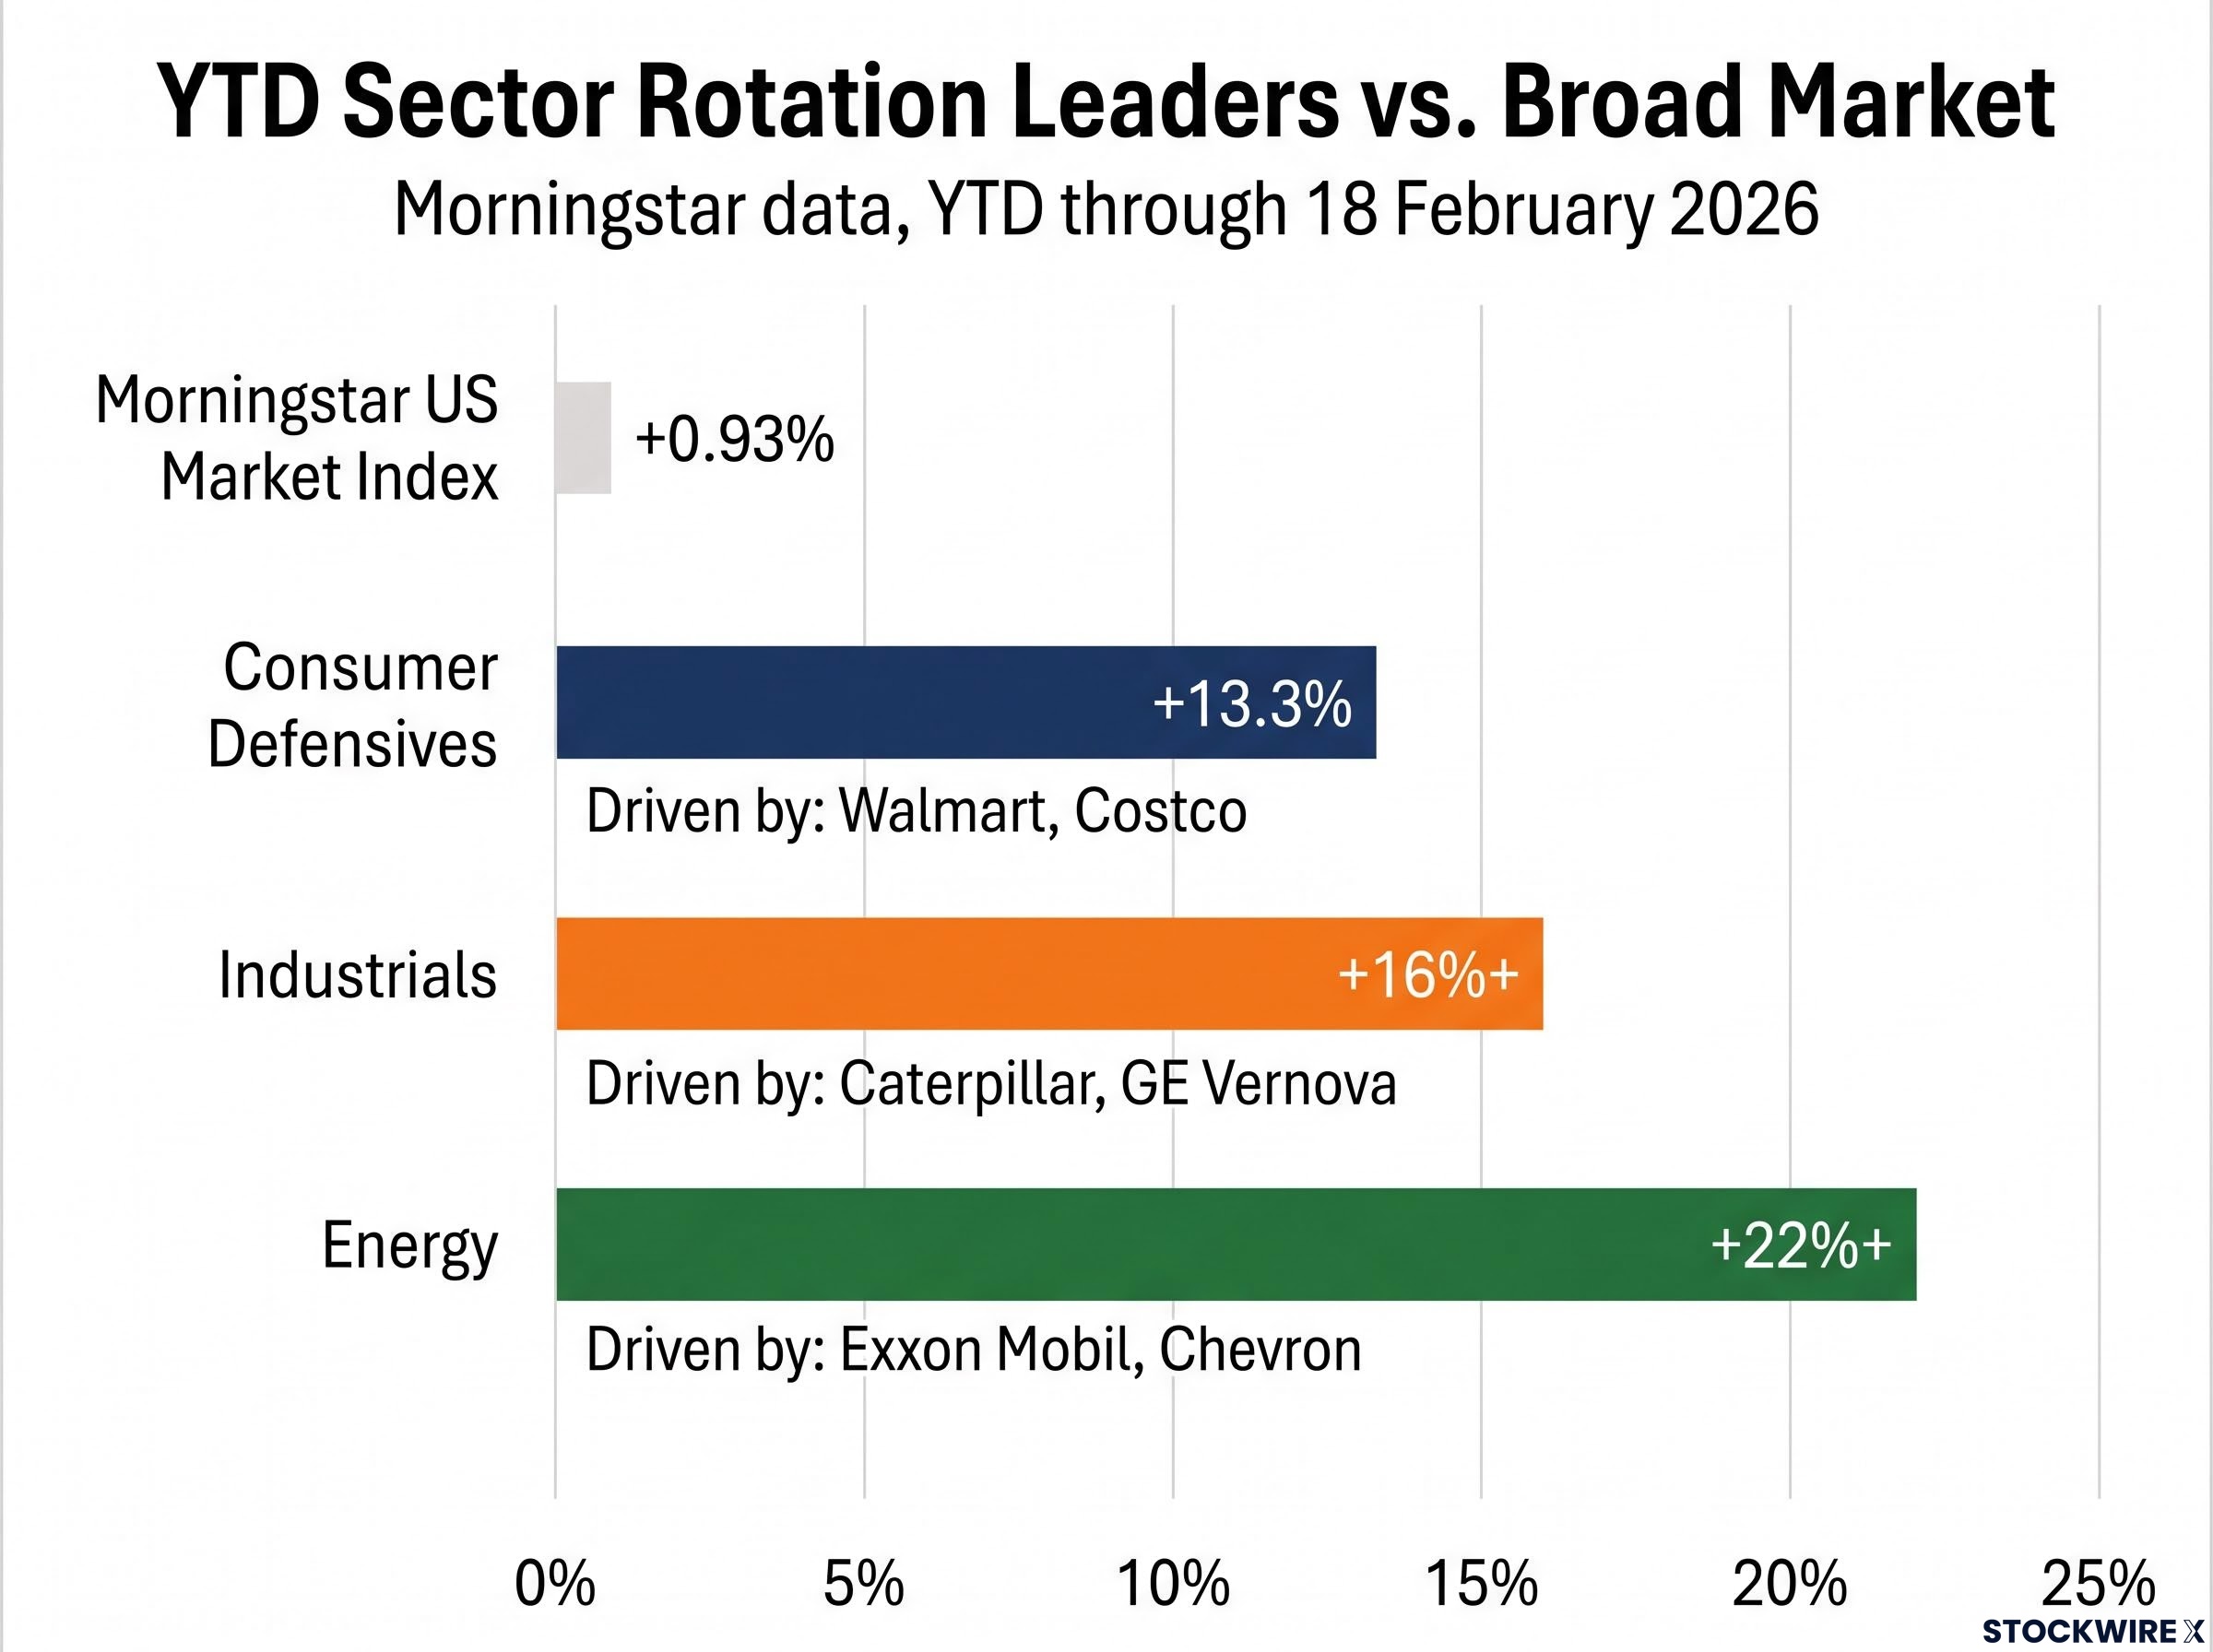
Energy stocks rose more than 22% year-to-date, making the sector the best-performing major segment of the US equity market in the first half of 2026, with Exxon Mobil and Chevron as the largest individual contributors, according to Morningstar data.
Walmart alone accounted for 2.3 percentage points of the consumer defensive sector’s 13.3% gain, illustrating how concentrated the contributions have been even within the rotation beneficiaries. Strategists have also highlighted Verizon and Duke Energy as undervalued income plays within the broader value reallocation, emphasising the barbell approach of selling AI profits to fund defensive income exposure.
How sector rotation works and why it keeps happening in every market cycle
Sector rotation refers to the systematic movement of institutional capital from richly valued, recently outperforming sectors toward cheaper, underperforming sectors offering better forward risk/reward. It is distinct from general market selling or de-risking. In a rotation, the total equity allocation may remain unchanged; the distribution across sectors shifts.
The mechanism is straightforward. When one sector has absorbed a disproportionate share of capital, its forward returns compress. Meanwhile, neglected sectors accumulate a valuation gap. Institutional portfolio managers, benchmarked against broad indexes, eventually reweight toward the laggards to capture relative value. The 2026 pattern fits this framework precisely: the Morningstar US Market Index returned just +0.93% year-to-date, yet individual sectors delivered 13-22% gains, making sector selection the dominant return driver.
The breadth confirmation is significant. Small-cap, mid-cap, and emerging-market equities hitting 52-week highs indicates reallocation across size and geography, not merely sector reshuffling within large caps.
Reading relative-strength ratios in practice
The practitioner tool for tracking rotation is the relative-strength ratio: a sector ETF’s price divided by SPY. When this ratio is in an uptrend with higher highs and higher lows, the sector is gaining institutional favour on a persistent basis.
| Ratio | What It Tracks | Bullish Signal Criteria |
|---|---|---|
| XLK/SPY | Technology leadership vs. broad market | Sustained break below 50-day and 200-day MAs confirms structural rotation away from tech |
| XLI/SPY | Industrials relative strength | Uptrend with higher highs and higher lows |
| XLP/SPY | Consumer defensives relative strength | Uptrend; pullbacks hold at rising moving averages |
| XLE/SPY | Energy relative strength | Sustained uptrend; higher lows; support at rising MAs |
Volume provides the confirmation layer. Heavier volume on breakouts in rotation leaders and on breakdowns in laggards separates genuine institutional accumulation from short-covering. Lighter volume on bounces in underperforming sectors suggests the move lacks conviction.
Relative-strength ratios like XLI/SPY and XLE/SPY are the practitioner’s shorthand for tracking institutional preference, but the Relative Rotation Graph extends this approach by plotting all 11 sector ETFs simultaneously, making quadrant transitions and momentum shifts visible before they are confirmed by price alone.
The price levels that will confirm or kill this rotation thesis
The technical signals and performance data presented across the preceding sections converge on a set of specific price levels. These levels function as a unified monitoring framework rather than isolated data points.
| ETF | Key Support | Next Resistance | Bearish Invalidation Trigger |
|---|---|---|---|
| XLK | XLK/SPY ratio at 0.2422 | N/A (watching for breakdown) | Sustained break below 0.2338 on XLK/SPY ratio |
| XLV | April 2026 low | US$155 | Failure to hold April low on retest |
| XLRE | US$43 | US$45 | Break back below US$43 into prior range |
| XLI | Recent breakout zone (former resistance as support) | Above breakout continuation | Full retrace into prior trading range |
| XLE | Breakout region near latest oil price move | Above breakout continuation | Loss of breakout support alongside falling crude |
The macro confirmation layer operates alongside these ETF-level signals:
- Rate expectations: Bond markets pricing a less restrictive or peak-rate Fed environment favours value, cyclicals, and income sectors over long-duration growth
- Earnings revisions: Sustained upgrades for industrials, energy, and staples alongside stable or slowing revisions for technology would reinforce the rotation thesis; the reverse would undermine it
The Federal Reserve rate policy calendar provides the scheduled FOMC meeting dates against which bond markets price rate expectations, making it a practical reference for investors tracking whether shifts in the discount rate environment are likely to extend the current tailwind for value and cyclical sectors.
A sustained break below the 50-day and 200-day moving averages on the XLK/SPY ratio would signal a structural rather than tactical rotation, the difference between a temporary de-crowding and a genuine change in market leadership.
What the data is telling investors to do right now
The asymmetry in 2026 returns is difficult to ignore. Energy has gained more than 22%, industrials more than 16%, and consumer defensives 13.3%, all against a broad market return of just 0.93%. As of 17 June 2026, the rotation appears technically intact across multiple sectors.
A structured positioning review can help clarify next steps:
- Assess current technology weighting. Portfolios concentrated in AI and mega-cap growth have benefited from prior years’ momentum but now face compression risk. The barbell approach, retaining core quality tech positions while reallocating a portion of gains, is the framework institutional strategists have advocated. Verizon and Duke Energy have been specifically highlighted as undervalued income plays for the defensive side of that barbell.
- Check key ETF levels against current market prices. The table in the preceding section provides specific support and resistance levels for XLK, XLV, XLRE, XLI, and XLE. These are the objective reference points for whether the rotation thesis is holding or breaking down.
- Identify sectors and price zones for potential reallocation. Healthcare at US$155 resistance and real estate at US$43 support offer the cleanest defined-risk setups among the rotation beneficiaries, precisely because they were such significant underperformers in 2025.
The rotation remains characterised as tactical rather than structural. It is a reason to rebalance toward better risk/reward, not to abandon technology’s long-term thesis. Rotation patterns can reverse quickly, and the price levels outlined above serve as the objective exit criteria if the thesis breaks down.
For investors evaluating how to implement the rotation through individual names like Caterpillar, Exxon Mobil, and Verizon versus sector ETFs like XLI and XLE, our dedicated guide to stocks versus ETFs covers the cost, tax, and concentration trade-offs that determine which vehicle is appropriate for each position size and holding period.
This article is for informational purposes only and should not be considered financial advice. Investors should conduct their own research and consult with financial professionals before making investment decisions. Past performance does not guarantee future results.