Why 2026 Market Volatility Feels Worse Than the Data Shows
1 hr ago

BCA Research’s MacroQuant model, a quantitative framework that synthesises more than 200 macroeconomic and financial indicators into a single equity risk score, has crossed a threshold that has historically preceded bear markets. The model’s equity z-score fell to -1.01 on Friday 13 June 2026, breaching the -1.0 level that the firm had publicly flagged as the boundary between caution and alarm. In response, Peter Berezin, BCA’s chief global strategist, moved equity allocation to a modest underweight across both 3-month and 12-month horizons, the first reduction of the current cycle.
What follows is a breakdown of what the MacroQuant model measures, why the -1.0 threshold carries statistical weight, which specific factors pushed the score below the line, how BCA’s positioning playbook responds, and what caveats Berezin himself attached to the call.
The breach was precise: an equity z-score of -1.01, crossing below -1.0 on Friday 13 June 2026. That single hundredth of a point below the threshold was enough to activate the first stage of BCA’s pre-defined positioning response.
It was not a surprise. BCA had warned in prior published research that the score was moving toward the danger zone, using language that left little ambiguity about where the firm drew the line.
The breach on 13 June did not arrive without warning: BCA’s pre-trigger analysis, published just days earlier, documented the z-score at -0.69 and detailed the household equity exposure and savings rate deterioration that were already building pressure on the model’s inputs.
BCA had previously noted the equity z-score was “dangerously close” to the -1.0 threshold, a level the firm has identified as historically preceding equity bear markets.
Berezin’s response was measured. The move was to a modest underweight, not a dramatic exit from equities. Both the 3-month and 12-month horizons were adjusted, signalling that BCA views the risk as relevant across near-term and intermediate timeframes. The allocation shift was rules-based, triggered by a quantitative threshold rather than a discretionary judgment call, which gives it particular weight as a systematic risk signal.
MacroQuant is not a single indicator. It is a multi-module framework that draws on more than 200 leading indicators spanning economic growth, inflation, monetary policy, investor sentiment, and valuation. Each module processes its own cluster of inputs and produces a reading. Those module outputs are then aggregated into a single equity z-score, which quantifies how far current conditions deviate from historical norms.
The table below summarises the model’s core modules and their roles in producing the z-score.
| Module | Input types | Role in z-score |
|---|---|---|
| Growth | Leading economic activity indicators | Measures directional momentum in real economic output |
| Inflation | Price indices, energy costs, supply-side pressures | Captures inflationary headwinds to equity valuations |
| Monetary policy | Central bank rates, yield curves, liquidity measures | Assesses whether policy conditions favour or constrain equities |
| Sentiment | Investor positioning, survey data, risk appetite proxies | Gauges whether positioning is complacent or fearful |
| Valuation | Price-to-earnings ratios, yield spreads, equity risk premia | Benchmarks current prices against historical valuation norms |
Module weights are not fixed. When market focus shifts toward inflation, the inflation module receives proportionally greater weight in the aggregated signal. When growth concerns dominate, the growth module’s contribution increases. This design, documented in BCA’s “MacroQuant Multiverse Edition” materials, means the model self-calibrates to prevailing conditions rather than applying a static formula regardless of what is driving markets.
The result is a z-score that reflects not just the raw data but the market’s current sensitivity to that data.
Readings below -1.0 have, according to BCA’s back-tested model history, reliably coincided with or preceded equity bear markets. The firm treats this threshold as a statistically grounded boundary, not an arbitrary round number.
Academic research on regime-switching models for bear market prediction demonstrates that combining diffusion indices with principal component analysis from macroeconomic and financial variables produces statistically grounded thresholds, which is precisely the methodological logic underlying why a z-score boundary like -1.0 carries predictive weight rather than functioning as an arbitrary round number.
The distinction matters. A sub-minus-1 reading does not guarantee a bear market. It signals that current conditions statistically resemble the configurations that preceded past equity downturns.
A z-score below -1.0 signals that current macroeconomic and financial conditions resemble historical pre-bear market regimes. It represents a probabilistic warning, not a deterministic prediction of a downturn.
The current reading of -1.01 sits just below the line. The breach is narrow, but within a model designed around precise thresholds, narrow breaches are still breaches. BCA’s own prior guidance stated that moves below -1.0 warranted a shift to an underweight stance, and that is exactly what Berezin executed.
For institutional investors weighing this signal against their own risk frameworks, the framing is probabilistic: outcomes are distributed across a range, with the sub-minus-1 reading shifting the distribution unfavourably rather than collapsing it into a single bearish conclusion.
The contrarian case for equities draws on a different reading of the same sentiment data: the University of Michigan’s April 2026 consumer confidence index hit an all-time low while the S&P 500 sat near its highs, and historical precedent including the 2022 sentiment trough suggests that record pessimism has more reliably marked market bottoms than the onset of sustained declines.
Two specific modules pushed the z-score through the -1.0 floor:
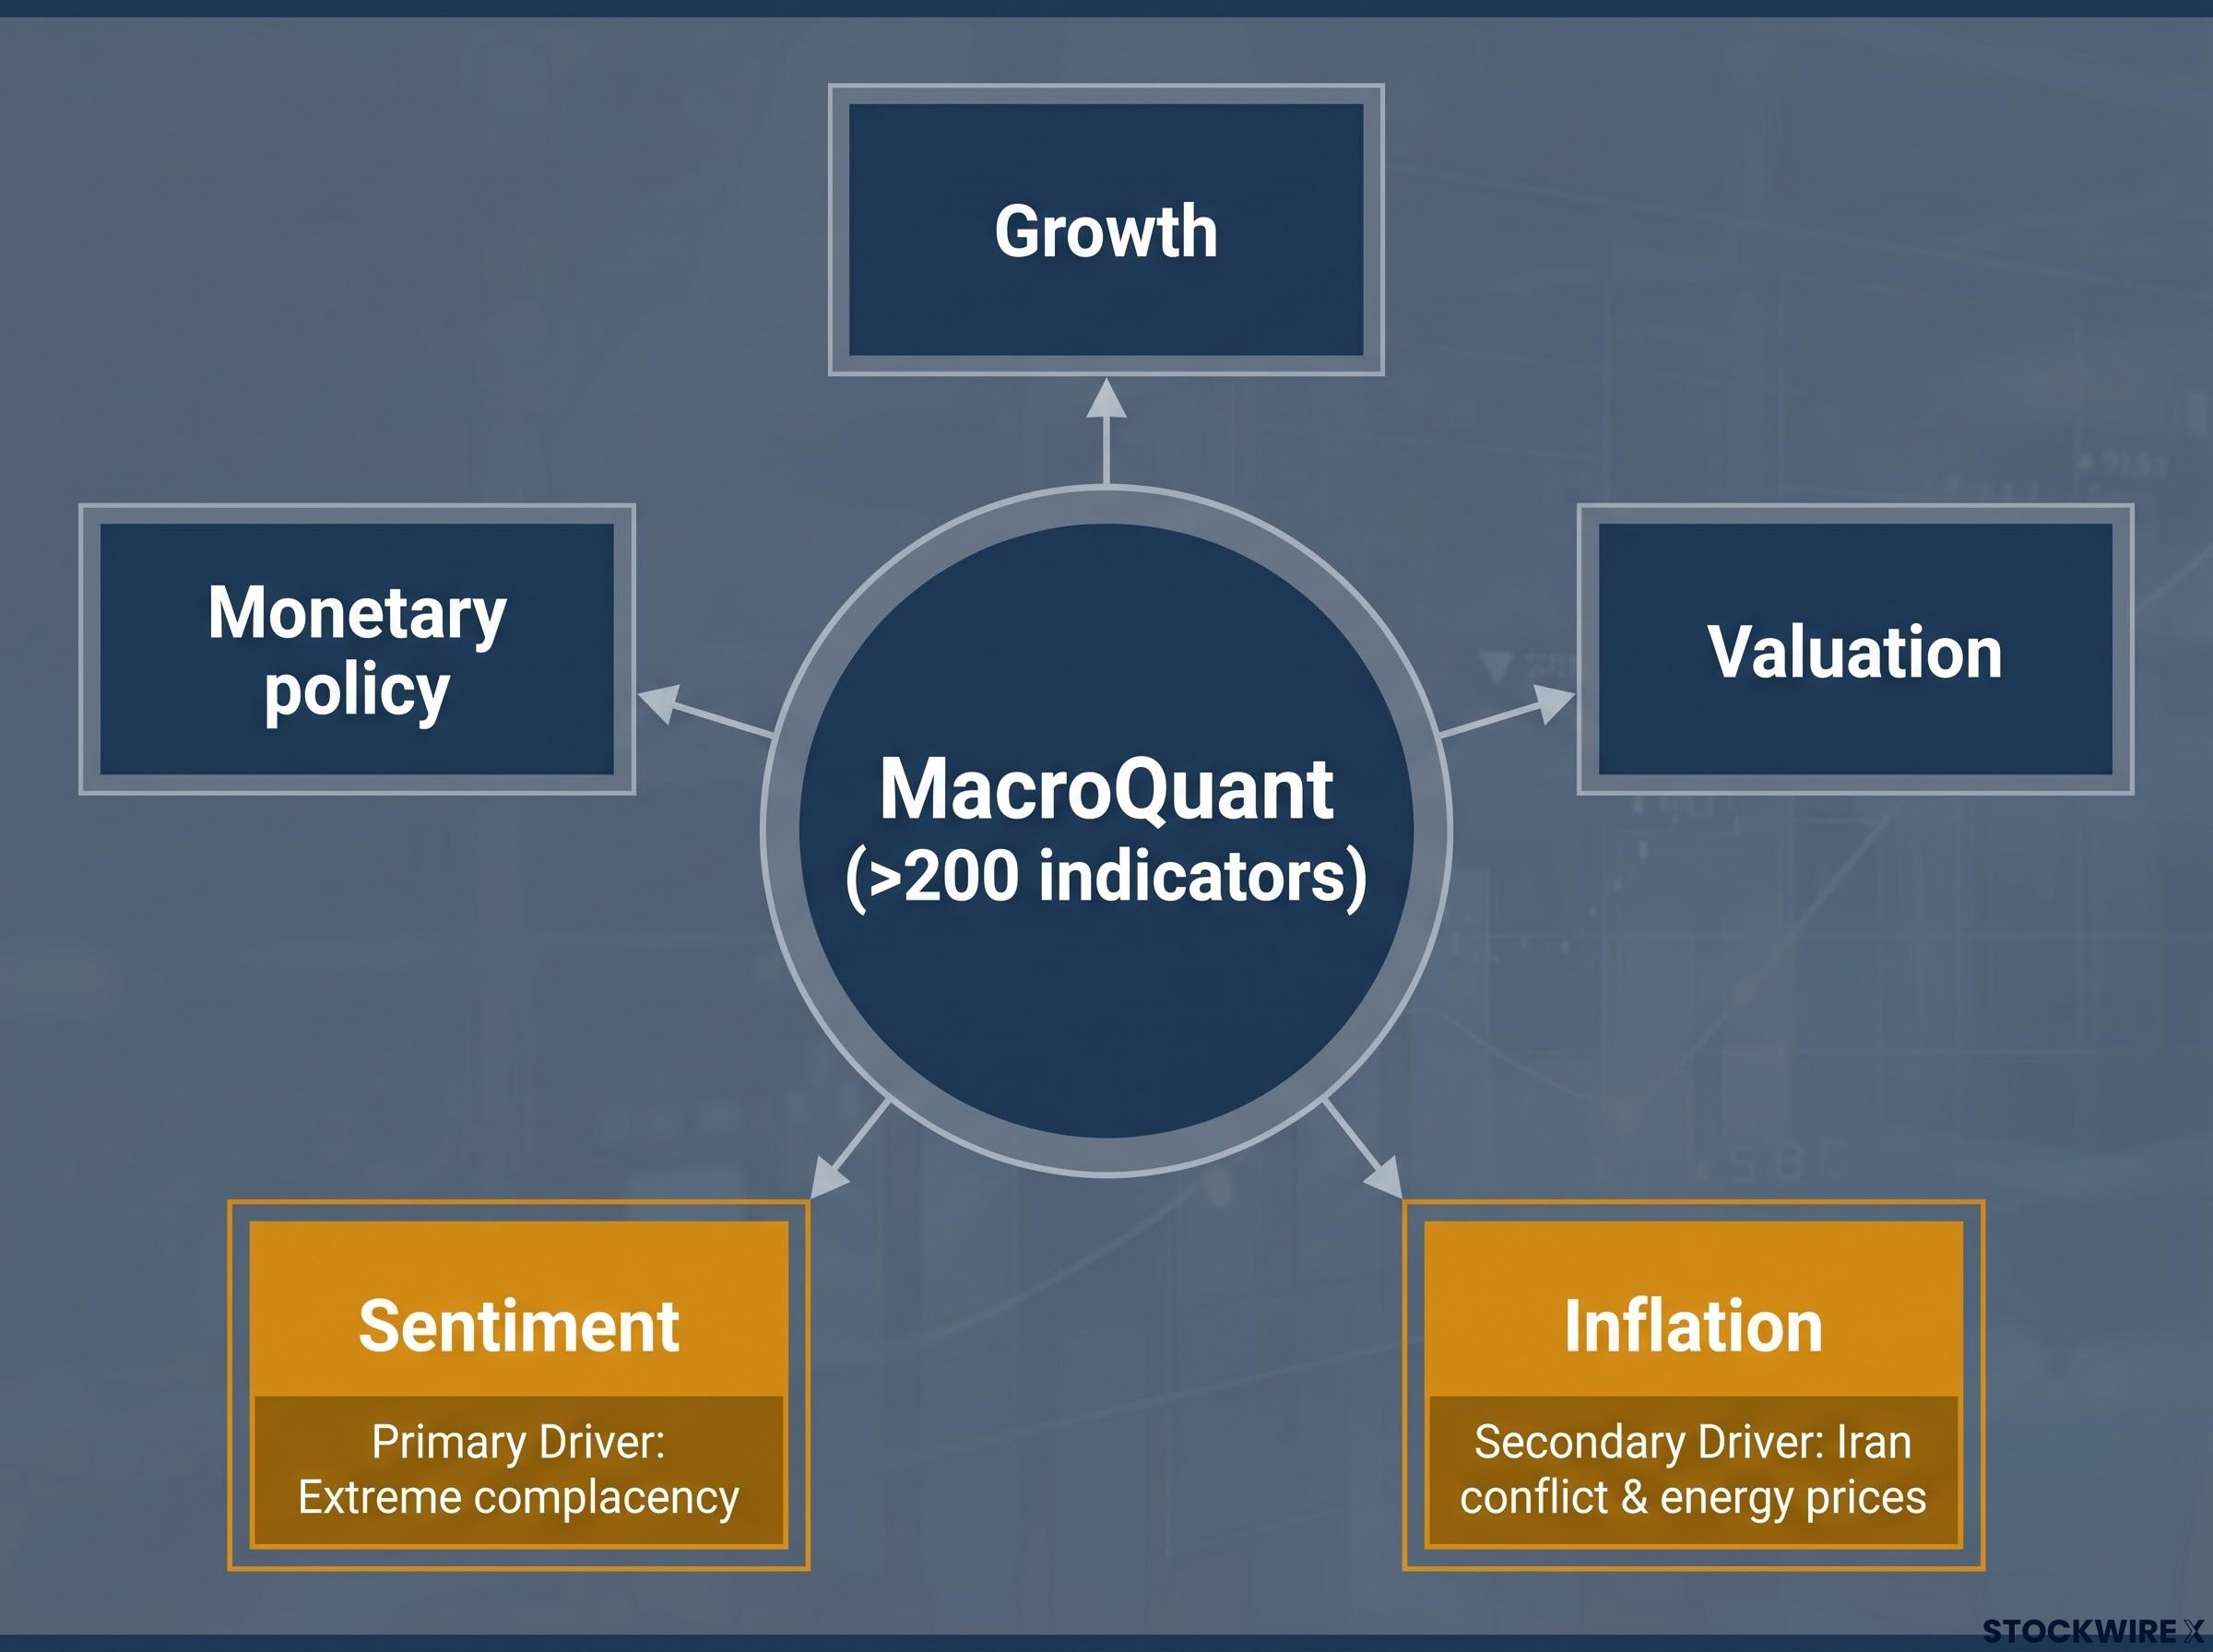
Berezin flagged extreme investor complacency as especially concerning given the uncertain macroeconomic environment, noting that the sentiment module’s current reading signals positioning that is dangerously unconcerned relative to prevailing risks.
BCA’s complacency reading is not an isolated institutional warning: Goldman Sachs’s sentiment indicator reached 1.7 in May 2026, a level the firm’s own historical data links to below-average S&P 500 returns over the following two to eight weeks, adding a second quantitative signal from a different methodological tradition pointing in the same direction.
The two drivers carry different implications for duration. If the Iran conflict moves toward resolution, inflationary pressures within the model could ease relatively quickly, potentially lifting the z-score. Complacency, however, is a behavioural condition that tends to correct only after a market shock has already occurred. That asymmetry is what makes the sentiment reading the more structurally persistent concern.
Reporting on the Iran-US deal and Strait of Hormuz energy flows published on 16 June 2026 shows oil prices responding to a tentative diplomatic agreement, illustrating how quickly the inflation module’s inputs could shift if geopolitical conditions ease, and why Berezin framed the inflationary driver as the more reversible of the two current concerns.
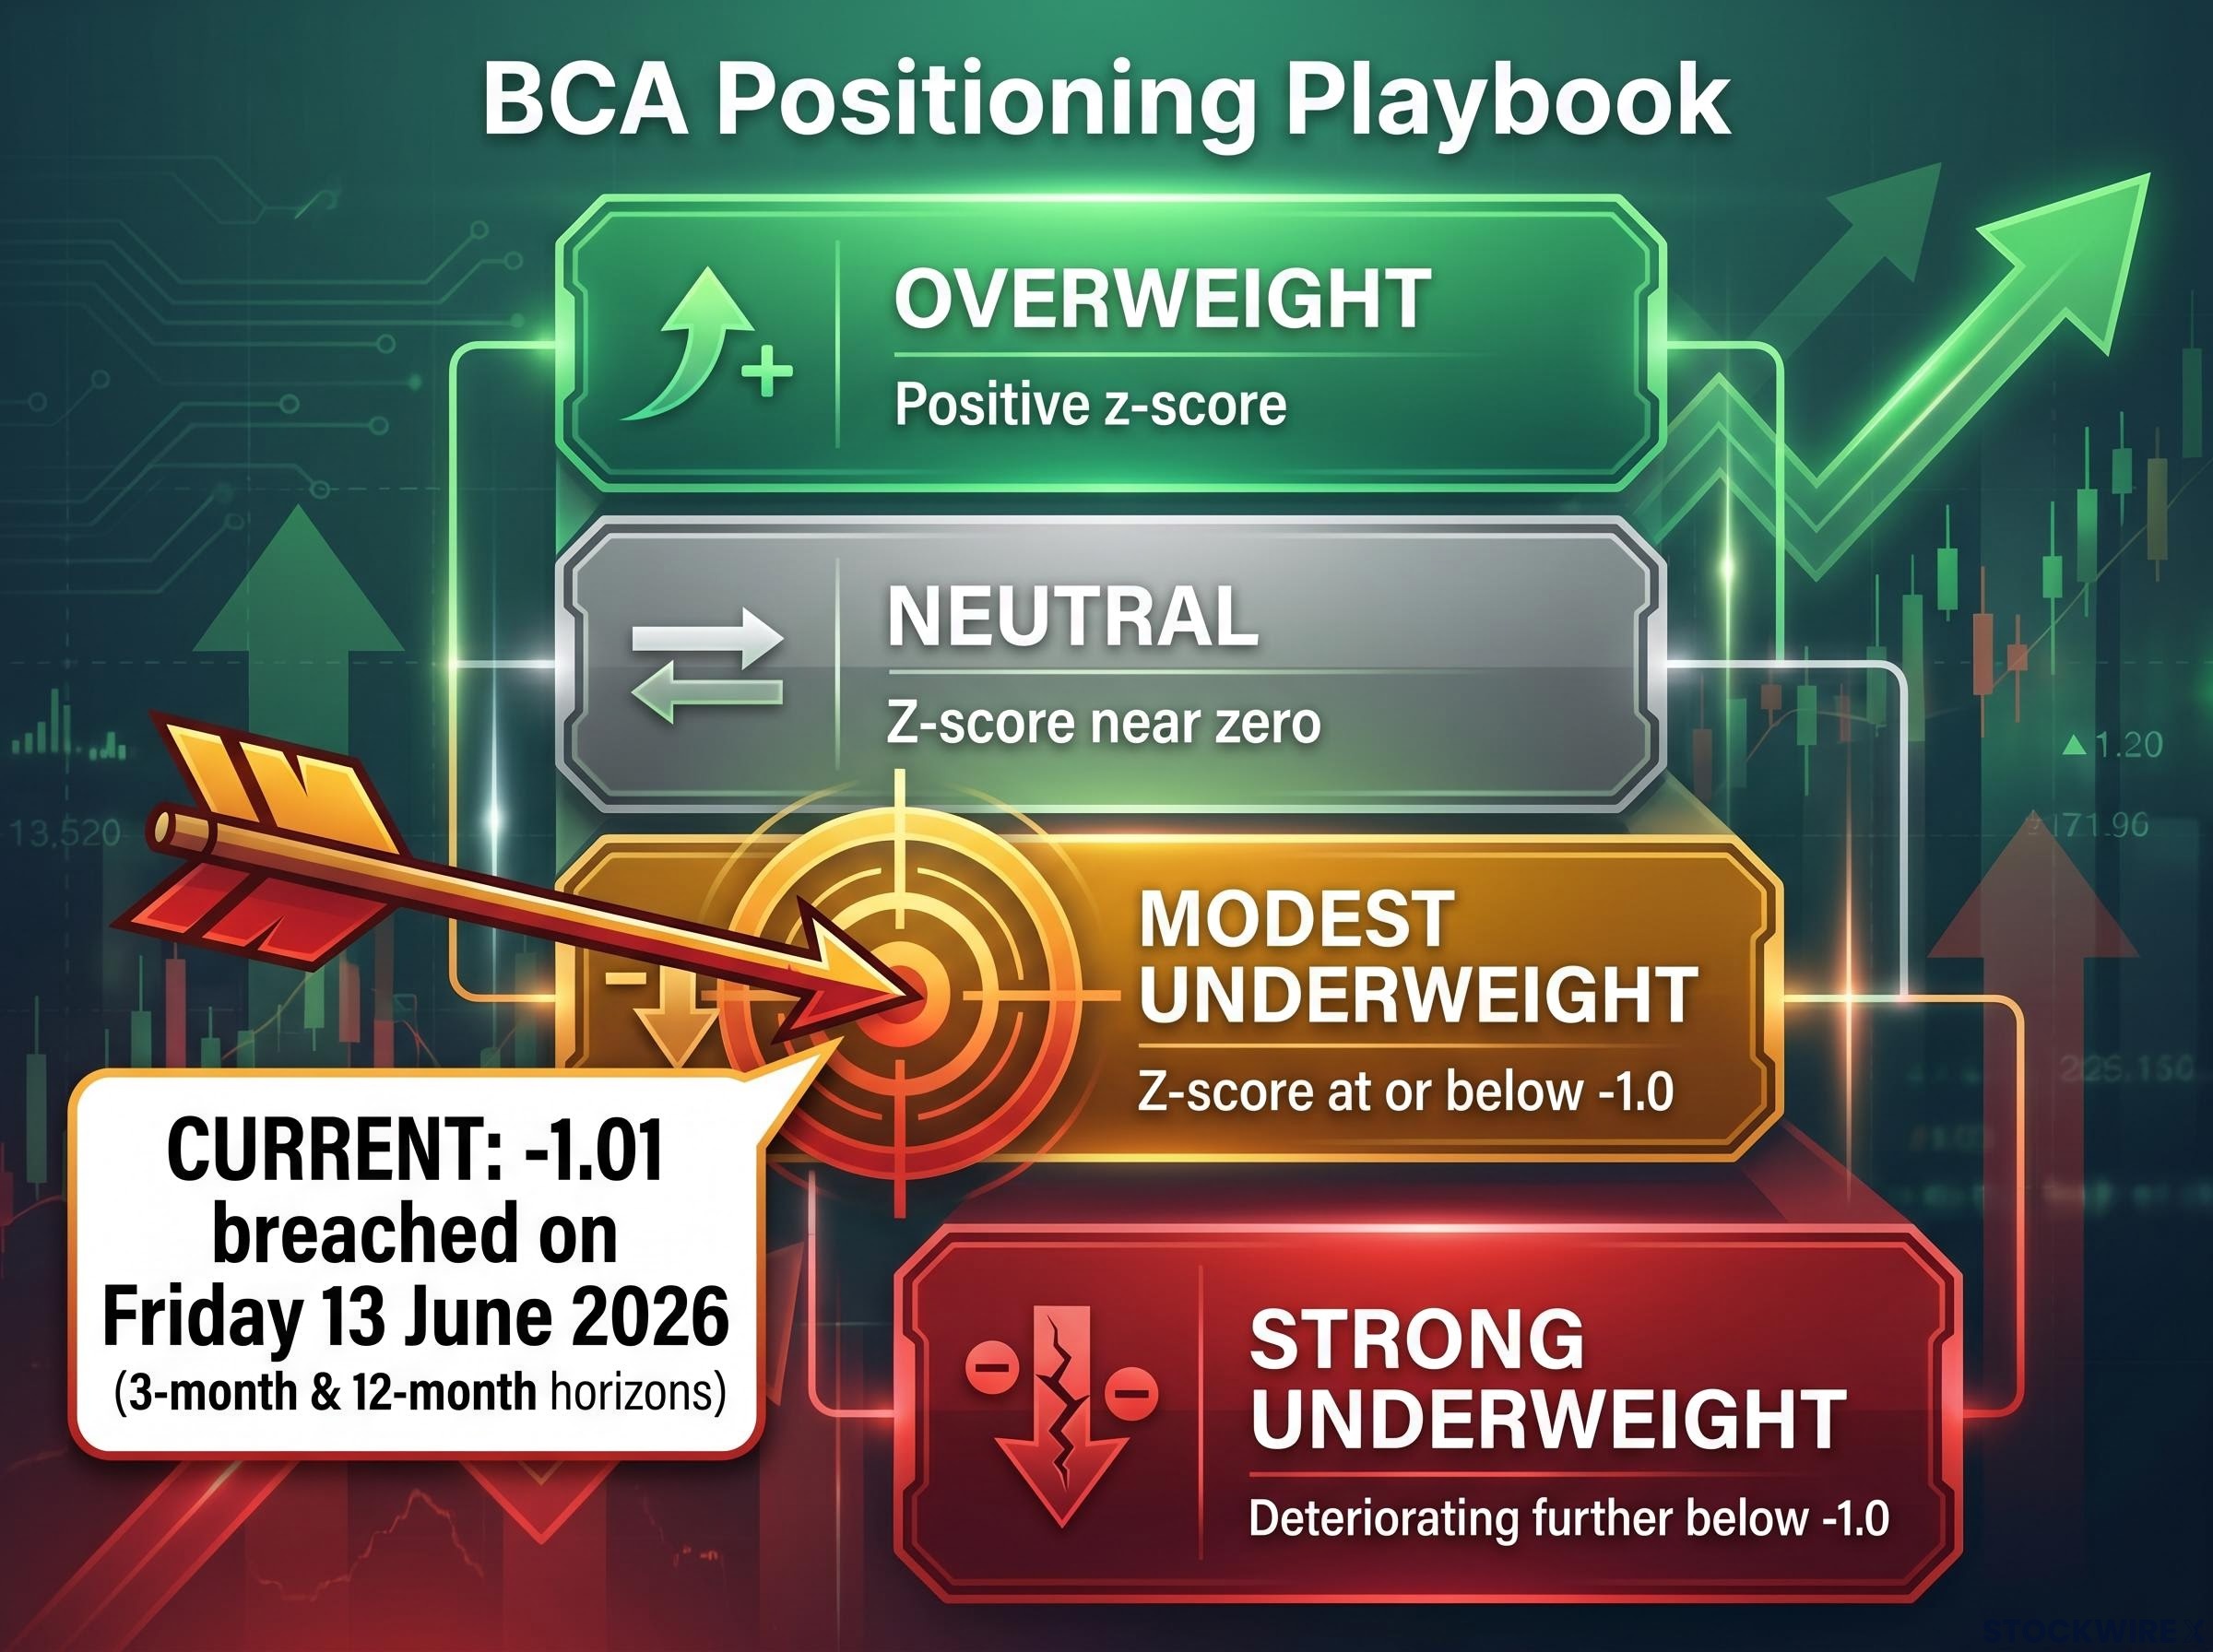
BCA employs a four-stage positioning ladder tied directly to MacroQuant output levels. Each stage carries a defined allocation response, and the transitions between stages are governed by z-score movements rather than discretionary judgment.
| Stage | Implied z-score condition | Allocation response |
|---|---|---|
| Overweight | Positive z-score, favourable macro conditions | Above-benchmark equity exposure |
| Neutral | Z-score near zero, mixed signals | Benchmark equity weight |
| Modest underweight | Z-score at or below -1.0 | Below-benchmark equity; initial defensive posture |
| Strong underweight | Z-score deteriorating further below -1.0 | Significantly reduced equity; full defensive positioning |
The current stance sits at the modest underweight stage, triggered by the -1.01 reading. Two contingency paths are explicitly in play. If the z-score deteriorates further, BCA’s playbook calls for escalation to a full underweight. If the model’s outlook improves, particularly through easing inflation indicators, Berezin indicated a willingness to revert to neutral.
Both directions remain live. This is a dynamic, bidirectional call, not a fixed bearish position.
Berezin did not present the signal without qualification. He attached two specific caveats that frame the boundaries of the model’s reliability in the current environment.
MacroQuant is backward-looking by design, calibrated on decades of historical relationships between macro variables and equity outcomes. The current political environment, marked by rapid and unpredictable policy changes, presents a challenge: the model’s training data may not contain analogues for the speed and direction of current policy shifts.
If AI materially alters productivity, inflation dynamics, and market behaviour, the historical patterns embedded in the model may need recalibration. This is not a flaw unique to MacroQuant; any historically calibrated model faces the same question when confronted with potentially structural change.
Berezin’s caveat about AI representing a potential structural break applies equally to forecasting tools beyond MacroQuant: model blind spots and tail risk hedging strategies become especially relevant when AI large language models are structurally biased toward median outcomes and prediction markets thin out precisely in the low-probability, high-consequence scenarios that matter most for portfolio protection.
Berezin’s framing was direct: the model is flashing red, and BCA is acting on it. But the strategist acknowledged that the signal may be less reliable in an environment defined by genuine structural novelty. That acknowledgment is not a retraction; it is a calibration of appropriate confidence.
BCA Research operates as an independent macro-research provider. Its allocation calls are not tied to trading or underwriting relationships, which gives them particular standing as impartial signals among institutional clients.
The MacroQuant signal represents a statistically grounded warning that current conditions resemble past pre-bear market regimes. It warrants portfolio risk review. It does not constitute a directive to fully exit equities.
The variables that will determine whether the signal escalates or fades are specific and monitorable:
Investors who treat this as one well-constructed probabilistic input, weighed alongside their own frameworks, are better positioned than those who either overweight or dismiss institutional quantitative signals.
This article is for informational purposes only and should not be considered financial advice. Investors should conduct their own research and consult with financial professionals before making investment decisions. These statements are speculative and subject to change based on market developments and company performance.
The BCA Research MacroQuant model is a quantitative framework that synthesises more than 200 macroeconomic and financial indicators across five modules (growth, inflation, monetary policy, sentiment, and valuation) into a single equity z-score, with dynamic weighting that self-calibrates based on prevailing market conditions.
The signal means BCA has moved to a modest underweight in equities across both 3-month and 12-month horizons, reflecting a probabilistic warning that current conditions resemble historical pre-bear market regimes, though it is not a directive to fully exit equities.
BCA Research treats a z-score below -1.0 as the boundary between caution and alarm, a threshold their back-tested model history associates with conditions that have reliably coincided with or preceded equity bear markets.
Two modules drove the breach: the sentiment module, reflecting extreme investor complacency in positioning, and the inflation module, where elevated energy prices linked to the Iran conflict are exerting additional downward pressure on the equity score.
BCA's chief global strategist Peter Berezin indicated two contingency paths: if the z-score deteriorates further the firm would escalate to a full underweight, but if inflation indicators ease, particularly through resolution of geopolitical tensions affecting energy prices, BCA could revert to a neutral equity stance.