
SpaceX IPO Lockup: 83% of Insider Shares Unlock Before 180 Days
39 mins ago

A stock trading at 49 times earnings sounds like a speculation trap. A stock trading at under 6 times sales sounds like a cautious, mature investment. By the end of this analysis, both of those intuitions will be wrong. Conventional valuation metrics, PE ratios, price-to-sales, and dividend streaks, give investors a surface reading of price. They do not tell investors what the price actually demands of the underlying business. The implied growth rate framework solves that problem by reverse-engineering the specific annual revenue growth a current stock price requires over a 10-year horizon, then asking one question: has the company ever demonstrated anything close to that rate? What follows applies that framework to four stocks American investors hold widely and discuss constantly: Nvidia, Tesla, Johnson & Johnson, and Costco. The results are concrete, quantitative, and in at least two cases, deeply counterintuitive. Readers will leave with a replicable mental model for reading stock prices differently and a clear verdict on which of these four passes the test.
Every stock price implicitly encodes an assumed future business trajectory. It is not a snapshot of current earnings. It is a bet on where the business will be in a decade. The question that matters is not whether the PE ratio looks high or low on a screener; the question is whether the growth rate hidden inside the price is one the business has actually demonstrated.
The specific mechanics of where P/E ratio fails are rooted in how net profit is calculated: depreciation policy, one-off exclusions, and aggressive revenue recognition can all shift the reported figure without changing underlying business economics, which is precisely why two stocks with identical PE ratios can carry dramatically different actual growth demands.
The reverse-engineering methodology works as follows. Apply a sector-appropriate mature exit multiple (price-to-sales) at year 10, then solve backward for the annual revenue growth rate required to justify today’s market capitalisation. The exit multiples used in this analysis reflect where each sector’s mature, established companies typically trade:
“The question is not whether the PE looks high or low. The question is whether the growth rate hidden inside the price is one the business has actually demonstrated.”
The framework treats demonstrated trailing growth rate as the primary reference point against which implied requirements are judged. Not analyst forecasts. Not management guidance. What the business has actually done.
Costco trades at a PE of approximately 49x. That figure triggers most valuation screening tools and trips the overvaluation alarm in many investor heuristics. At a glance, it places Costco in the same pricing tier as high-growth technology companies with far flashier narratives.
The reflex is understandable. A PE of 49x in a retail business with thin operating margins does not look like a conservative bet. It looks like a stock that has gotten ahead of itself.
The price-to-sales ratio tells a different story. Costco’s market capitalisation of approximately $443 billion sits against trailing 12-month revenue of approximately $294 billion, the largest revenue base of the four companies in this analysis. That produces a price-to-sales ratio of approximately 1.5x. For context, Walmart trades below 1x.
At a 1.5x sales exit multiple, the implied annual revenue growth requirement over 10 years is approximately 10%. The company’s trailing 12-month revenue growth is approximately 9%. Its most recent quarterly growth came in at approximately 12% year-over-year.
The price is asking Costco to continue doing what it is already doing.
The elevated PE is a structural feature of Costco’s membership-fee business model, which operates on deliberately thin margins. It is not a signal that the market is embedding extreme growth expectations. The price-to-sales ratio, not the PE, is the informative lens here, and at 1.5x it implies a growth rate that aligns with what the business currently delivers.
Johnson & Johnson is the stock most investors associate with conservative portfolio construction. 64 consecutive years of dividend increases. Low beta. Defensive sector positioning. It appears in institutional recommendations for cautious investors as reliably as any name in American equity markets.
The implied growth analysis produces a finding that sits uncomfortably against that reputation.
J&J’s market capitalisation of approximately $574 billion against trailing 12-month revenue of approximately $96 billion gives it a price-to-sales ratio of approximately 5.8x. Applying a 5x sales exit multiple at year 10, the current price requires approximately 12% annual revenue growth over the next decade. That would take the company’s revenue to approximately $290 billion, roughly three times its current level.
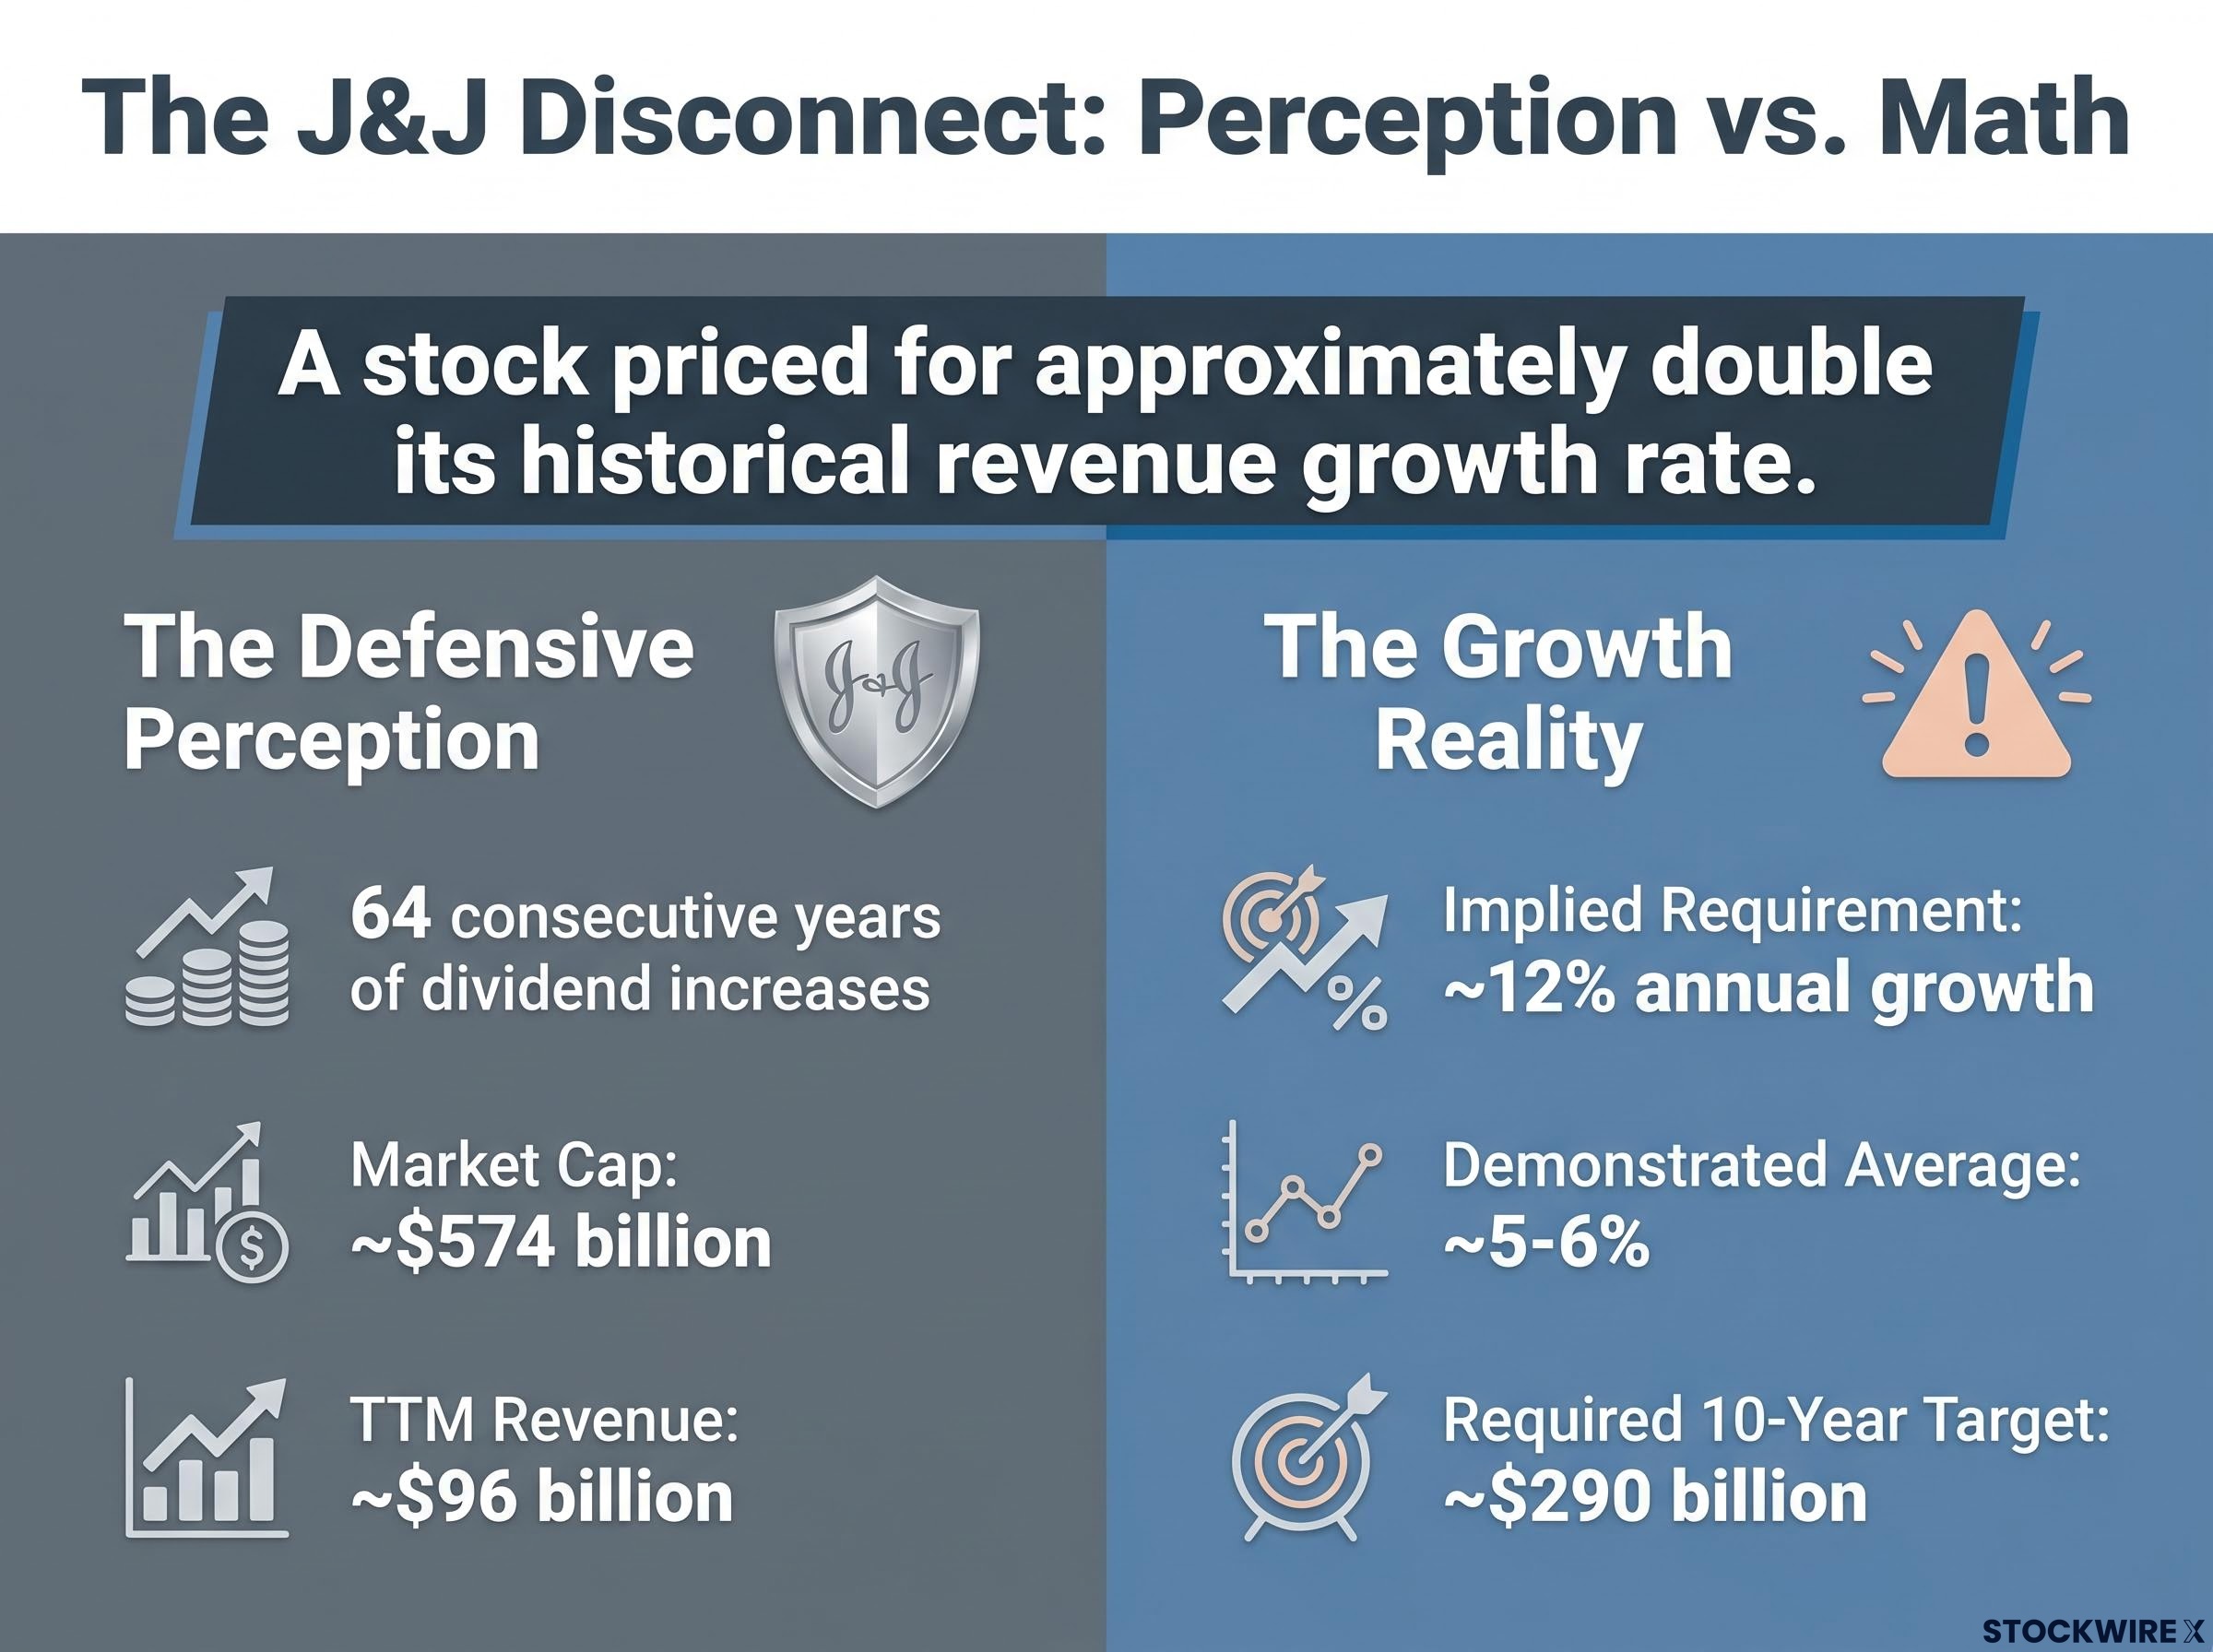
The company’s demonstrated long-term revenue growth over the prior decade, adjusted for the 2023 Kenvue consumer health spin-off, is approximately 5-6% per year.
A stock with 64 years of consecutive dividend increases is currently priced for revenue growth at approximately double its historical rate.
The gap is significant. There is no sustained period in J&J’s history reflecting compounding at anything close to 12% annual revenue growth from this revenue base. Traditional screening metrics, PE ratio, dividend history, low volatility, give investors no visibility into this disconnect. The stock most associated with safety is the one where the gap between implied demand and demonstrated delivery is most invisible.
The value trap risk is most acute precisely in the situation the J&J analysis reveals: a stock with strong conventional signals (dividend streak, low beta, defensive sector) where the underlying growth assumption embedded in the price is structurally misaligned with the business’s demonstrated trajectory.
Implied requirement: approximately 12%. Demonstrated average: approximately 5-6%. That is a stock priced for a structural step-change in growth the company has never sustained.
Nvidia’s market capitalisation of approximately $4.9 trillion against trailing 12-month revenue of approximately $216-253 billion produces an implied annual growth requirement of approximately 20% over 10 years when an 8x sales exit multiple is applied. That would take annual revenue to approximately $1.6 trillion, roughly four times Apple’s current annual revenue.
The company’s most recent year-over-year revenue growth of approximately 73% far exceeds the implied requirement. The demand tailwinds behind artificial intelligence infrastructure spending are real and substantial.
The complication is scale. Sustaining 20% annual compound growth from a base of $216-253 billion is a categorically different challenge than sustaining it from a smaller starting point. No company operating at comparable scale has maintained that pace over a full decade. The revenue destination the price implies is historically unprecedented in absolute terms.
Nvidia is not obviously overvalued by this lens. But the thesis demands the company become the highest-revenue-generating business in recorded corporate history within 10 years.
Semiconductor sector valuations in 2026 show a name-by-name dispersion that mirrors the logic of this framework: Micron trades at under 9x forward earnings while Intel sits at approximately 101x forward earnings, a spread that makes sector-level bubble or value calls nearly meaningless without the underlying growth demand analysis.
Tesla’s market capitalisation of approximately $1.4 trillion against trailing 12-month revenue of approximately $98 billion produces an implied annual growth requirement of approximately 29% over 10 years, even with a generous 3x sales exit multiple (substantially above what conventional automotive peers receive). That trajectory points to approximately $1.3 trillion in annual revenue, larger than Walmart’s current annual revenue of approximately $713 billion.
Against that requirement, Tesla’s trailing 12-month revenue growth is approximately 2%. A partial recovery to approximately 16% in the most recent quarter narrowed the gap, but not enough to change the verdict. The company’s current price-to-sales ratio of approximately 15x is comparable to software sector valuations despite its primary revenue coming from automobile sales.
The gap between what the market demands and what the business has recently demonstrated is very large.
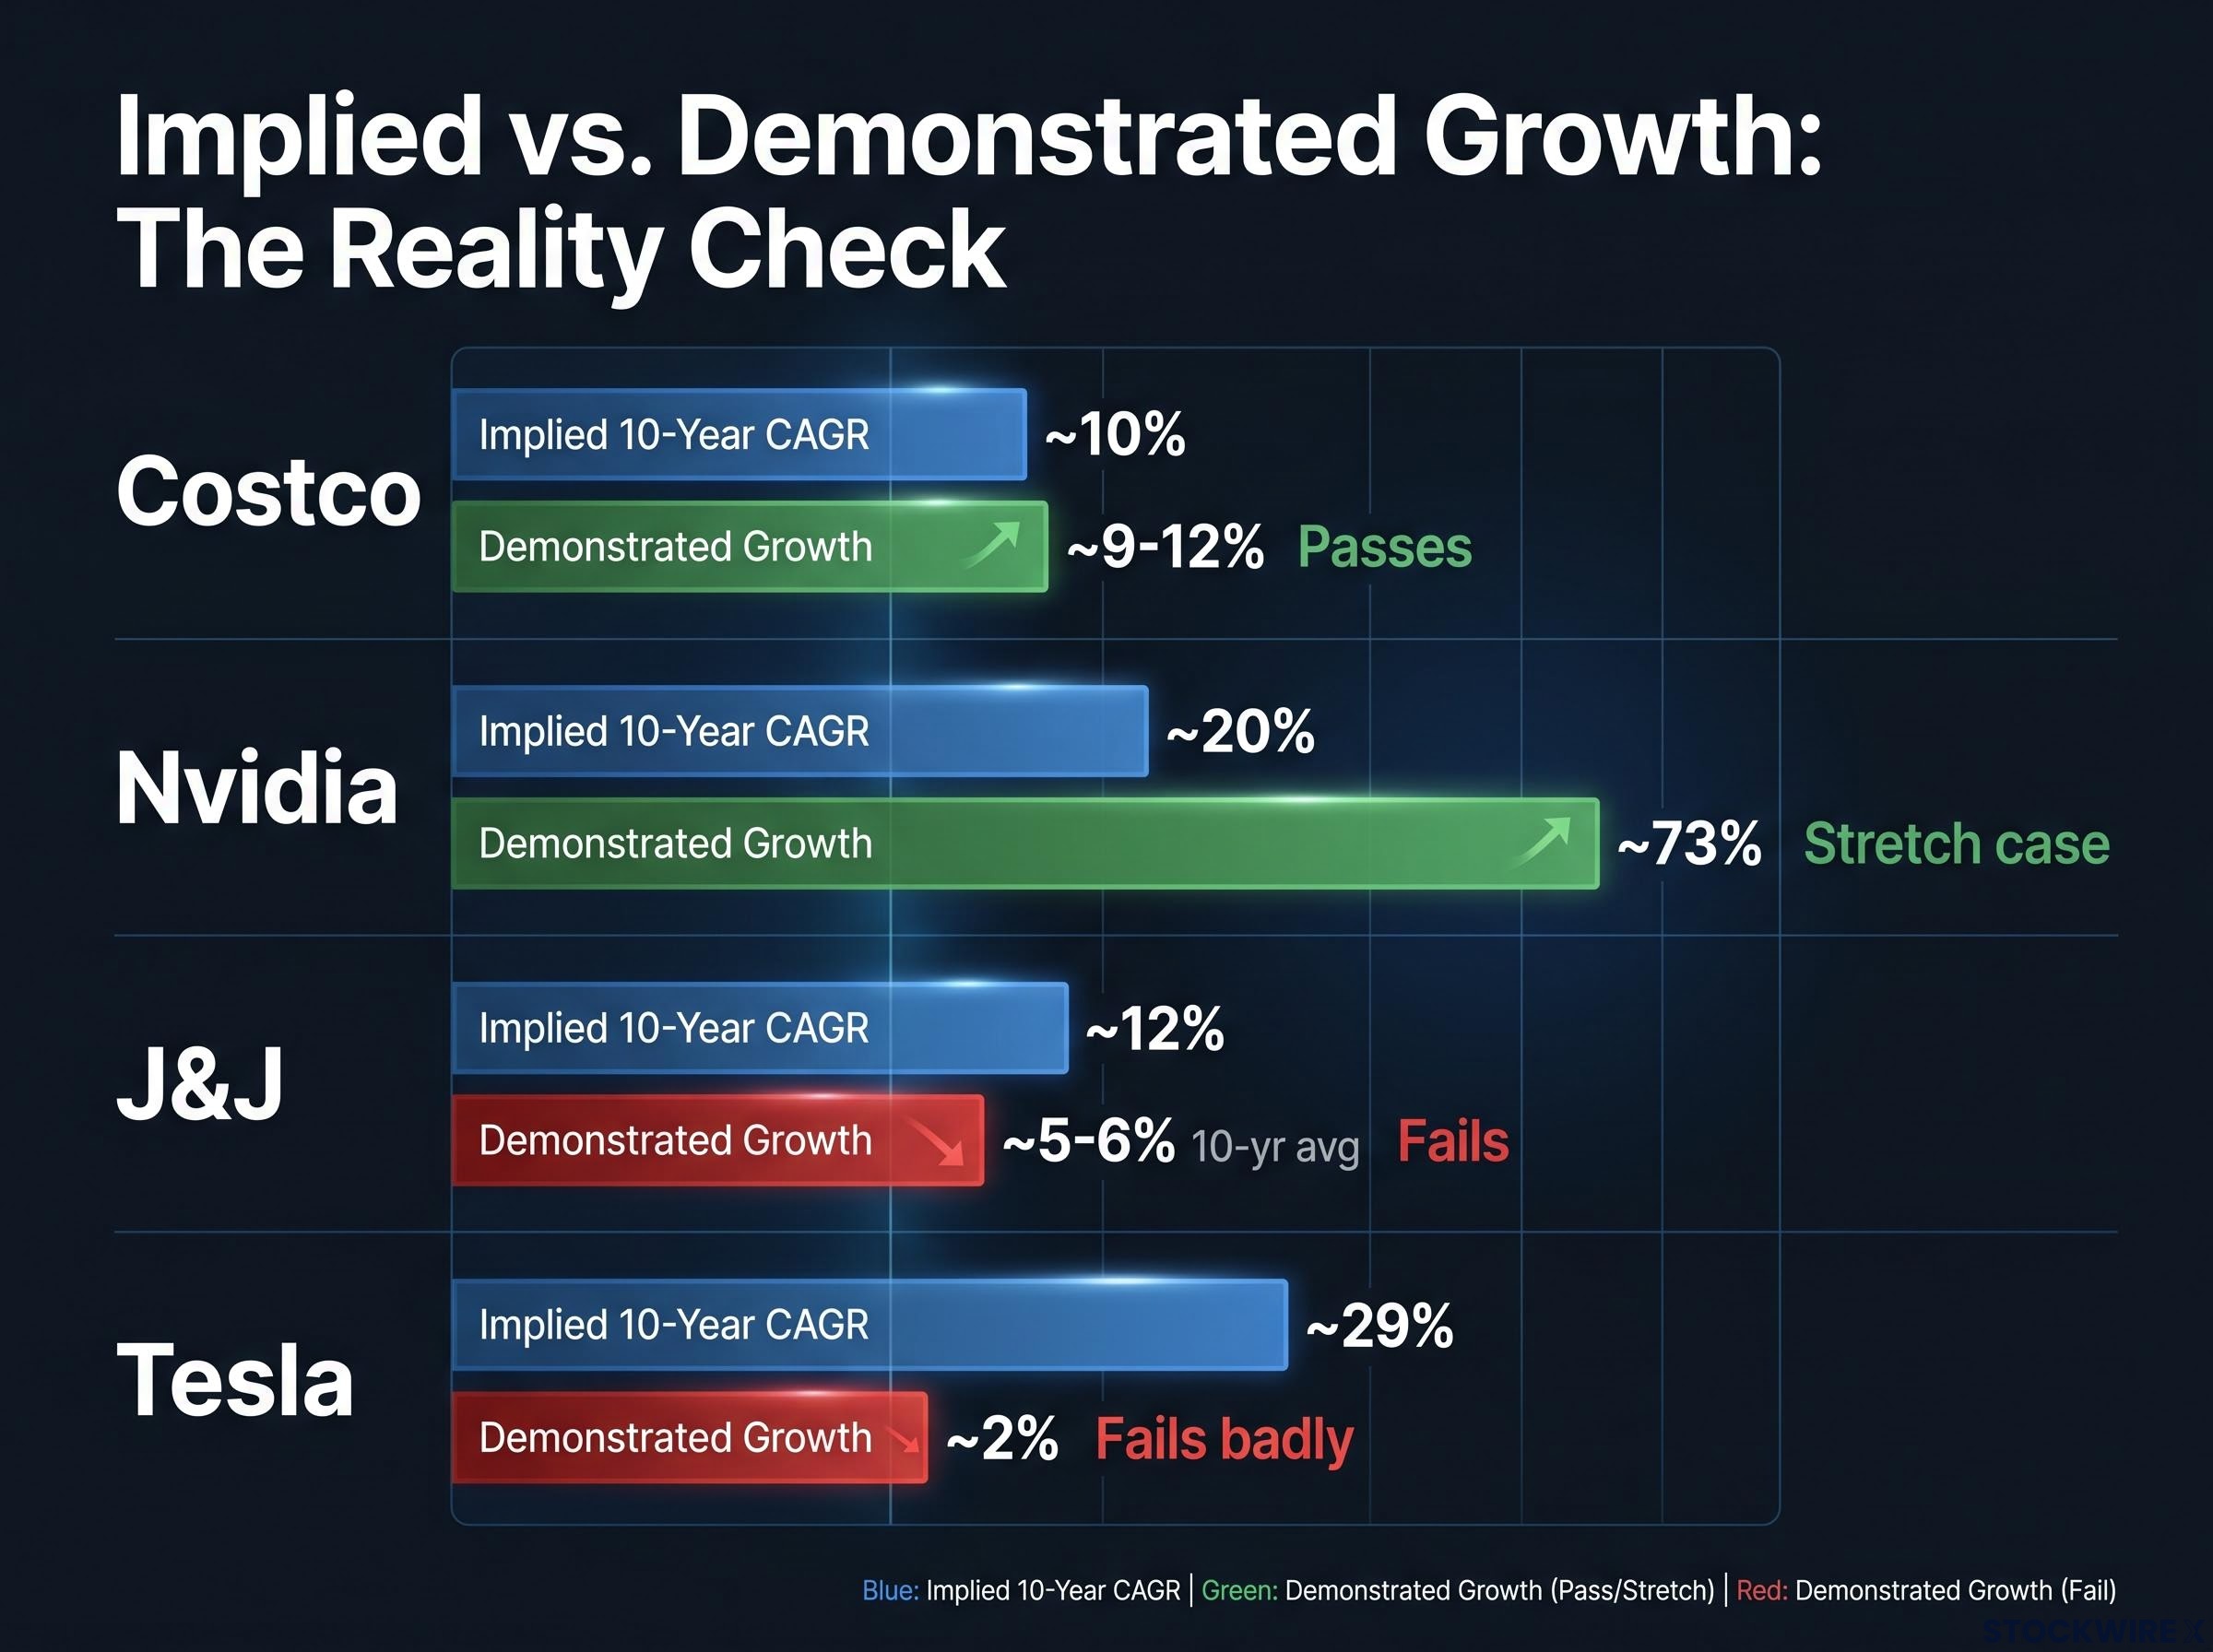
| Company | Implied 10-Year CAGR | TTM Growth | Gap | Verdict |
|---|---|---|---|---|
| Costco | ~10% | ~9-12% | Minimal | Passes |
| Nvidia | ~20% | ~73% | Momentum exceeds, but scale risk | Stretch case |
| J&J | ~12% | ~5-6% (10-yr avg) | ~2x historical rate | Fails |
| Tesla | ~29% | ~2% | Very wide | Fails badly |
Both companies would need to reach revenue levels that no company in recorded corporate history has achieved. That is not impossible. But it is a bet on unprecedented scale, and the framework makes the distinction between a company with real momentum toward that destination and one whose current trajectory points elsewhere.
The analysis above produces verdicts on four specific companies. The more durable takeaway is the framework itself, and it requires only four inputs to run on any stock:
The sector exit multiples used in this analysis serve as reference anchors:
NYU Stern valuation research on exit multiples supports the use of sector-calibrated price-to-sales benchmarks as terminal value anchors, with the specific multiple chosen reflecting where mature, low-growth businesses in each sector ultimately trade once reinvestment opportunities are exhausted.
The framework does not produce a buy or sell signal by itself. It surfaces whether the current price is demanding something unprecedented from the business, which then becomes the right question to investigate further. Demonstrated trailing revenue growth, not analyst consensus forecasts, is the appropriate comparison benchmark because it reflects what the business has actually done.
This lens is most valuable in two situations. Stocks that appear cheap by PE but carry hidden growth assumptions (the J&J pattern). And stocks that appear expensive by PE but whose revenue base makes the implied demand achievable (the Costco pattern). Both are invisible through conventional screening.
The findings land in a sequence that inverts conventional wisdom. The scariest-looking PE (Costco at 49x) passes the test. The safest-looking blue chip (J&J) fails it. The most exciting growth story (Tesla) fails it badly. The most expensive company by market capitalisation (Nvidia) is the one genuinely arguable case.
Every stock price is a forecast about the business’s future trajectory. Most investors have never been shown what that forecast actually is. Conventional valuation vocabulary, PE ratios, dividend streaks, sector labels, systematically obscures the growth assumptions embedded in prices they already hold.
The growth stock discount conditions active in mid-2026 add a macro layer to these verdicts: with growth equities trading at approximately 21% below Morningstar fair value estimates, a level seen less than 5% of the time since 2011, the implied growth requirements embedded in individual prices are being set against a backdrop of compressed multiples across the category, which affects where exit multiples may realistically land in a 10-year horizon.
J&J captures the thesis most sharply: a 64-year dividend growth streak and a stock priced for approximately double the company’s historical revenue growth rate. No conventional screener surfaces that disconnect.
The right first question for any holding is not whether the PE looks high or low. It is: what growth rate is this price demanding, and has this company ever shown it can deliver that?
This analysis is not a recommendation to buy or sell any of the four stocks examined. It is a demonstration that the question investors ask first about price is usually the wrong one, and that the implied growth lens provides a more honest starting point.
This article is for informational purposes only and should not be considered financial advice. Investors should conduct their own research and consult with financial professionals before making investment decisions. Past performance does not guarantee future results. Financial projections are subject to market conditions and various risk factors.
—
The implied growth rate framework reverse-engineers the specific annual revenue growth a stock's current price requires over a 10-year horizon by applying a sector-appropriate mature price-to-sales exit multiple, then comparing that implied requirement to the company's actual demonstrated historical growth rate.
You need four inputs: the current market capitalisation, trailing 12-month revenue, a sector-appropriate mature exit multiple (such as 1.5x for retail or 8x for technology), and then you solve backward for the annual compound growth rate required to justify today's price at that exit multiple in year 10.
Costco's elevated PE of approximately 49x is a structural feature of its membership-fee business model, which operates on deliberately thin margins; its price-to-sales ratio of approximately 1.5x implies only around 10% annual revenue growth, which aligns closely with its current trailing growth rate of 9-12%.
J&J's current market capitalisation implies approximately 12% annual revenue growth over 10 years, roughly double its demonstrated long-term average of 5-6% per year, meaning the stock is priced for a structural step-change in growth the company has never historically sustained.
The article recommends sector-calibrated exit multiples reflecting where mature businesses in each sector typically trade: 8x sales for mature technology, 5x for healthcare, 3x for automotive, and 1.5x for retail, anchored by NYU Stern valuation research on terminal value benchmarks.


