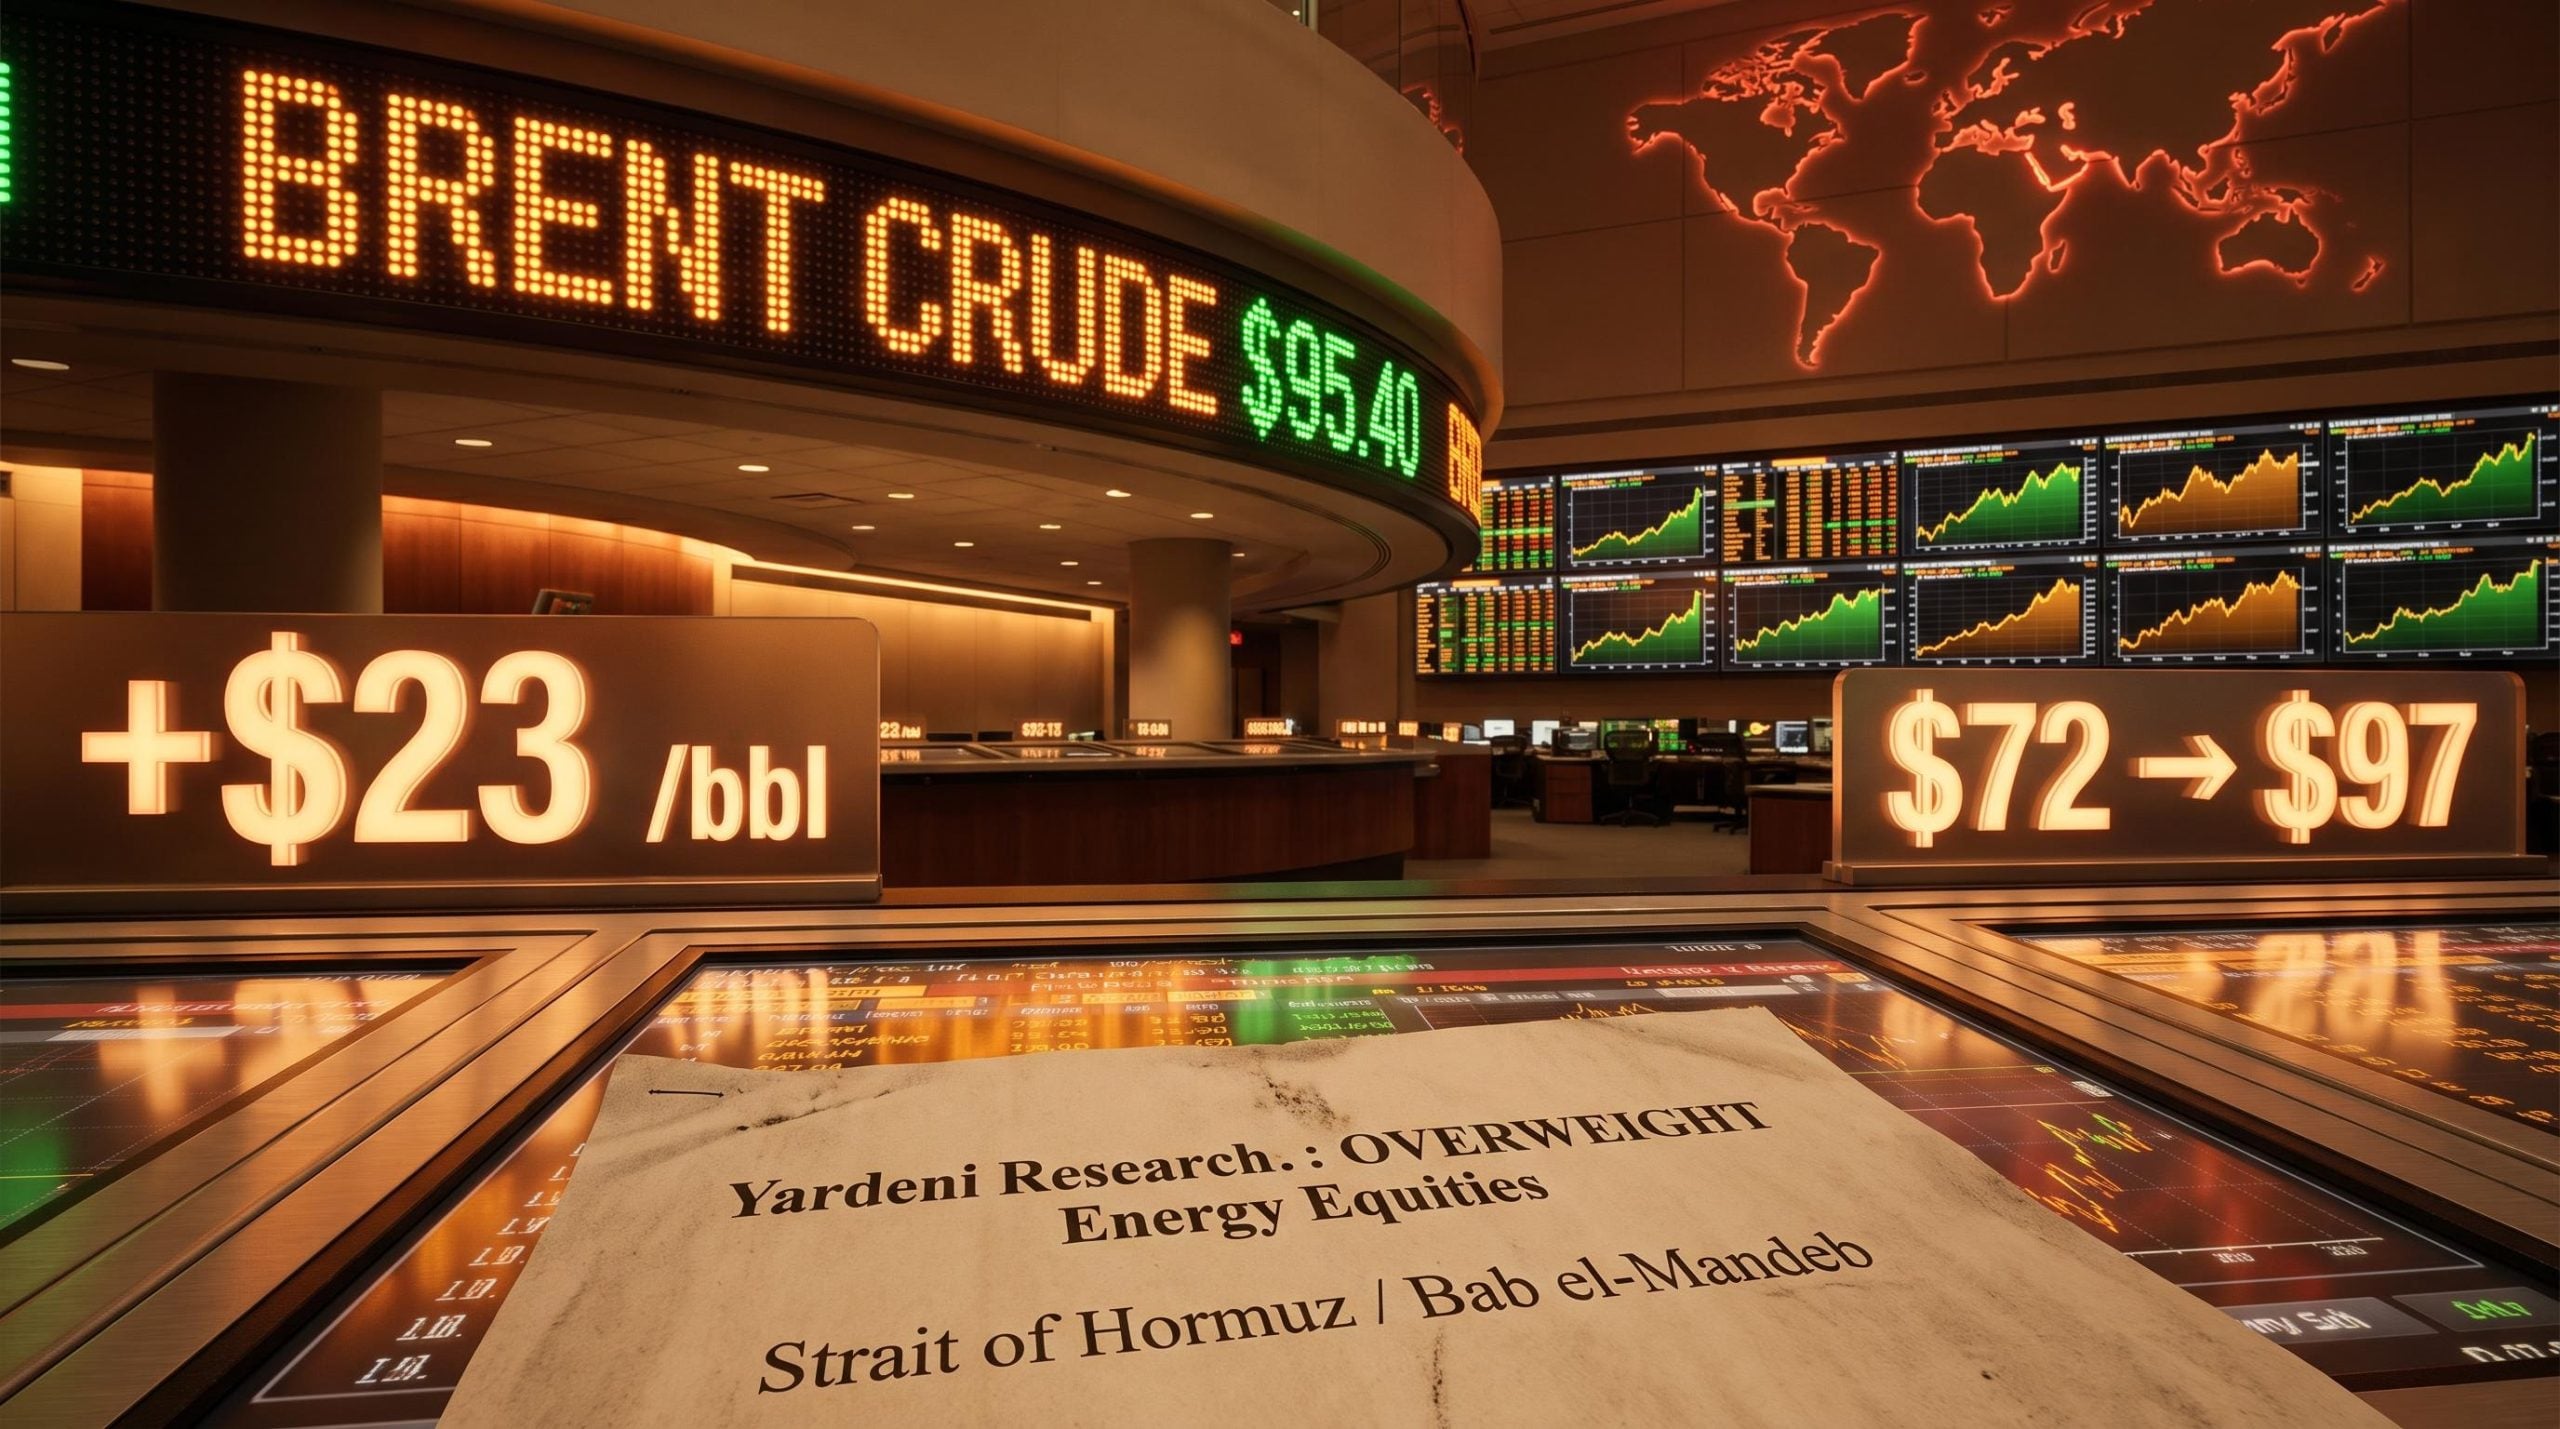
The FAO’s May 2026 Food Price Index release contained a phrase that should have commanded attention across every commodities desk globally: “effective closure of the Strait of Hormuz.” It did not receive the attention it warranted. Brent crude is trading near $92 per barrel as of 7 June 2026, and most market commentary remains anchored on the oil price itself. The more consequential story sits beneath it: a cascade of second- and third-order effects that has persisted long enough to reshape fertiliser supply chains, alter crop planting decisions across the northern hemisphere, and erode food security baselines in dozens of import-dependent economies. Most retail investors have not connected these threads. This analysis traces the full causal chain from the strait to the supermarket shelf, identifies the specific data points that signal how tight conditions have become, and explains what continued disruption would mean for multi-commodity inflation and portfolio positioning across energy, agriculture, and emerging market sovereign debt.
How a single strait is reshaping the global energy calculus
Under normal operating conditions, approximately 20 million barrels per day move through the Strait of Hormuz, representing roughly 20% of global maritime oil trade against a consumption baseline of approximately 105 million barrels per day. That throughput has not recovered. The FAO’s April 2026 Food Price Index commentary, released 8 May 2026, used the phrase “effective closure of the Strait of Hormuz,” the clearest multilateral benchmark confirming that normal tanker flows remained interrupted through at least April-May 2026.
FAO Food Price Index Commentary, April 2026: The “effective closure of the Strait of Hormuz” continued to disrupt fertiliser supply, driving up urea and phosphate prices, further undermining fertiliser affordability and increasing risks to future agricultural production.
The market’s response has been strikingly muted. Brent at $92 is elevated, but equities, credit spreads, and generalist portfolio positioning do not reflect levels consistent with a multi-month closure of a chokepoint carrying one-fifth of global seaborne oil. Two cognitive mechanisms explain the gap: recency bias (prior Gulf crises resolved before supply chains broke) and the dominance of AI and technology narratives that have absorbed allocator attention. Iran’s asymmetric warfare capabilities, including advanced drones, missile systems, and sea mines, make carrier-based naval reassertion more costly and uncertain than in any prior Gulf confrontation. This is not the same risk profile.
The near-total withdrawal of commercial war-risk insurance is a structural mechanism that keeps the Hormuz risk premium elevated even when physical passage is technically possible, because insurers price the threat of future closure into every policy renewal, meaning a ceasefire announcement does not automatically translate into resumed commercial tanker flows.
Three bypass options remain under active discussion, and none is sufficient:
The EIA analysis of world oil transit chokepoints establishes that Hormuz flows averaged 20.9 million barrels per day in the first half of 2025, representing approximately one-quarter of total global maritime traded oil, and documents the structural capacity limits of bypass pipelines that make alternative routing a partial measure rather than a genuine substitute.
- Saudi Petroline (East-West Pipeline) to the Red Sea: Already in use; incremental capacity limited
- UAE pipeline infrastructure: Operational but cannot substitute for full strait throughput
- Maritime rerouting around the Cape of Good Hope: Adds weeks of transit time, compressing available tanker capacity and elevating freight costs
When big ASX news breaks, our subscribers know first
Inventory levels that flatter to deceive
The surface numbers suggest buffers remain in place. The US Strategic Petroleum Reserve (SPR) stood at 392.6 million barrels as of the week ending 29 May 2026, according to the EIA’s Weekly Petroleum Status Report published 5 June 2026. That figure, however, follows the large 2022-23 drawdowns, and the question of whether released volumes were retained domestically or exported remains analytically relevant.
China presents a deeper information gap. Beijing holds the world’s largest strategic petroleum reserve, estimated at over 1.3-1.4 billion barrels entering the current conflict period, but does not disclose drawdown activity. Reduced Chinese crude import volumes suggest active drawdown rather than open-market purchasing. The scale of China’s reserve consumption is, at present, structurally unknowable.
Emergency reserve releases totalling approximately 280 million barrels from the SPR and IEA combined have failed to halt the inventory drawdown, with JPMorgan estimating usable global buffer at only around 800 million barrels and Saudi Arabia’s crude output having contracted to its lowest level since 1990, confirming that strategic reserve policy is buying time rather than resolving the underlying supply gap.
The refined product gap that crude reserves cannot fix
Crude reserves and refined product inventories are not interchangeable buffers. Diesel, jet fuel, and gasoline are produced through refining processes that depend on refinery throughput capacity; a crude release does not translate into immediate diesel availability.
The IEA’s Oil Market Report for May 2026 (released 15 May 2026) confirmed that OECD industry stocks of oil products remain below their 2019-23 five-year average in all major regions, with diesel inventories particularly tight. EIA data through the week ending 29 May 2026 shows US distillate fuel oil inventories below the five-year seasonal average, especially on the East Coast, where industrial and agricultural logistics demand is concentrated. S&P Global Commodity Insights described diesel and jet fuel crack spreads in Europe and Asia as “elevated by historical standards” in early June 2026.
| Indicator | Current level | Benchmark | Status |
|---|---|---|---|
| US SPR | 392.6 million barrels | Post-2022 drawdown baseline | Stable but historically depleted |
| OECD product stocks | Below average (all major regions) | 2019-23 five-year average | Deficit across regions |
| US distillate inventories | Below seasonal average (East Coast) | 2019-23 five-year seasonal range | Tight; logistics-critical |
| Middle distillate crack spreads | Elevated (Europe and Asia) | Historical norms | Widening; physical tightness signal |
Crack spread data provides a more honest signal of physical tightness than crude headline prices alone.
How the strait became a fertiliser problem
The connection between an oil chokepoint and a farmer’s nitrogen application rate runs through a single industrial process. Nitrogen-based fertilisers, which underpin the caloric output of modern agriculture, are synthesised from natural gas via the Haber-Bosch process. When energy supply is disrupted, fertiliser production is constrained, and urea and phosphate prices rise. The Hormuz closure is doing precisely this.
IFPRI research on natural gas and fertiliser affordability found that natural gas accounts for 70-80% of ammonia production costs, meaning the Haber-Bosch process creates a near-direct transmission channel from energy price shocks to nitrogen fertiliser costs, and that sustained gas price increases in Europe and Asia have repeatedly translated into reduced fertiliser access for farmers in lower-income economies.
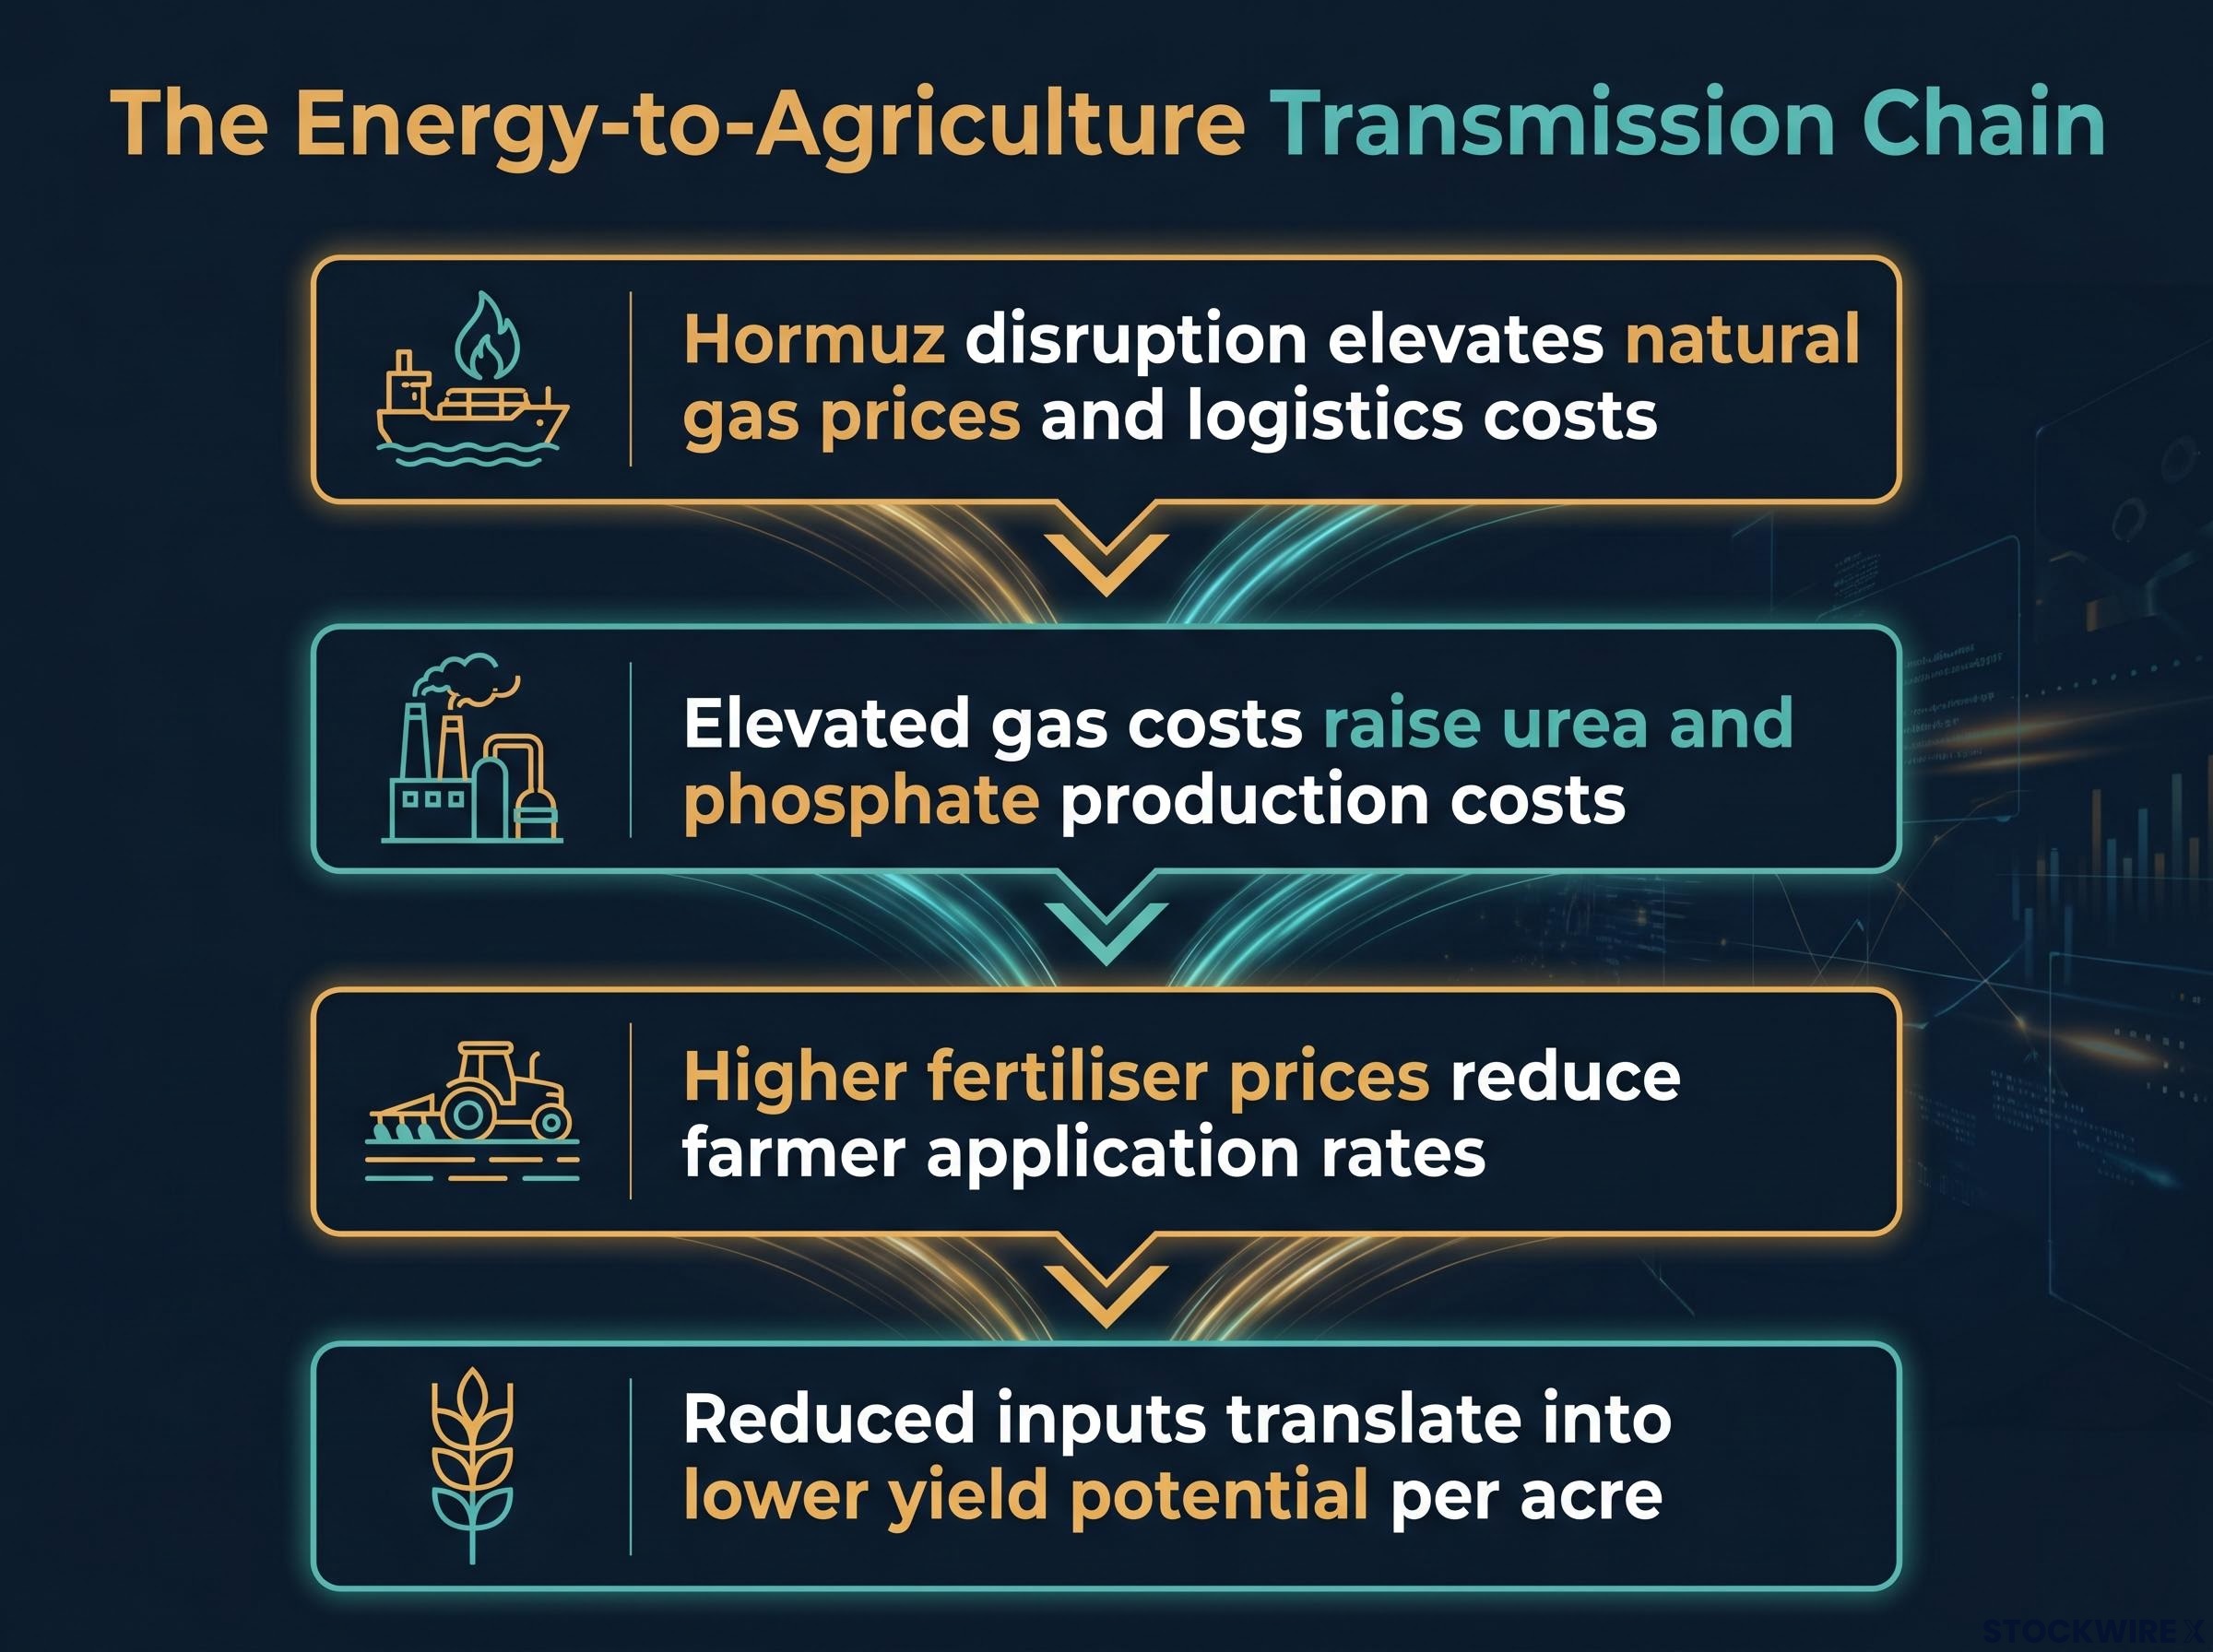
The transmission chain operates in four steps:
- Hormuz disruption elevates natural gas prices and logistics costs
- Elevated gas costs raise urea and phosphate production costs
- Higher fertiliser prices reduce farmer application rates
- Reduced inputs translate into lower yield potential per acre
The FAO’s April 2026 commentary stated this explicitly, linking the effective closure to “disrupted fertilizer supply, driving up urea and phosphate prices, further undermining fertilizer affordability and increasing risks to future agricultural production.” The World Bank’s Commodity Markets Outlook for April 2026 found that global fertiliser prices, while below their 2022 peaks, remain significantly above pre-COVID averages, with nitrogenous fertiliser prices supported by elevated natural gas costs and logistics disruptions.
FAO, April 2026: The effective closure “continued to disrupt fertilizer supply, driving up urea and phosphate prices, further undermining fertilizer affordability and increasing risks to future agricultural production.”
Agricultural commodity investors and food sector equity analysts typically model energy and fertiliser costs as separate inputs. The Hormuz disruption collapses that separation: a single geopolitical event is simultaneously driving both cost lines upward.
What farmers are actually planting in 2026 and why it matters
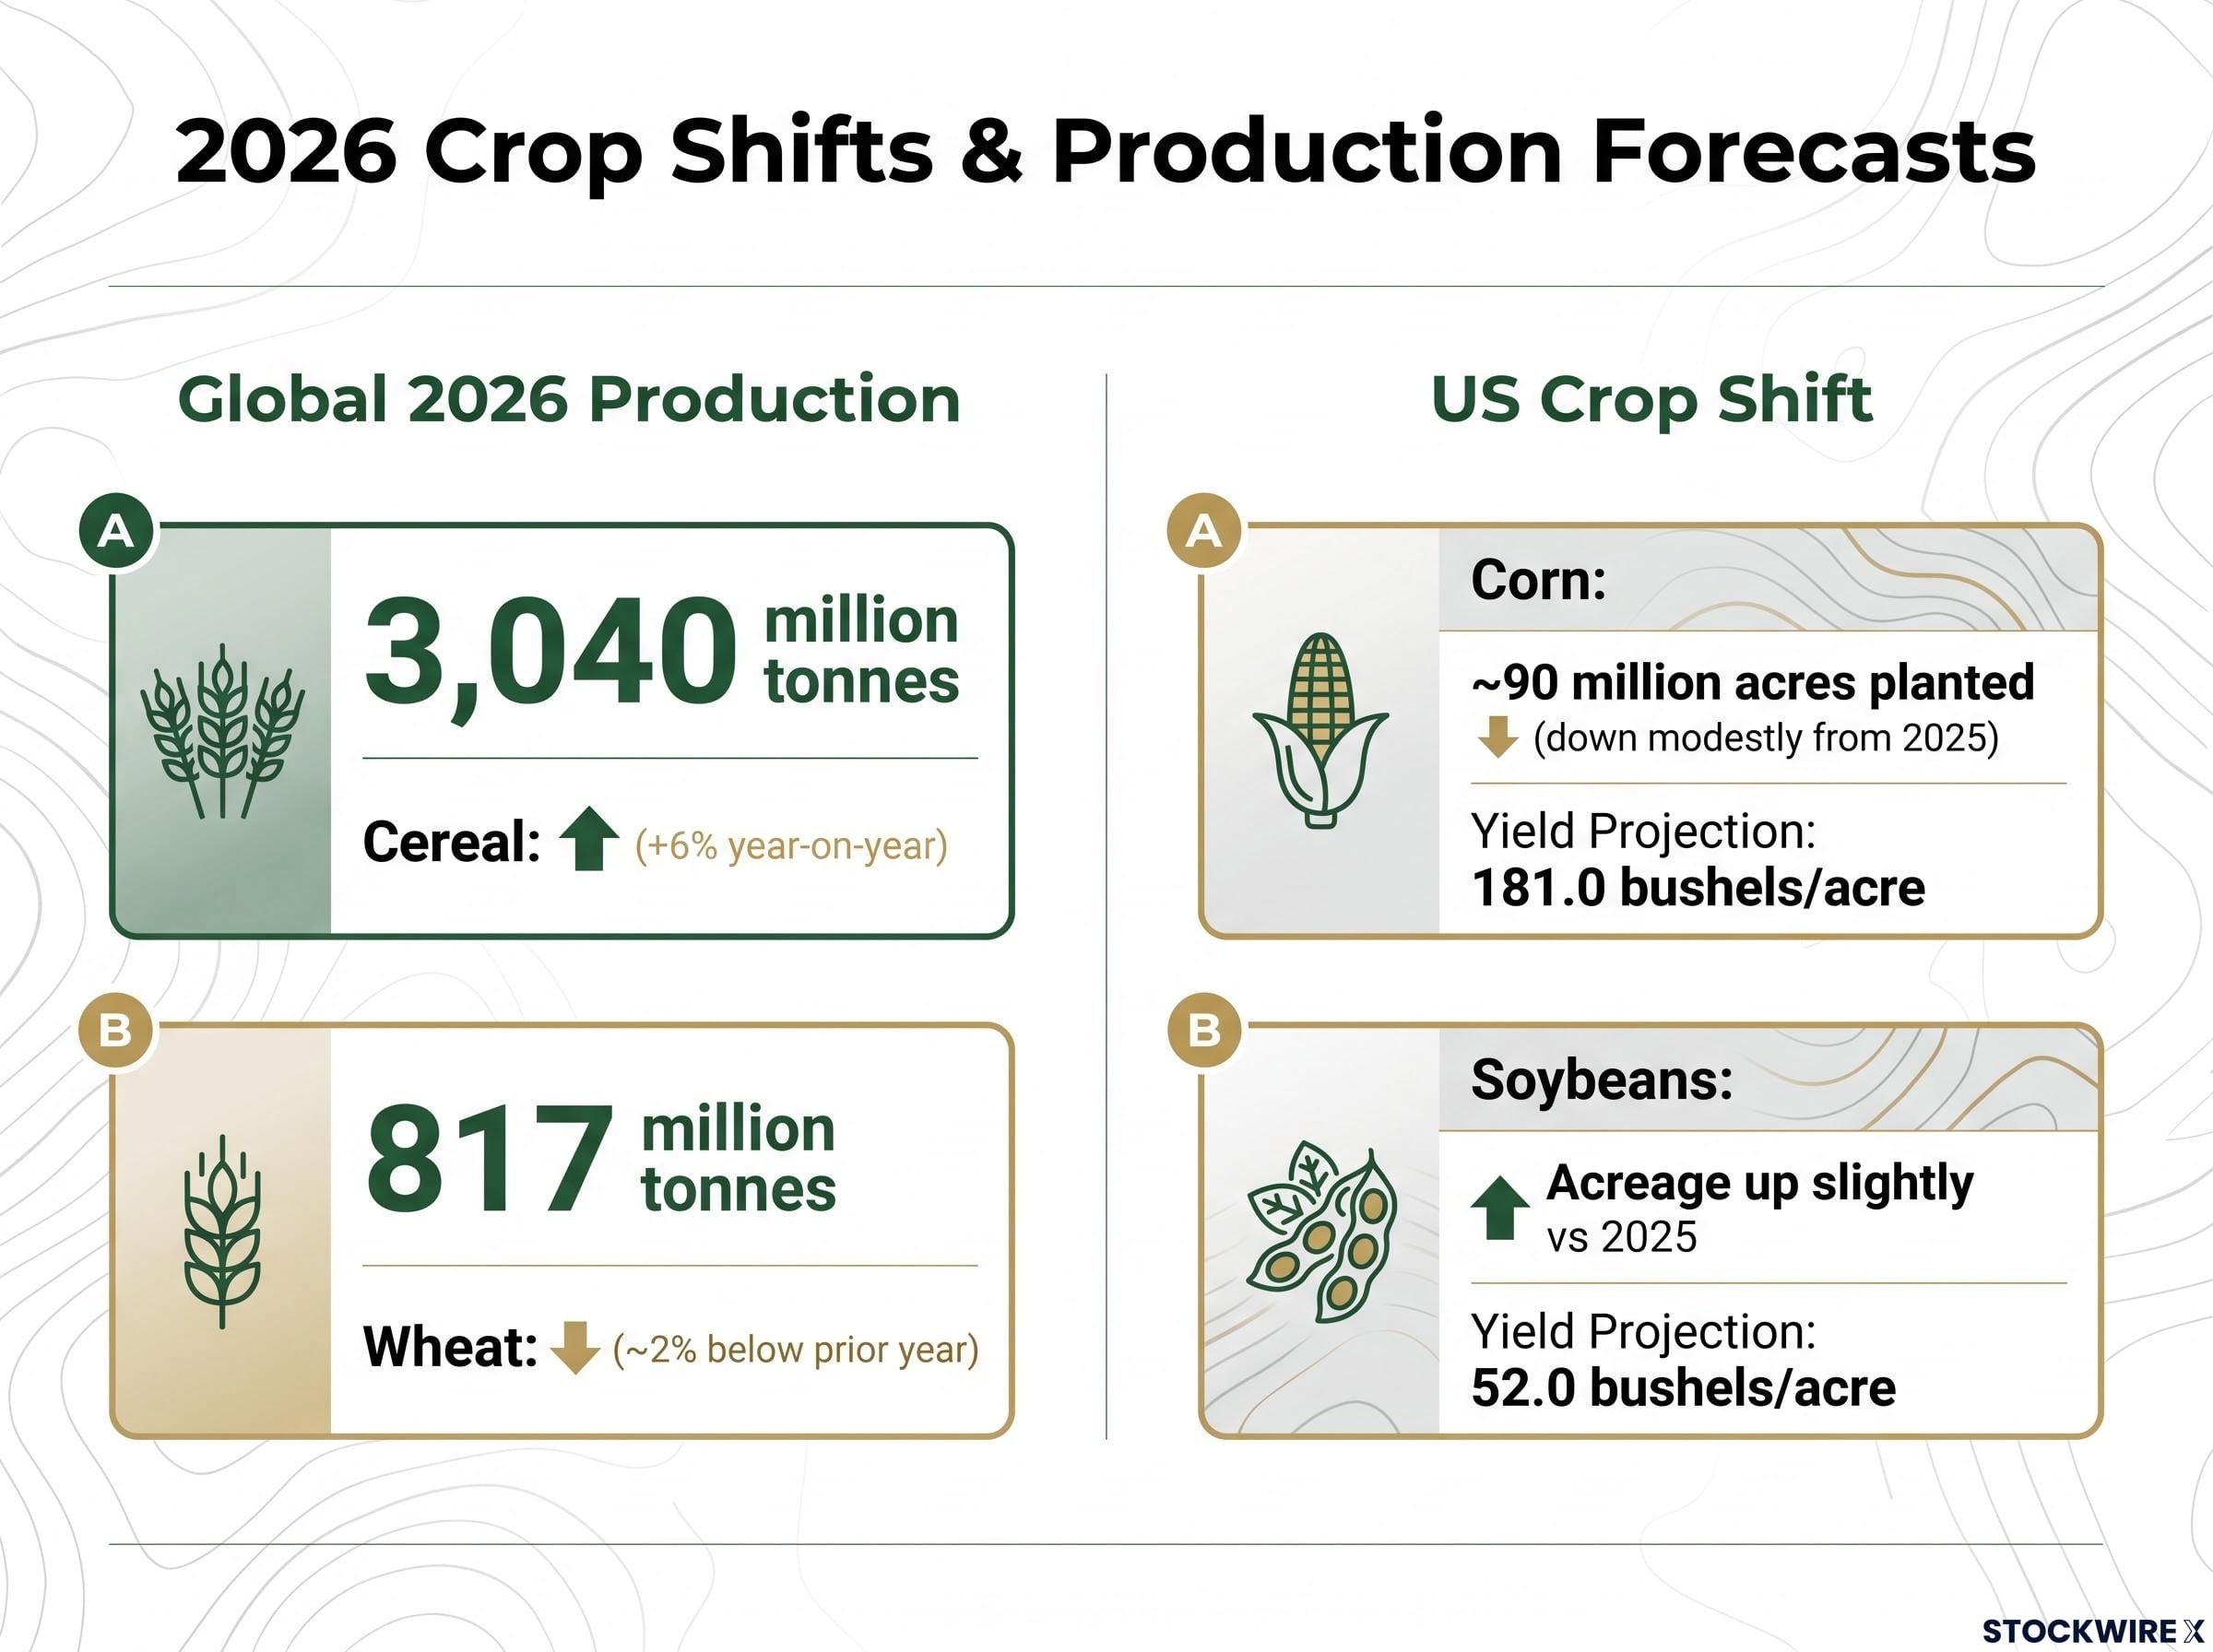
The transmission from energy disruption to fertiliser costs to planting decisions is not hypothetical. It is already visible in acreage data. US farmers are shifting planted area from corn (nitrogen-intensive) toward soybeans (less input-intensive), with wheat planted area also projected slightly lower. The FAO explicitly linked reduced 2026 wheat plantings to “farmers shifting to less fertilizer-intensive crops amid high fertilizer prices” driven by the Hormuz closure.
Global cereal production is forecast at 3,040 million tonnes, up 6% year-on-year according to FAO data from April 2026. World wheat production for 2026 was revised to 817 million tonnes, approximately 2% below the prior year. The aggregate figures mask the composition shift: calorie-dense, fertiliser-intensive crops are losing acreage to less demanding alternatives.
| Crop | 2026 planting intention or forecast | Prior year comparison | Key risk factor |
|---|---|---|---|
| Corn | ~90 million acres (US)* | Down modestly from 2025 | Nitrogen input under-application |
| Soybeans | Up slightly vs 2025 (US)* | Acreage gain from corn rotation | Potential oversupply pressure |
| Wheat | 817 million tonnes (global) | ~2% below prior year | Fertiliser-driven acreage reduction |
*USDA Prospective Plantings and WASDE estimates; not independently confirmed at time of publication.
The USDA WASDE report of 10 May 2026 projects US corn yield at 181.0 bushels per acre and soybean yield at 52.0 bushels per acre, both trend-based. Those projections embed a consequential assumption: adequate fertiliser application. If input under-application proves widespread, actual yields could fall materially below the WASDE baseline, triggering a repricing of grain futures that markets are not currently expecting.
Three compounding risk factors converge on 2026 yields:
- Input under-application: Elevated fertiliser costs reduce per-acre nutrient rates
- El Niño weather risk: A historically significant event is anticipated to produce hotter, drier conditions across major US growing regions
- Acreage substitution: Shift away from calorie-dense crops toward less input-intensive alternatives
The full crop impact will not be legible to markets until the autumn harvest season.
Food price inflation and the geographies most at risk
The FAO Food Price Index (FFPI) reached 131.0 points in April 2026, its highest reading since January 2023, before easing marginally to 130.8 in May 2026. April’s increase was driven partly by vegetable oil prices linked to elevated energy costs and biofuel demand.
The investment thesis and the humanitarian crisis are, in this instance, the same data set. In wealthy democracies, the impact is electoral: food price inflation punishes incumbent governments. In lower-income, import-dependent nations, the risk extends to protests, unsustainable subsidy expansion, and governmental instability.
The key exposed country categories include:
- North African wheat importers facing elevated import bills and subsidy strain
- Sub-Saharan net food and fuel importers where food represents a large share of household expenditure
- Middle Eastern economies carrying high subsidy burdens that may not be fiscally sustainable
IMF World Economic Outlook, April 2026: “Persistent food and energy price pressures could exacerbate social tensions and political instability” in vulnerable economies.
The World Bank’s Commodity Markets Outlook for April 2026 projected food commodity prices to remain above pre-pandemic averages and explicitly linked combined energy-food shocks to heightened social unrest risk. The FAO/WFP Global Report on Food Crises 2026 identified dozens of countries facing acute food insecurity, with high fuel and transport costs among the contributing factors. Reuters reporting from May 2026 noted North African and Sub-Saharan governments expanding subsidy programmes that may not prove fiscally sustainable.
Sovereign debt markets in net-importing emerging economies are not currently pricing a sustained multi-commodity shock. Investors holding emerging market credit or currency exposure in food-and-fuel-import-dependent countries face a tail risk that is directly traceable to the Hormuz disruption but is not visible in the standard energy-only framing.
The tanker biofouling problem and the delayed reopening scenario
Even a diplomatic breakthrough would not mean a return to normal flows within days or weeks. Hundreds to thousands of tankers sitting idle in Persian Gulf waters at approximately 32-33 degrees Celsius have accumulated barnacle and sea-chest fouling, a seldom-discussed logistical bottleneck that creates an asymmetric recovery curve.
The tanker return-to-service timeline involves sequential steps that cannot be compressed:
- Geopolitical resolution allowing strait transit
- Fleet safety inspections
- Biofouling assessment and triage of affected vessels
- Dry-docking or dive-crew remediation
- Sea trials and return to active routing
The disruption can persist indefinitely while the strait remains closed. The recovery, by contrast, would lag by weeks to months as the idled fleet cycles through remediation.
The supply normalisation timeline extends well beyond any diplomatic breakthrough, with Saudi Aramco’s CEO Amin Nasser warning that full recovery may not arrive until 2027 and tanker traffic through the strait having collapsed from approximately 130 ships per day to just 2 to 5, a volume contraction that the biofouling and fleet remediation backlog will prevent from reversing quickly even once the geopolitical trigger is removed.
Bypass pipelines: partial relief, not a substitute
Both the Saudi Petroline and UAE pipeline infrastructure were already in active use during earlier phases of the crisis, meaning their incremental contribution at this stage is limited. No 2026-dated publicly available source has documented a new major bypass pipeline coming online. Bypass capacity remains well below the normal strait throughput of approximately 20 million barrels per day.
Partial bypass capacity combined with a delayed tanker fleet re-mobilisation creates a supply recovery profile that is slower and shallower than the disruption onset, an asymmetry that most market models do not explicitly incorporate. Energy traders and equity investors positioned for rapid price normalisation on a geopolitical resolution should factor in the biofouling delay as a reason physical premiums and crack spreads would remain elevated longer than a simple “reopening” narrative would suggest.
Reading the multi-commodity chain before the repricing arrives
The causal chain is now traceable with precision: Hormuz disruption constrains energy supply, which thins reserve buffers, which elevates fertiliser production costs through the hydrocarbon-to-nitrogen dependency, which triggers crop-switching and input under-application, which generates yield risk that feeds into food price inflation and, ultimately, political and financial stability risk in import-dependent economies.
| Stage | Observable signal | Current reading | Deterioration signal |
|---|---|---|---|
| Energy supply | Brent crude price | ~$92/bbl (Bloomberg, 7 June 2026) | Sustained move above $100 |
| Reserve buffer | SPR levels, OECD product stocks | Below five-year averages | Accelerated drawdowns or emergency releases |
| Fertiliser costs | Urea and phosphate spot prices | Above pre-COVID averages | Further supply disruption or gas price spike |
| Crop yield outlook | USDA WASDE projections vs field reports | Trend-based (assumes adequate inputs) | Field data showing widespread under-application |
| Food price inflation | FAO Food Price Index | 130.8-131.0 (highest since Jan 2023) | Sustained rise above 135 |
The markets and instruments that would register further escalation before crude prices alone signal it are the more forward-looking indicators investors should monitor:
- Corn and wheat futures: Direct exposure to the yield-risk thesis
- Urea spot prices: The transmission link between energy and agriculture
- Middle-distillate crack spreads: The most honest signal of refined product tightness
- Emerging market sovereign spreads in net food-and-fuel-importing economies: The political stability channel
The autumn 2026 northern hemisphere harvest is the confirmation or de-risking window. If yields disappoint against the USDA trend-based baseline, the multi-commodity thesis moves from analytical to observable.
Six months that will settle the multi-commodity thesis
The strait disruption is already a multi-commodity event, not a prospective one. FAO data, IEA inventory data, and World Bank fertiliser pricing data collectively confirm that the transmission into food systems has begun. The question is whether the next six months confirm a full yield miss or deliver a harvest adequate enough to partially offset the supply-chain pressure.
Three scenarios frame the observation window:
- Resolution path: Diplomatic breakthrough plus adequate harvest; physical supply recovery still delayed by biofouling, but market sentiment improves. This is approximately what current prices already reflect.
- Stasis path: Continued Hormuz disruption with a middling harvest; food prices grind higher, emerging market fiscal strain intensifies, and crack spreads remain elevated. Markets begin repricing gradually.
- Escalation path: Continued disruption, El Niño crop damage, and sustained fertiliser under-application converge; grain futures spike, food inflation accelerates in import-dependent economies, and the multi-commodity shock becomes headline news. This scenario is not priced.
The asymmetry is clear. The downside scenario carries consequences across energy, agricultural, and sovereign debt markets simultaneously. The upside scenario, a resolution followed by a slow physical recovery, is largely what current market prices already embed.
For readers wanting to understand why financial markets have absorbed the commodity shock without a proportionate equity sell-off, our deep-dive into the equity market response to commodity shocks examines the M4 money supply data, core CPI stripping methodology, and Fed funds futures pricing that together explain why the S&P 500 held near 7,425 even as headline CPI hit a three-year high of 3.8%.
The reader who began this analysis watching oil prices as the primary signal should now recognise that crop futures, fertiliser affordability indices, and emerging market sovereign spreads in food-import-dependent countries are the more forward-looking indicators of how this crisis propagates. The time to build that analytical framework is before the autumn harvest data arrives, not after.
This article is for informational purposes only and should not be considered financial advice. Investors should conduct their own research and consult with financial professionals before making investment decisions. Past performance does not guarantee future results. Financial projections referenced in this analysis are subject to market conditions and various risk factors.