U.S. households hold approximately $75 trillion in equities, a figure equivalent to roughly 230% of GDP, while the personal saving rate has collapsed to 2.6%. A proprietary model from BCA Research is now flashing a signal that has preceded every major bear market of the past 25 years. In the firm’s June 2026 MacroQuant report, strategist Peter Berezin published a composite equity valuation z-score of -0.69, closing in on the -1 threshold that marked the onset of sustained equity declines in 2000, 2007, and 2021. The timing is worth scrutinising: households have never entered a potential downturn with this much equity exposure relative to the size of the economy, and with this little savings cushion to absorb a shock. What follows unpacks the MacroQuant signal, examines the three historical precedents in detail, and connects the household financial backdrop to the specific channels through which a bear market would damage the real economy.
The z-score signal that BCA Research says investors cannot ignore
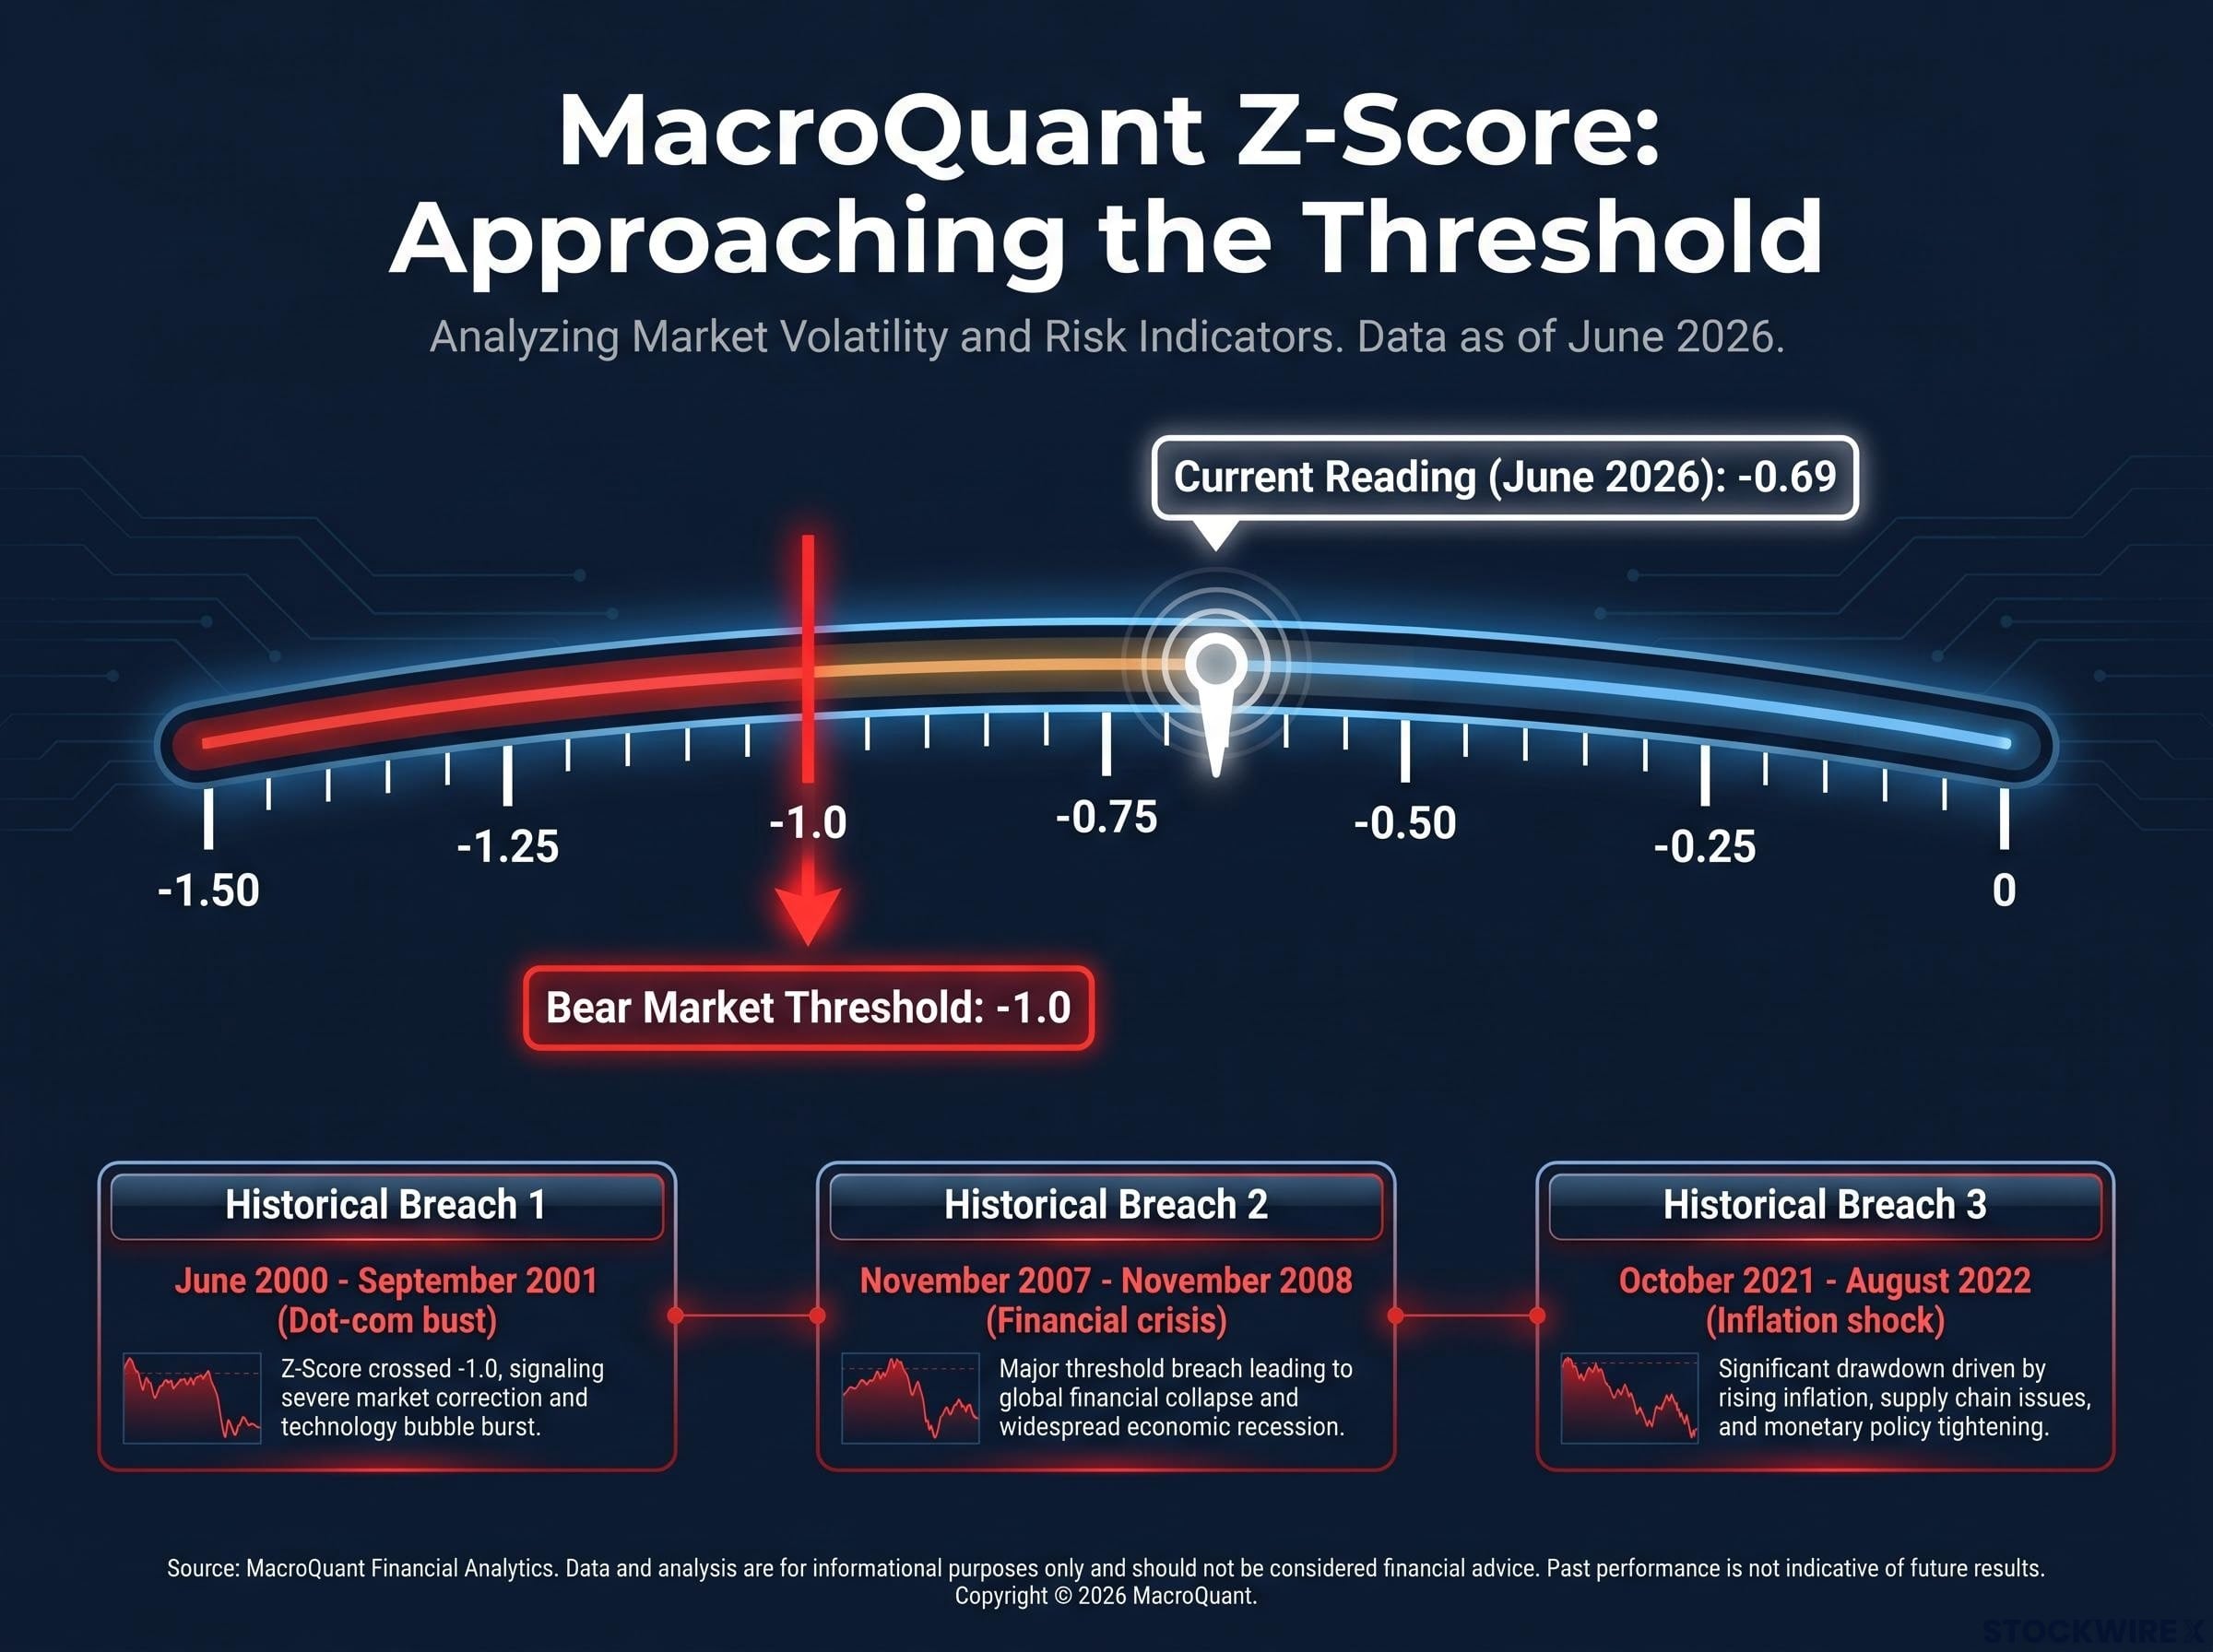
The number is -0.69. That is the current reading on BCA Research’s MacroQuant composite equity valuation z-score, as published by Peter Berezin in the firm’s June 2026 report. On its own, a z-score below zero registers as stretched. What gives this particular reading its weight is the threshold sitting just below it.
MacroQuant z-score: -0.69 (June 2026) Bear market threshold: -1.0 Every time the z-score has breached -1 in the model’s 25-year track record, a sustained equity bear market has followed.
The threshold has been breached ahead of all three major bear markets covered in the report:
- June 2000 to September 2001 (dot-com bust)
- November 2007 to November 2008 (housing and credit crisis)
- October 2021 to August 2022 (post-pandemic inflation shock and Federal Reserve tightening)
No exceptions. The distance between -0.69 and -1.0 is narrow enough to warrant attention, but the signal has not yet triggered. For investors evaluating portfolio risk, the MacroQuant reading is not a prediction of imminent collapse. It is a proximity alert, and one with a clean record.
The BCA MacroQuant model sits at the centre of the firm’s current market risk assessment, and it is doing more analytical work than the z-score alone conveys: in the same June 2026 report cycle, BCA’s Peter Berezin flags the Buffett Indicator at 223.6%, approximately 2.4 standard deviations above its long-run historical trend, reinforcing the valuation stretch the z-score is already measuring.
When big ASX news breaks, our subscribers know first
What happened the last three times this threshold broke
The pattern across the three precedents does not require interpretation. It repeats.
In June 2000, the z-score breached -1 as technology valuations reached their most extreme readings of the internet era. The catalyst arrived with slowing corporate earnings and the unwinding of speculative positioning. By September 2001, the S&P 500 had suffered a severe drawdown, compounded by the economic shock of the September 11 attacks.
In November 2007, the breach preceded the global financial crisis. Housing prices had already begun to decline, but equity markets had not yet absorbed the scale of credit exposure embedded in the banking system. Over the following 12 months through November 2008, the drawdown was the deepest of the three episodes.
By October 2021, the model registered the breach again, this time amid post-pandemic inflation running well above the Federal Reserve’s target. The Fed’s pivot to aggressive rate increases through 2022 compressed equity multiples. The drawdown ran through August 2022 before stabilising.
| Period | Start | End | Macro trigger |
|---|---|---|---|
| Dot-com bust | June 2000 | September 2001 | Tech earnings collapse, speculative unwind |
| Financial crisis | November 2007 | November 2008 | Housing decline, systemic credit exposure |
| Inflation shock | October 2021 | August 2022 | Surging inflation, Fed tightening cycle |
The common thread across all three: stretched valuations, followed by a catalyst that equity markets had not fully priced, followed by sustained declines. The differences matter too. A tech bubble, a banking crisis, and an inflation shock are distinct macro regimes, yet the model held through each. The signal is not regime-dependent. It measures the vulnerability. The catalyst varies.
Why household equity exposure has never looked like this before
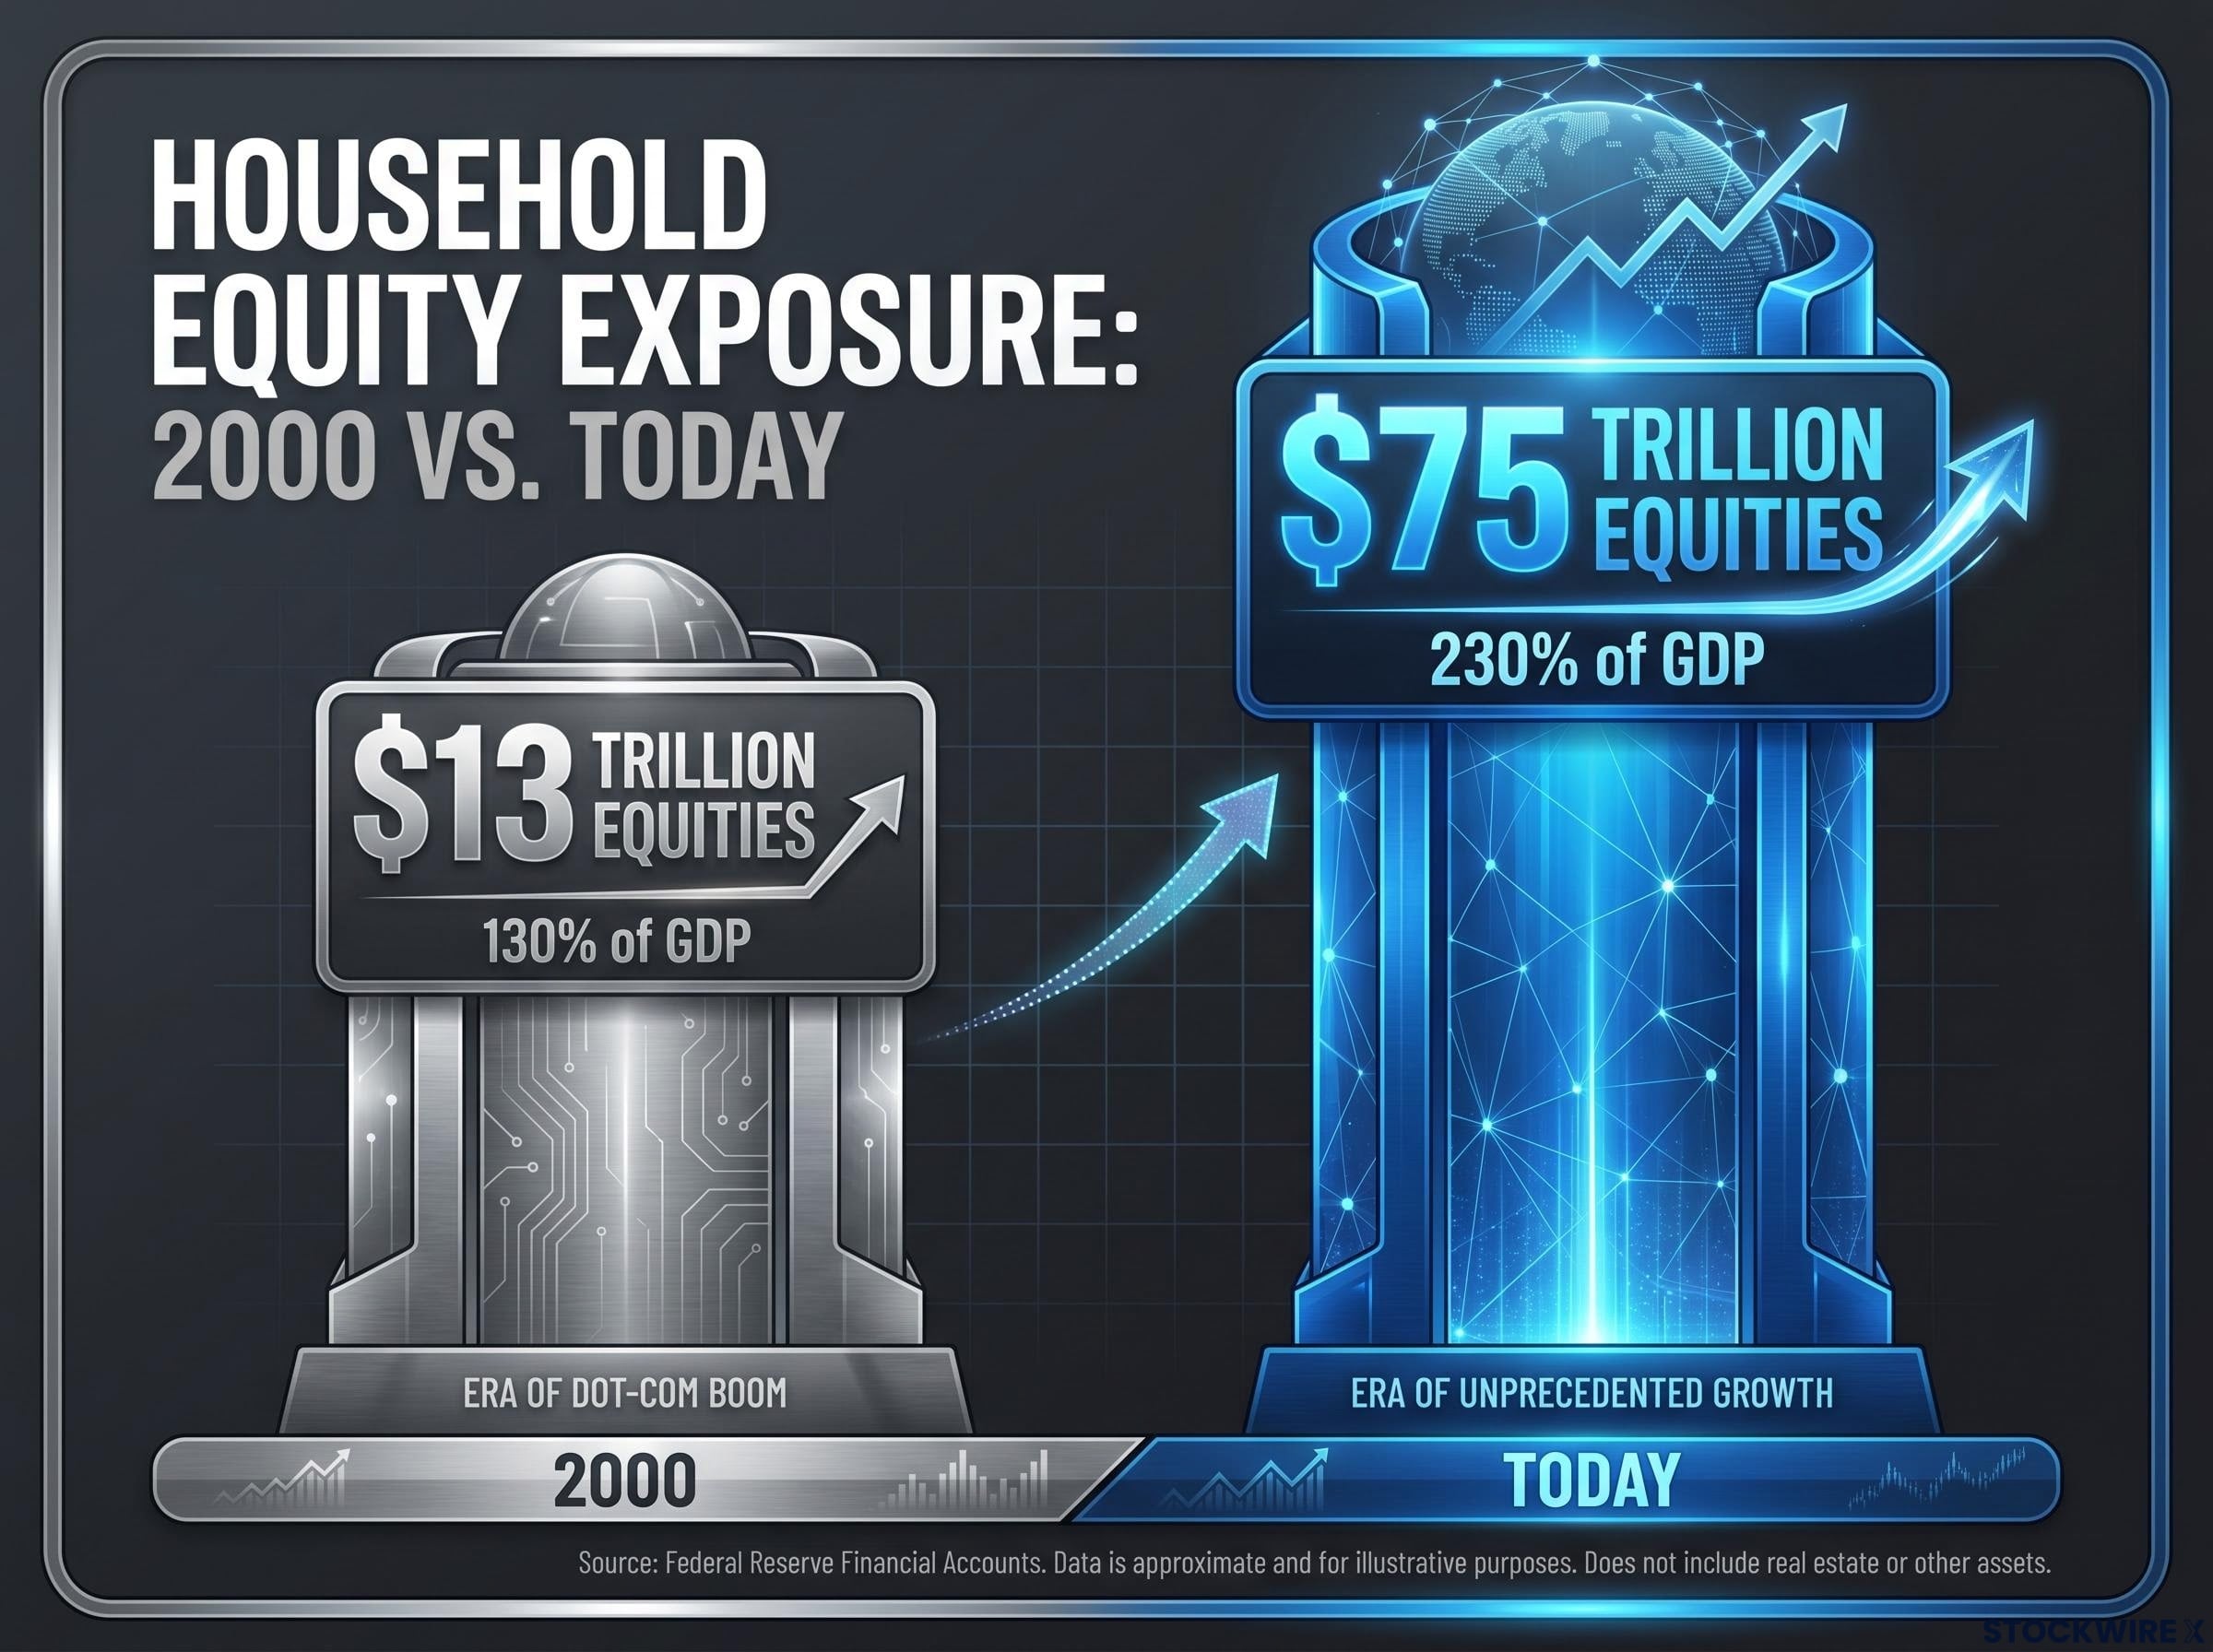
The $75 trillion figure deserves more than a passing reference. According to Federal Reserve data cited in the BCA Research report, U.S. households currently hold approximately $75 trillion in equities, equivalent to roughly 230% of GDP.
That is not a record by a small margin. It is a structural departure.
At the peak of the 2000 internet bubble, household equity holdings stood at approximately $13 trillion, or roughly 130% of GDP. Today’s figure is nearly six times larger in nominal terms and almost double as a share of the economy.
The mechanism connecting equity prices to the real economy is the wealth effect, and it operates in both directions:
- Rising equity portfolios suppress saving and support consumption, as households perceive themselves as wealthier
- Falling equity portfolios reverse the same dynamic, reducing perceived wealth and pulling back spending
- The larger the equity base relative to the economy, the harder this reversal hits when it arrives
At 130% of GDP in 2000, a bear market generated a significant wealth effect drag on consumption. At 230% of GDP, the same percentage decline in equities would destroy a proportionally larger share of household perceived wealth. The amplifier is not hypothetical. It is arithmetic.
The saving rate collapse that removes the household safety net
The personal saving rate stood at 2.6% in April 2026, according to Bureau of Economic Analysis (BEA) data released on 28 May 2026. The 2019 average was 7.3%.
The BEA personal income and outlays data for April 2026 confirms the 2.6% personal saving rate and the $104.0 billion monthly increase in personal consumption expenditures, providing the official baseline against which the household financial fragility described in the MacroQuant analysis is measured.
That gap, from 7.3% to 2.6%, represents the erosion of the household financial buffer that would ordinarily absorb a market shock. Real disposable personal income (DPI) was unchanged on a monthly basis in April 2026 and declined 1.1% over the prior 12 months, per BEA data cited in the BCA Research report. Personal consumption expenditures, meanwhile, increased by $104.0 billion in April, meaning households continued to spend even as real incomes stagnated.
| Metric | 2019 baseline | April 2026 |
|---|---|---|
| Personal saving rate | 7.3% | 2.6% |
| Real DPI (12-month change) | Positive growth | -1.1% |
| PCE monthly change | Moderate growth | +$104.0 billion |
The aggregate figure understates the fragility at the household level. Bureau of Labor Statistics Consumer Expenditure Survey data for 2024, cited in the BCA Research report, shows that the bottom half of earners by income carry negative saving rates.
The bottom half of U.S. earners by income are not saving at low rates. They are spending more than they earn. The aggregate 2.6% figure is held up entirely by higher-income households.
A 2.6% saving rate means most households have almost no financial buffer to absorb a shock. If equity prices fall and the wealth effect reverses, consumers cannot maintain spending from savings. This is the mechanism by which a market correction could become an economic contraction, not just an investment loss.
Consumer spending sustainability is the crux of the feedback loop risk: April 2026 retail data appears robust on the surface, but the divergence between strong aggregate spending figures and historically low consumer sentiment scores suggests the spending is being funded by savings drawdowns rather than income growth, a pattern that has historically resolved through an abrupt consumption correction rather than a gradual normalisation.
What the macro data does and does not rule out
The countervailing evidence is real and should be weighed at full value.
Real GDP grew at +1.6% annualised in Q1 2026, according to the BEA’s second estimate released on 28 May 2026. The unemployment rate stands at 4.3%, and nonfarm payrolls added 172,000 jobs in May 2026, per the Bureau of Labor Statistics. The MacroQuant z-score at -0.69 has not yet breached the -1 trigger, meaning the model has not issued a confirmed bear market signal.
Evidence that offsets near-term risk:
- GDP growth remains positive at 1.6% annualised, well above recessionary territory
- The labour market is adding jobs at a pace consistent with expansion
- The BCA model threshold has not been breached; the signal remains a warning, not a confirmation
What the offsetting data does not address:
Citi’s bear market checklist reached 10 out of 18 flags globally in June 2026, its highest reading since the 2008 financial crisis, with U.S. markets registering 11.5 flags; this is a separate and independently constructed framework from BCA’s z-score model, yet both instruments are signalling elevated vulnerability at the same moment.
- Labour market strength supports income, but it does not reduce household equity concentration at 230% of GDP
- Job growth does not rebuild a 2.6% saving rate or restore the buffers that existed at 7.3% in 2019
- Moderate GDP growth does not deflate stretched valuations; it can coexist with valuation compression
What a resilient labour market does not fix
The distinction matters for portfolio decisions. A strong jobs market is the single most significant buffer working in the market’s favour right now. It supports income, sustains consumption, and delays the feedback loop between falling equity prices and economic contraction. But it does not address the structural vulnerabilities the MacroQuant model is measuring. A labour market can be resilient at the same moment equity valuations are stretched and household financial cushions are depleted. In two of the three prior precedents, employment conditions were not yet deteriorating at the time the z-score breached -1.
The configuration investors are actually navigating right now
Four threads run through this analysis. Taken individually, each represents an elevated but manageable risk factor. Taken together, they form a compound configuration that is historically unusual.
The MacroQuant z-score sits at -0.69, within striking distance of the -1 threshold that has preceded every bear market in the model’s track record. Household equity exposure at 230% of GDP is nearly double the ratio seen at the 2000 bubble peak. The personal saving rate at 2.6% is roughly a third of its 2019 level of 7.3%. Real disposable income has declined 1.1% over the past 12 months.
The feedback loop: Equity declines reduce perceived household wealth. Low savings mean households cannot absorb the income-equivalent shock. Consumption falls. GDP weakens. Corporate earnings disappoint. Valuations compress further, restarting the cycle.
The three indicators that would signal whether this configuration is worsening or stabilising:
- Z-score movement: Any drift toward -1.0 would bring the MacroQuant model to the threshold that has, without exception, preceded sustained bear markets
- Labour market deterioration: The jobs market is the single largest buffer preventing the feedback loop from activating; a meaningful rise in unemployment or a string of weak payroll prints would remove it
- Saving rate trajectory: A saving rate that continues to fall from 2.6% would indicate households are further eroding the cushion that would absorb a downturn
This is not a prediction. It is a monitoring framework built on the specific data points that separate a stretched environment from an actively deteriorating one.
A signal worth watching, not dismissing
The MacroQuant model is approaching its historically reliable bear market threshold, and the household financial conditions surrounding that signal are structurally more fragile than at any comparable moment in the data. Equity exposure at 230% of GDP, a saving rate at 2.6%, and declining real incomes create a configuration where any drawdown would transmit into the real economy through channels that are wider and less cushioned than in 2000, 2007, or 2021.
The signal has not yet triggered. The labour market remains intact. GDP growth is positive. The data warrants heightened vigilance, not panic-driven repositioning. Investors weighing current risk exposure would benefit from tracking the three indicators outlined above: the z-score’s movement toward -1, any deterioration in employment conditions, and the direction of the saving rate. The distance between where conditions stand today and where they stood at the onset of prior bear markets is measurable. It is also narrowing.
For investors who have weighed the monitoring framework above and are considering whether to adjust portfolio risk, our dedicated guide to crash protection strategies examines the measurable cost of conventional defensive allocations, including how the 60/40 portfolio trailed the S&P 500 by 14 percentage points in 2024, and what Goldman Sachs and Vanguard recommend as a middle path between full equity exposure and defensive repositioning.
This article is for informational purposes only and should not be considered financial advice. Investors should conduct their own research and consult with financial professionals before making investment decisions. Past performance does not guarantee future results. Financial projections are subject to market conditions and various risk factors.