
How Australian Investors Can Position for De-Dollarisation
13 hrs ago
The US government is spending roughly US$3 billion per day just to service the interest on its debt. Not to build roads, fund healthcare, or pay public servants. Just to cover the interest bill on money already borrowed. With gross federal debt at approximately US$39.2 trillion and annual interest obligations approaching US$1.2 trillion, the US debt situation has crossed from a long-term fiscal concern into an immediate, market-moving reality. The April 2025 tariff episode, in which a sitting president reversed major trade policy within seven days partly because bond markets started buckling, demonstrated that this is no longer an abstract problem. This article explains what the US debt spiral actually is, how bond yields function as its real-time stress gauge, what prominent macro investors and economists are saying about the trajectory, and precisely why Australian investors and retirees need to watch the 10-year Treasury yield as closely as they watch the ASX.
The scale is difficult to process in the abstract, so start with one number.
US$3 billion. That is the approximate daily interest cost on US federal debt, derived from annualised interest obligations approaching US$1.2 trillion in fiscal year 2026, according to Congressional Budget Office projections.
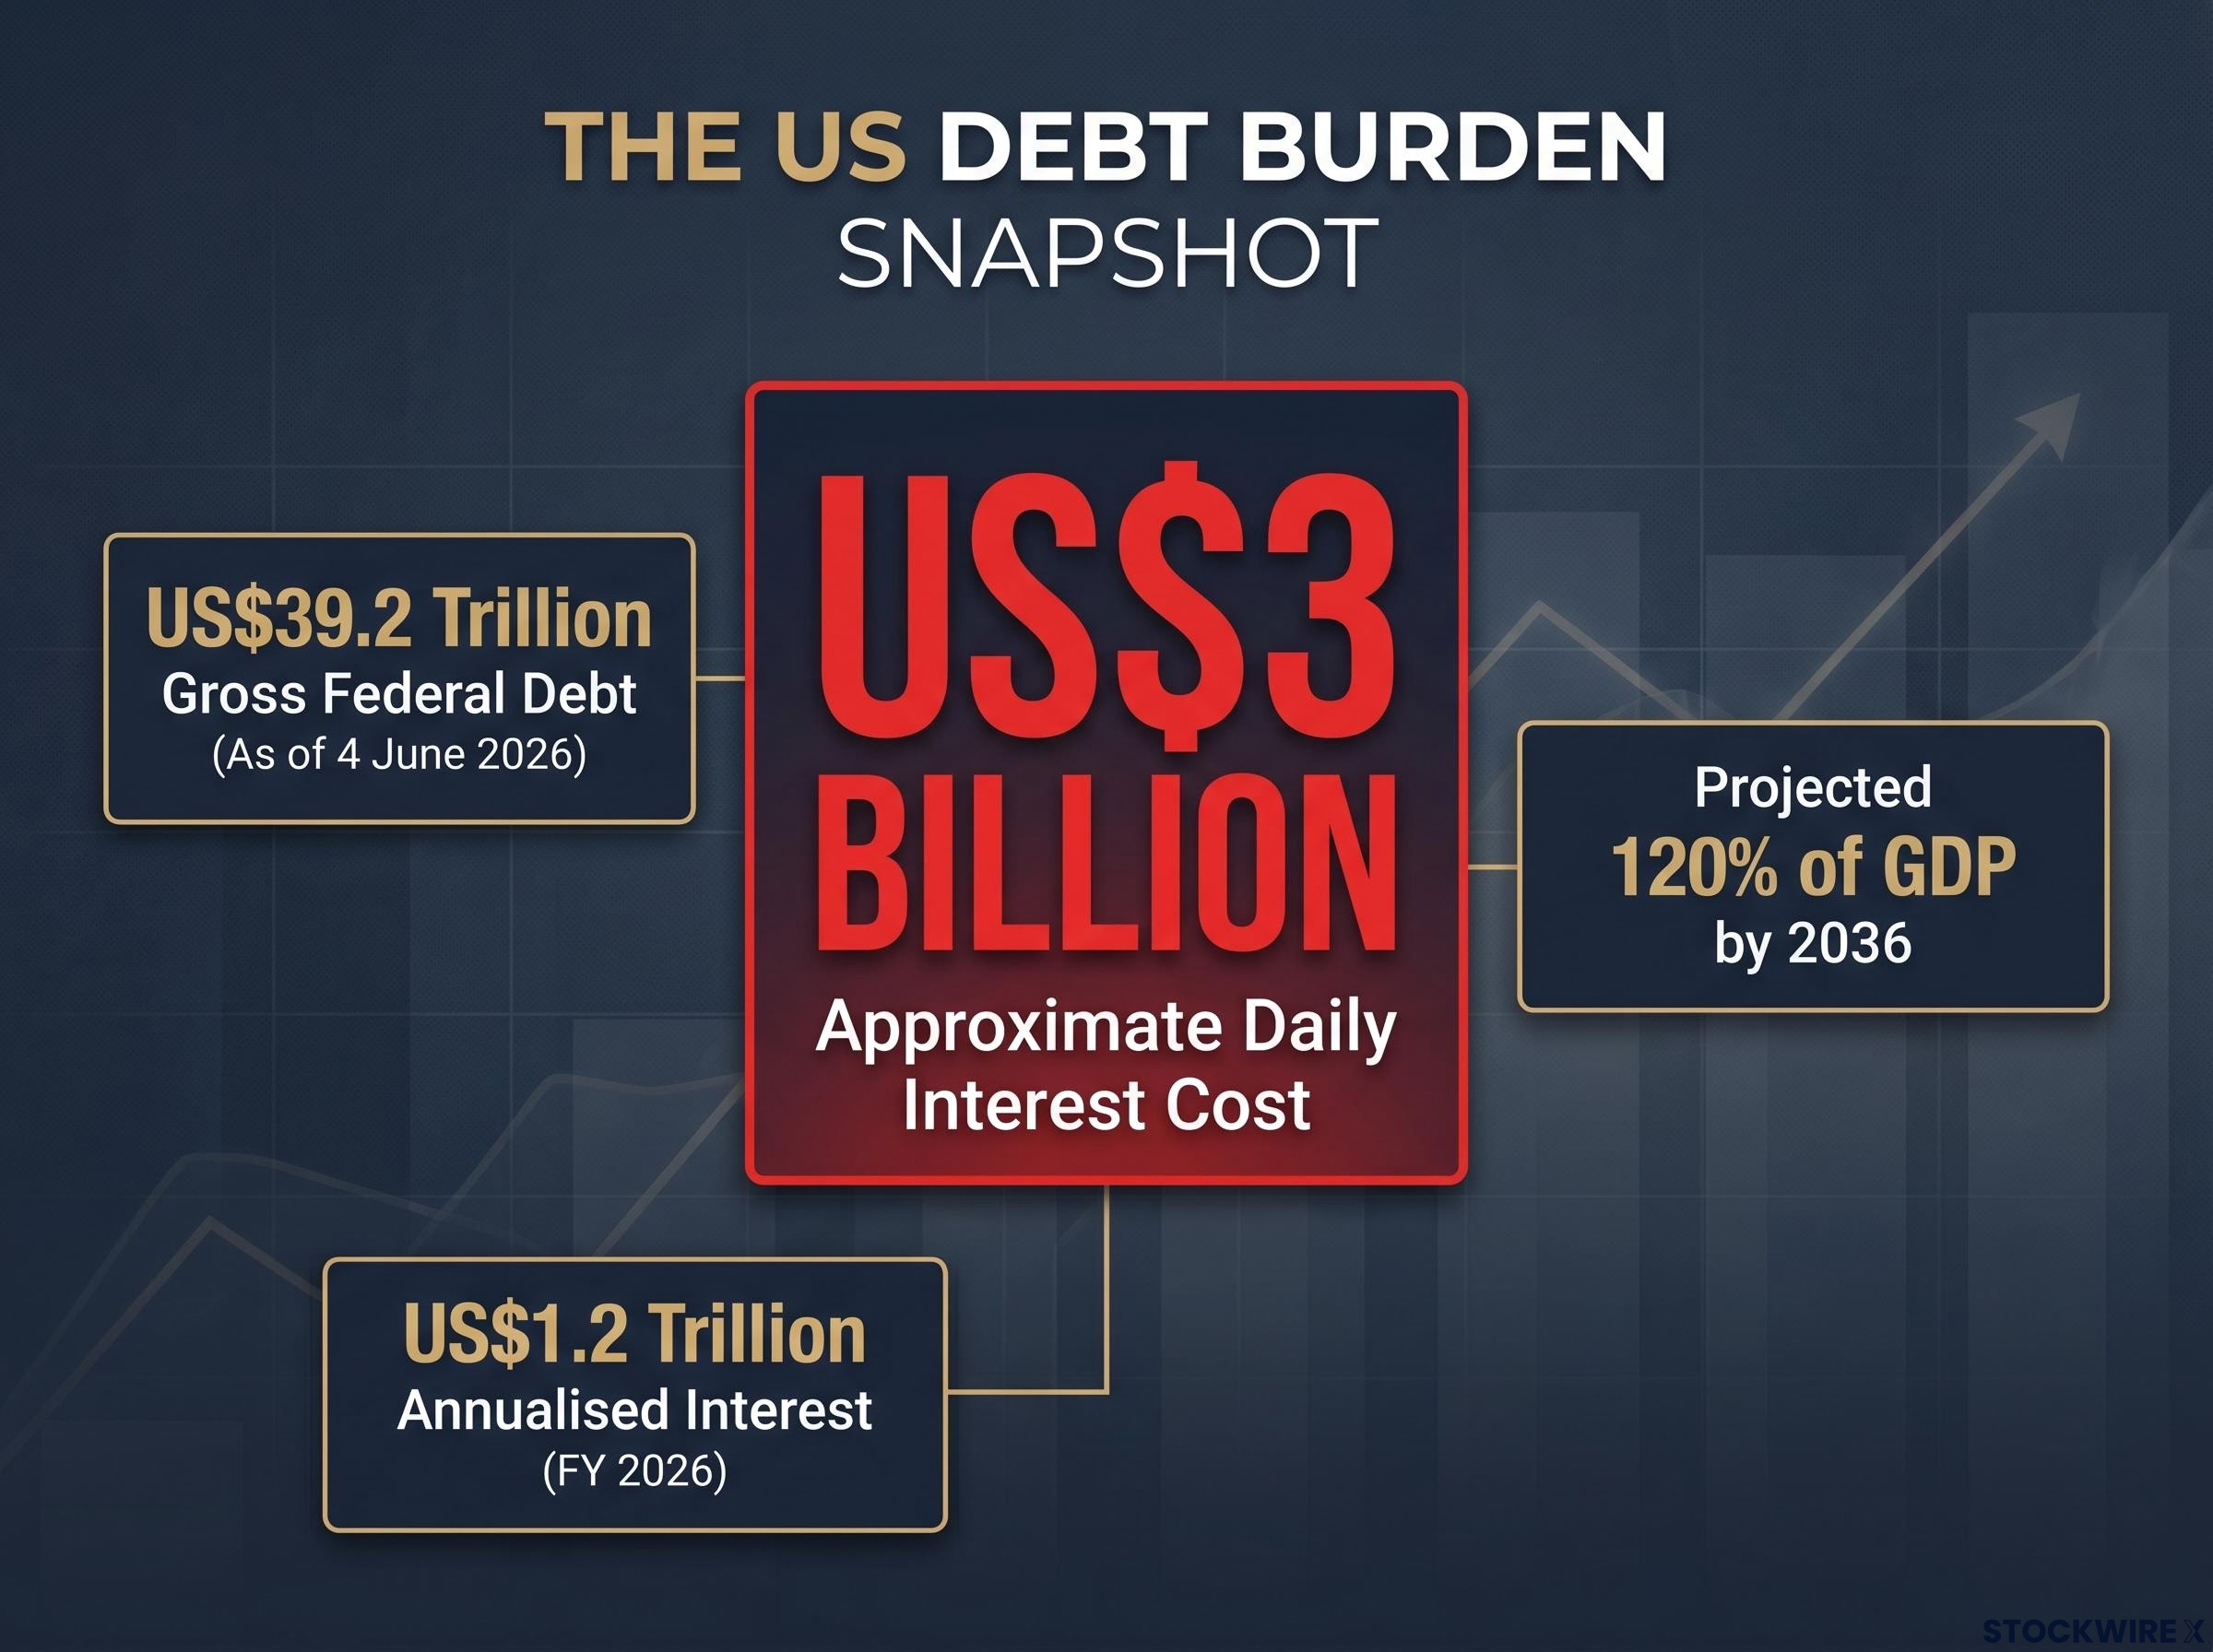
Total gross federal debt stood at approximately US$39.2 trillion as of 4 June 2026, per US Treasury “Debt to the Penny” data. The CBO’s February 2026 baseline projects federal debt held by the public rising toward 120% of GDP by 2036 under current law.
The debt-to-GDP threshold of 100% has attracted significant attention since the US crossed it in early 2026, but international precedents from the UK and Japan suggest this level alone does not mechanically produce fiscal stress; the trajectory and the composition of who holds the debt matter far more than the ratio itself.
These figures matter less as a snapshot than as a trajectory. The dynamic is self-reinforcing: higher deficits require more bond issuance, which pressures yields higher, which raises future interest costs, which widens deficits further. Each cycle of borrowing makes the next cycle more expensive.
All three major credit rating agencies have flagged the trajectory. Fitch downgraded the US from AAA to AA+ in August 2023. Moody’s shifted its outlook to negative in November 2023 and reaffirmed that assessment in March 2026, noting that “US debt affordability has weakened materially.” S&P affirmed its AA+ rating in May 2025 but warned that sustained deficits could pressure the rating over the next three to five years.
| Agency | Current rating | Outlook | Key action or statement |
|---|---|---|---|
| Fitch | AA+ | Stable | Downgraded from AAA in August 2023, citing fiscal deterioration and repeated debt-limit standoffs |
| Moody’s | Aaa | Negative | Negative outlook since November 2023; reaffirmed March 2026, emphasising weakening debt affordability |
| S&P | AA+ | Stable | Affirmed May 2025; warned sustained deficits could pressure rating over three to five years |
The debt is not just large. It is compounding.
For many retail investors, government bonds sit in a mental category labelled “boring” or “safe.” That framing misses what the bond market actually is: the mechanism through which global capital votes on a government’s fiscal credibility in real time.
The mechanics are straightforward:
In early June 2026, the US 10-year Treasury yield sits at approximately 4.45-4.52% and the 30-year yield at approximately 4.74-4.80%. These levels represent a meaningful step up from the pre-pandemic decade.
Financial Times analysis from 28 May 2026 noted that mid-4% yields reflect both sticky inflation and a rising fiscal risk premium, with the steeper curve suggesting investors are demanding extra compensation for long-term US fiscal uncertainty. Bloomberg News reported on 20 May 2026 that the climb in 30-year yields is being driven less by growth optimism and more by concerns over persistent deficits and heavier Treasury issuance.
Term premium is the extra yield investors require for holding longer-dated bonds rather than simply rolling over short-term debt repeatedly. It compensates for the uncertainty of lending money for 10 or 30 years when inflation, fiscal policy, and economic conditions could shift dramatically.
During the 2010s decade of quantitative easing, central banks were absorbing vast quantities of government bond supply, which compressed term premium to near-zero or even negative territory. Investors did not need to demand extra compensation because a large, price-insensitive buyer (the central bank) was always in the market.
Its return in 2024-2026 reflects something different. Bond strategists cited by Bloomberg described term premium as having “returned,” with Treasuries now embedding “a clearer fiscal-risk component.” This is not merely an inflation signal. It is investors reasserting a price for the specific risk that the US government’s fiscal trajectory may not improve, which is why this yield environment is structurally different from the pre-pandemic decade.
Theory is one thing. What happened in April 2025 was something else: an empirical demonstration that the bond market can, and will, move a sitting president.
The sequence unfolded rapidly:
The Wall Street Journal reported on 22 April 2025 that the pause came after “a sharp sell-off in long-term Treasuries,” with officials privately acknowledging concern about “market perception of US fiscal and trade policy credibility.” The Financial Times noted on 24 April 2025 that the tariff pause stabilised the long end of the yield curve but did not change “the underlying concern about mounting deficits.”
“The long bond is increasingly trading like a risk asset, not a safe asset.” — Jeffrey Gundlach, DoubleLine webcast, 16 April 2025
Gundlach warned that a “buyers’ strike” is possible if yields do not adequately compensate for inflation and fiscal risk. The bond market did not simply warn a president. It moved him. The yield spike resolved quickly once the pause was announced, but the underlying fiscal concern remained entirely unaddressed by the policy reversal itself.
The April 2025 episode was not an isolated anomaly; analysts at Wolfe Research, Bloomberg Opinion, and Apollo have each concluded that bond market stress as a policy lever has now structurally displaced equity selloffs as the primary forcing mechanism on White House decision-making, a shift that reframes how investors should interpret subsequent policy announcements.
For Australian investors, the lesson is direct: bond yields are a leading indicator of policy stress, not a lagging reflection of it. If the pattern repeats, those watching yields will see the signal before the headlines arrive.
Ray Dalio, founder of Bridgewater Associates (one of the world’s largest hedge funds) and credited with anticipating both the 2008 global financial crisis and the 2010 European debt crisis, has spent decades studying how nations become insolvent. His research identifies a recurring pattern, an approximately 80-year cycle of debt accumulation leading to currency decline and imperial transition.
The pattern, drawn from historical precedents including the Dutch Empire, the British Empire, and the Roman Empire, follows a recognisable sequence:
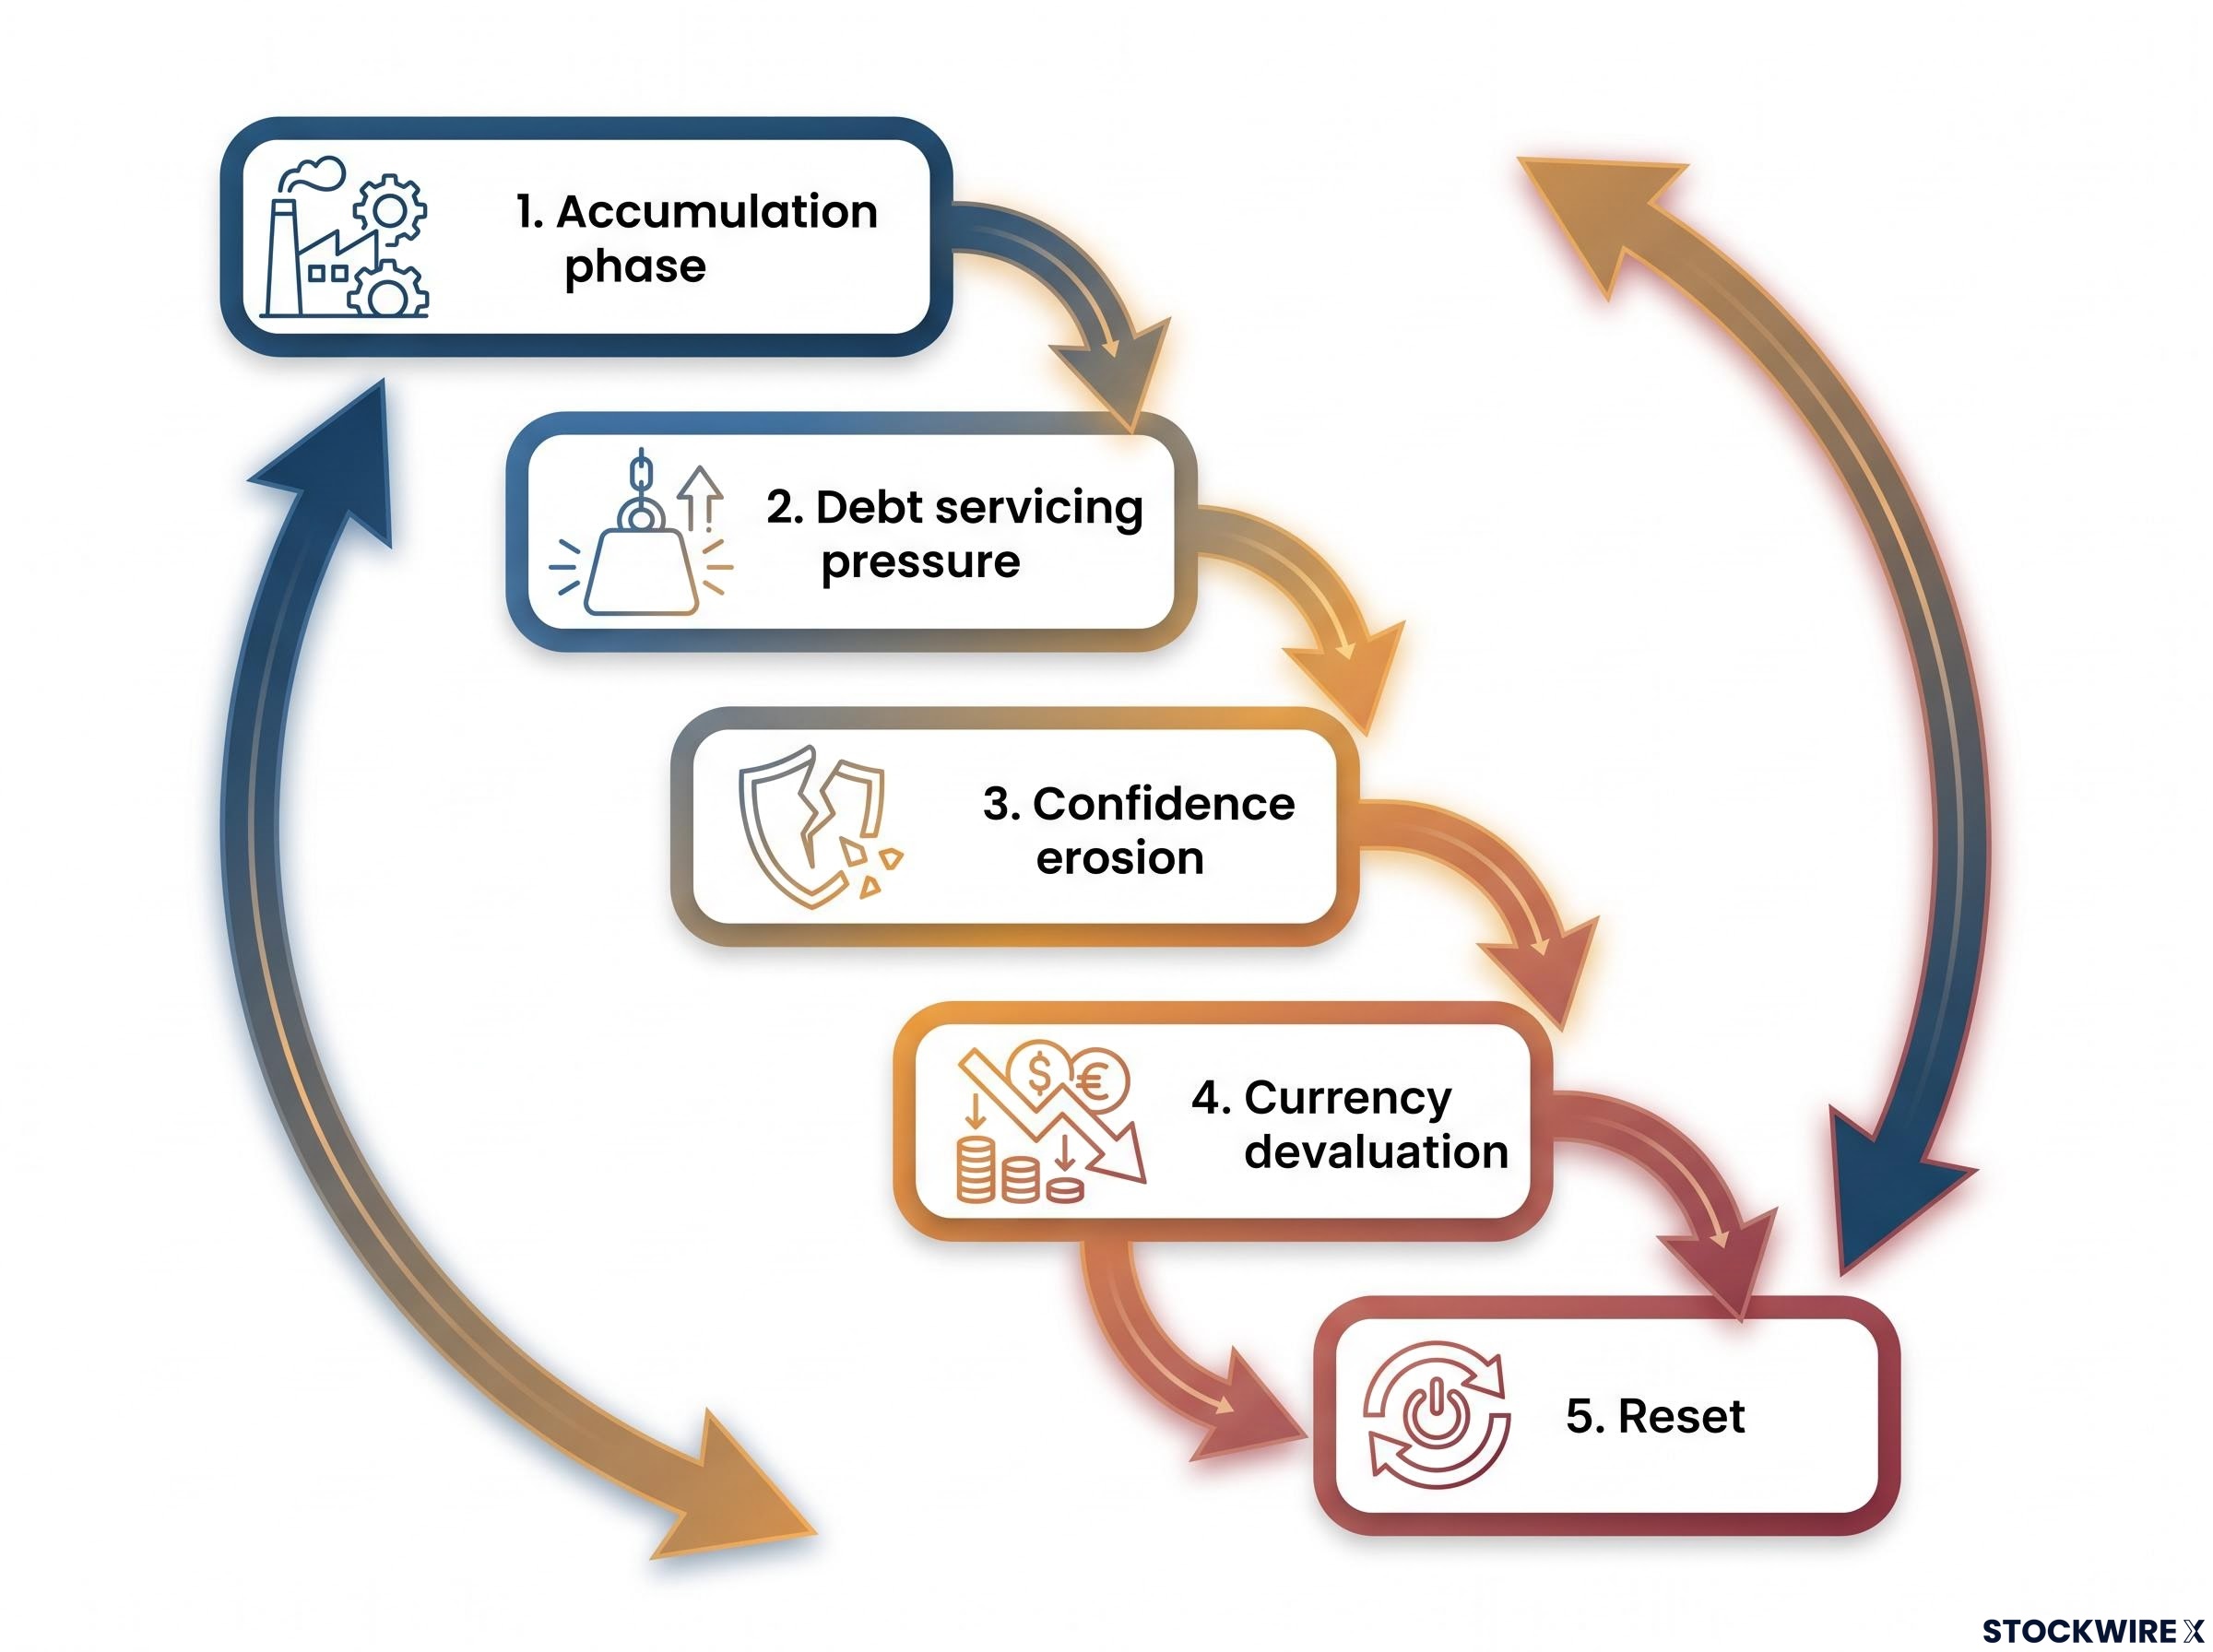
Dalio characterises the US as currently in the late or terminal phase of this cycle. In a LinkedIn essay published on 10 March 2025, he described a “late-stage, self-reinforcing debt spiral” where “debt servicing and fiscal deficits are outpacing income and productivity growth.” At Davos in January 2026, he stated the US is “on the verge of a debt-sustainability test by the bond market.”
“Bond yields are now the primary stress-relief valve.” — Ray Dalio, Financial Times op-ed, 5 May 2026
The framework is not without its critics. Paul Krugman, writing in the New York Times in February 2026, argued that the US is “not on the brink of a debt crisis,” noting that sustainability depends on the relationship between interest rates and growth rates. He conceded, however, that “continued political dysfunction around the budget could trigger market nerves.” Olivier Blanchard of the Peterson Institute observed in November 2025 that “the margin of safety for advanced-economy debt has shrunk.”
Dalio’s four-quadrant portfolio framework, designed to hold value across every combination of rising and falling growth and inflation, offers a practical construction approach for investors who accept the cycle thesis: the framework allocates deliberately across assets that perform differently in each macro environment rather than concentrating in the scenario expected to dominate.
The expert landscape divides into two broad camps: those who view current dynamics as a structural threat requiring market-imposed discipline (Dalio, Gundlach, Gross), and those who argue the risk is real but manageable provided fiscal politics improve (Krugman, Blanchard). Both camps agree that political and fiscal choices, not immediate technical insolvency, are the core determinant of outcomes.
US Treasury yields do not stay in the US. Because Treasuries are the global benchmark for risk-free rates, any repricing of US fiscal risk flows directly into Australian government bond yields, equity discount rates, and asset valuations denominated in Australian dollars.
The Australian Financial Review explained in May 2025 that US yields transmit to Australian government bonds and local equity discount rates, flagging duration risk for retirees. Marcus Today noted in September 2025 that US 10-year yields above 4% have forced a repricing of risk assets in Australia, advising retirees to revisit risk profiles.
The higher-yield environment creates a genuine tension. On one side, yields above 4% globally mean retirees can build competitive income portfolios from investment-grade bonds without reaching for speculative equities, a genuine positive shift from the 2010s. On the other, when US yields spike (as in April 2025), bond prices fall, including prices of Australian bond funds and ETFs with meaningful duration exposure. Long-duration bond holders face mark-to-market losses during yield spike episodes, even if they ultimately receive face value at maturity.
Australian financial media and fund managers, including the Australian Financial Review, Livewire Markets, Marcus Today, Vanguard Australia, and Magellan Financial Group, have collectively emphasised several practical principles:
These are general informational principles, not personal financial advice. Investors should speak with a qualified adviser about their specific circumstances.
The macro concern becomes manageable when it converts into a monitoring framework. Three metrics deserve regular attention from Australian investors.
| Metric | Current level (June 2026) | Stress signal threshold | Interpretation |
|---|---|---|---|
| US 10-year Treasury yield | ~4.45-4.52% | Sustained move above 5% | Mid-4% range reflects elevated but stable conditions with fiscal risk priced in |
| US 30-year Treasury yield | ~4.74-4.80% | Sustained move above 5% (briefly seen April 2025) | A sustained breach would signal markets demanding materially higher compensation for fiscal risk |
| AUD/USD exchange rate | Secondary indicator | Rapid decline alongside rising US yields | Dollar weakness combined with disorderly yield spikes would represent a more severe warning |
Credit rating agency statements from Fitch, Moody’s, and S&P serve as additional waypoints. Any further downgrade or outlook revision would likely amplify yield pressure.
For investors wanting to understand the specific market mechanics behind recent yield moves, our full explainer on the May 2026 yield spike covers the Moody’s downgrade trigger, the 5.25% threshold that strategists identify as a structural inflection point for institutional equity allocations, and the synchronised repricing across UK Gilts, German Bunds, and Japanese JGBs that confirms this is a global term-premium shift rather than a US-specific event.
The Federal Reserve Board’s Financial Stability Report from May 2026 warned that “a sharp rise in yields could amplify stress across financial markets.” Gundlach told CNBC in February 2026 that the current situation represents “a yellow light, not yet a red light,” adding that “the US is closer to a fiscal event than markets are pricing.”
“A yellow light, not yet a red light.” — Jeffrey Gundlach, CNBC, 3 February 2026
Bill Gross wrote in July 2025 that Treasuries are “no longer the unquestioned risk-free asset.” The scenario these investors describe, a disorderly repricing of US sovereign debt, is characterised as low-probability but high-impact. The appropriate posture is ongoing monitoring and portfolio resilience, not panic or dramatic repositioning.
The US spends roughly US$3 billion per day on interest. That figure is not shrinking. The CBO projects it will grow as deficits compound and maturing debt is refinanced at higher rates. No major deficit-reduction legislation has been enacted, and the political environment offers little near-term prospect of one.
The bond market, as April 2025 demonstrated, does not wait for legislative consensus. It reprices in real time, and that repricing flows directly into the yields, valuations, and income streams that Australian investors rely on.
The practical response is proportionate, not dramatic. Check the US 10-year Treasury yield periodically; it is freely available on the Reserve Bank of Australia and Bloomberg websites. Review fixed-income duration exposure with a qualified adviser. Build portfolio resilience to a yield-spike scenario rather than positioning for a single macro outcome.
This article is for informational purposes only and should not be considered financial advice. Investors should conduct their own research and consult with financial professionals before making investment decisions. Past performance does not guarantee future results. Financial projections are subject to market conditions and various risk factors.
—
The US debt spiral refers to a self-reinforcing cycle where rising deficits require more bond issuance, which pushes yields higher, which increases future interest costs, widening deficits further. With gross federal debt at approximately US$39.2 trillion and annual interest obligations approaching US$1.2 trillion, the dynamic has moved from a long-term concern into an immediate market-moving reality.
Because US Treasuries are the global benchmark for risk-free rates, any repricing of US fiscal risk flows directly into Australian government bond yields, equity discount rates, and asset valuations denominated in Australian dollars. Australian retirees with duration exposure in bond funds or ETFs also face mark-to-market losses during yield spike episodes.
When the Trump administration introduced tariffs above the anticipated 10% baseline in early April 2025, 30-year Treasury yields spiked briefly above 5%, prompting a 90-day tariff pause within approximately seven days, with officials privately citing bond market concern as a factor in the reversal.
Term premium is the extra yield investors demand for holding longer-dated bonds rather than rolling over short-term debt, compensating for uncertainty over inflation, fiscal policy, and economic conditions across a 10 or 30-year horizon. Its return in 2024-2026 reflects investors reasserting a price for the specific risk that the US fiscal trajectory may not improve, which is structurally different from the near-zero term premium environment of the 2010s.
A sustained move above 5% in either the US 10-year or 30-year Treasury yield is considered a key stress signal threshold, with the current levels sitting at approximately 4.45-4.52% and 4.74-4.80% respectively as of June 2026. A rapid decline in the AUD/USD exchange rate alongside disorderly yield spikes would represent an additional and more severe warning sign.