Most retail investors can name a software stock on the ASX. Far fewer can explain why its financials look the way they do. WiseTech Global (ASX: WTC) has compounded revenue at 27.1% per year over three years and still carries an 84.0% gross margin. What does that actually mean, and why should it shape the way investors read any software company’s numbers?
WiseTech is one of Australia’s most closely watched technology companies. Its cloud-based logistics platform, CargoWise, is used by 24 of the 25 largest global freight forwarders and 46 of the top 50 third-party logistics providers. That market penetration makes WiseTech an unusually rich case study: its financials are publicly reported, its business model is well understood, and its metrics sit at the premium end of the ASX software landscape.
This guide uses WiseTech’s real reported figures to teach the financial metrics that matter most when analysing any ASX software company: revenue growth trajectory, gross margin, net profit expansion, balance sheet health, and return on equity. This is not a buy or sell recommendation. It is a framework for reading software financials with confidence.
Why revenue growth trajectory matters more than any single year’s number
A single revenue figure tells an investor almost nothing useful in isolation. Revenue of $500 million could belong to a business accelerating toward $1 billion or one sliding from $700 million. The growth rate over multiple years is what reveals whether demand for a company’s product is accelerating, stable, or deteriorating.
The ASX information technology sector blends profitable, high-margin SaaS platforms with speculative early-stage names, meaning index-level returns can be deeply misleading when assessing any individual software stock’s quality or growth potential.
The standard tool for measuring this trajectory is the compound annual growth rate, or CAGR. In plain terms:
- What it measures: the smoothed annual rate at which a figure has grown over a defined period, removing the noise of individual years.
- How to think about it: if revenue grew from $500 million to $1 billion over three years, CAGR gives the single annual growth rate that, compounded each year, would produce that result.
- What it tells investors: whether a business is sustaining, accelerating, or decelerating its growth when measured consistently across time.
High-growth software businesses are generally considered those sustaining double-digit revenue CAGRs over multi-year periods. A company that grows at 8% one year and 25% the next is harder to assess than one compounding at 20% over five years.
Reading WiseTech’s revenue growth in context
Over three years to the most recently reported period, WiseTech compounded revenue at 27.1% per annum.
That trajectory placed WiseTech firmly in the high-growth software category, with FY24 revenue reaching A$1,041.7 million. The FY25 result of A$778.7 million showed 14% reported growth, though the year-on-year comparison is complicated by merger and acquisition activity that affected the revenue base. The cleaner signal sits in organic growth figures, which strip out acquisition effects to isolate underlying software demand. For WiseTech, organic growth of 113% on the FY24 base underscored the strength of the core CargoWise platform beneath the M&A noise.
When big ASX news breaks, our subscribers know first
What an 84% gross margin reveals about software economics
Gross margin measures the percentage of revenue remaining after subtracting the direct costs of delivering a product or service (cost of goods sold). It is the clearest signal of a software company’s underlying economics before overheads, tax, and one-off costs enter the picture.
The reason software gross margins are structurally higher than those of physical goods businesses is straightforward: the marginal cost of delivering an additional software licence is near zero. Once the code is written and the infrastructure is built, each new customer generates revenue with minimal incremental production cost. That economic structure creates the leverage that makes software businesses attractive to long-term investors.
SaaS gross margin benchmarks consistently place high-quality software businesses in the 70-90% range, reflecting the scalable delivery model where the marginal cost of serving an additional customer is negligible once core infrastructure and engineering investment is in place.
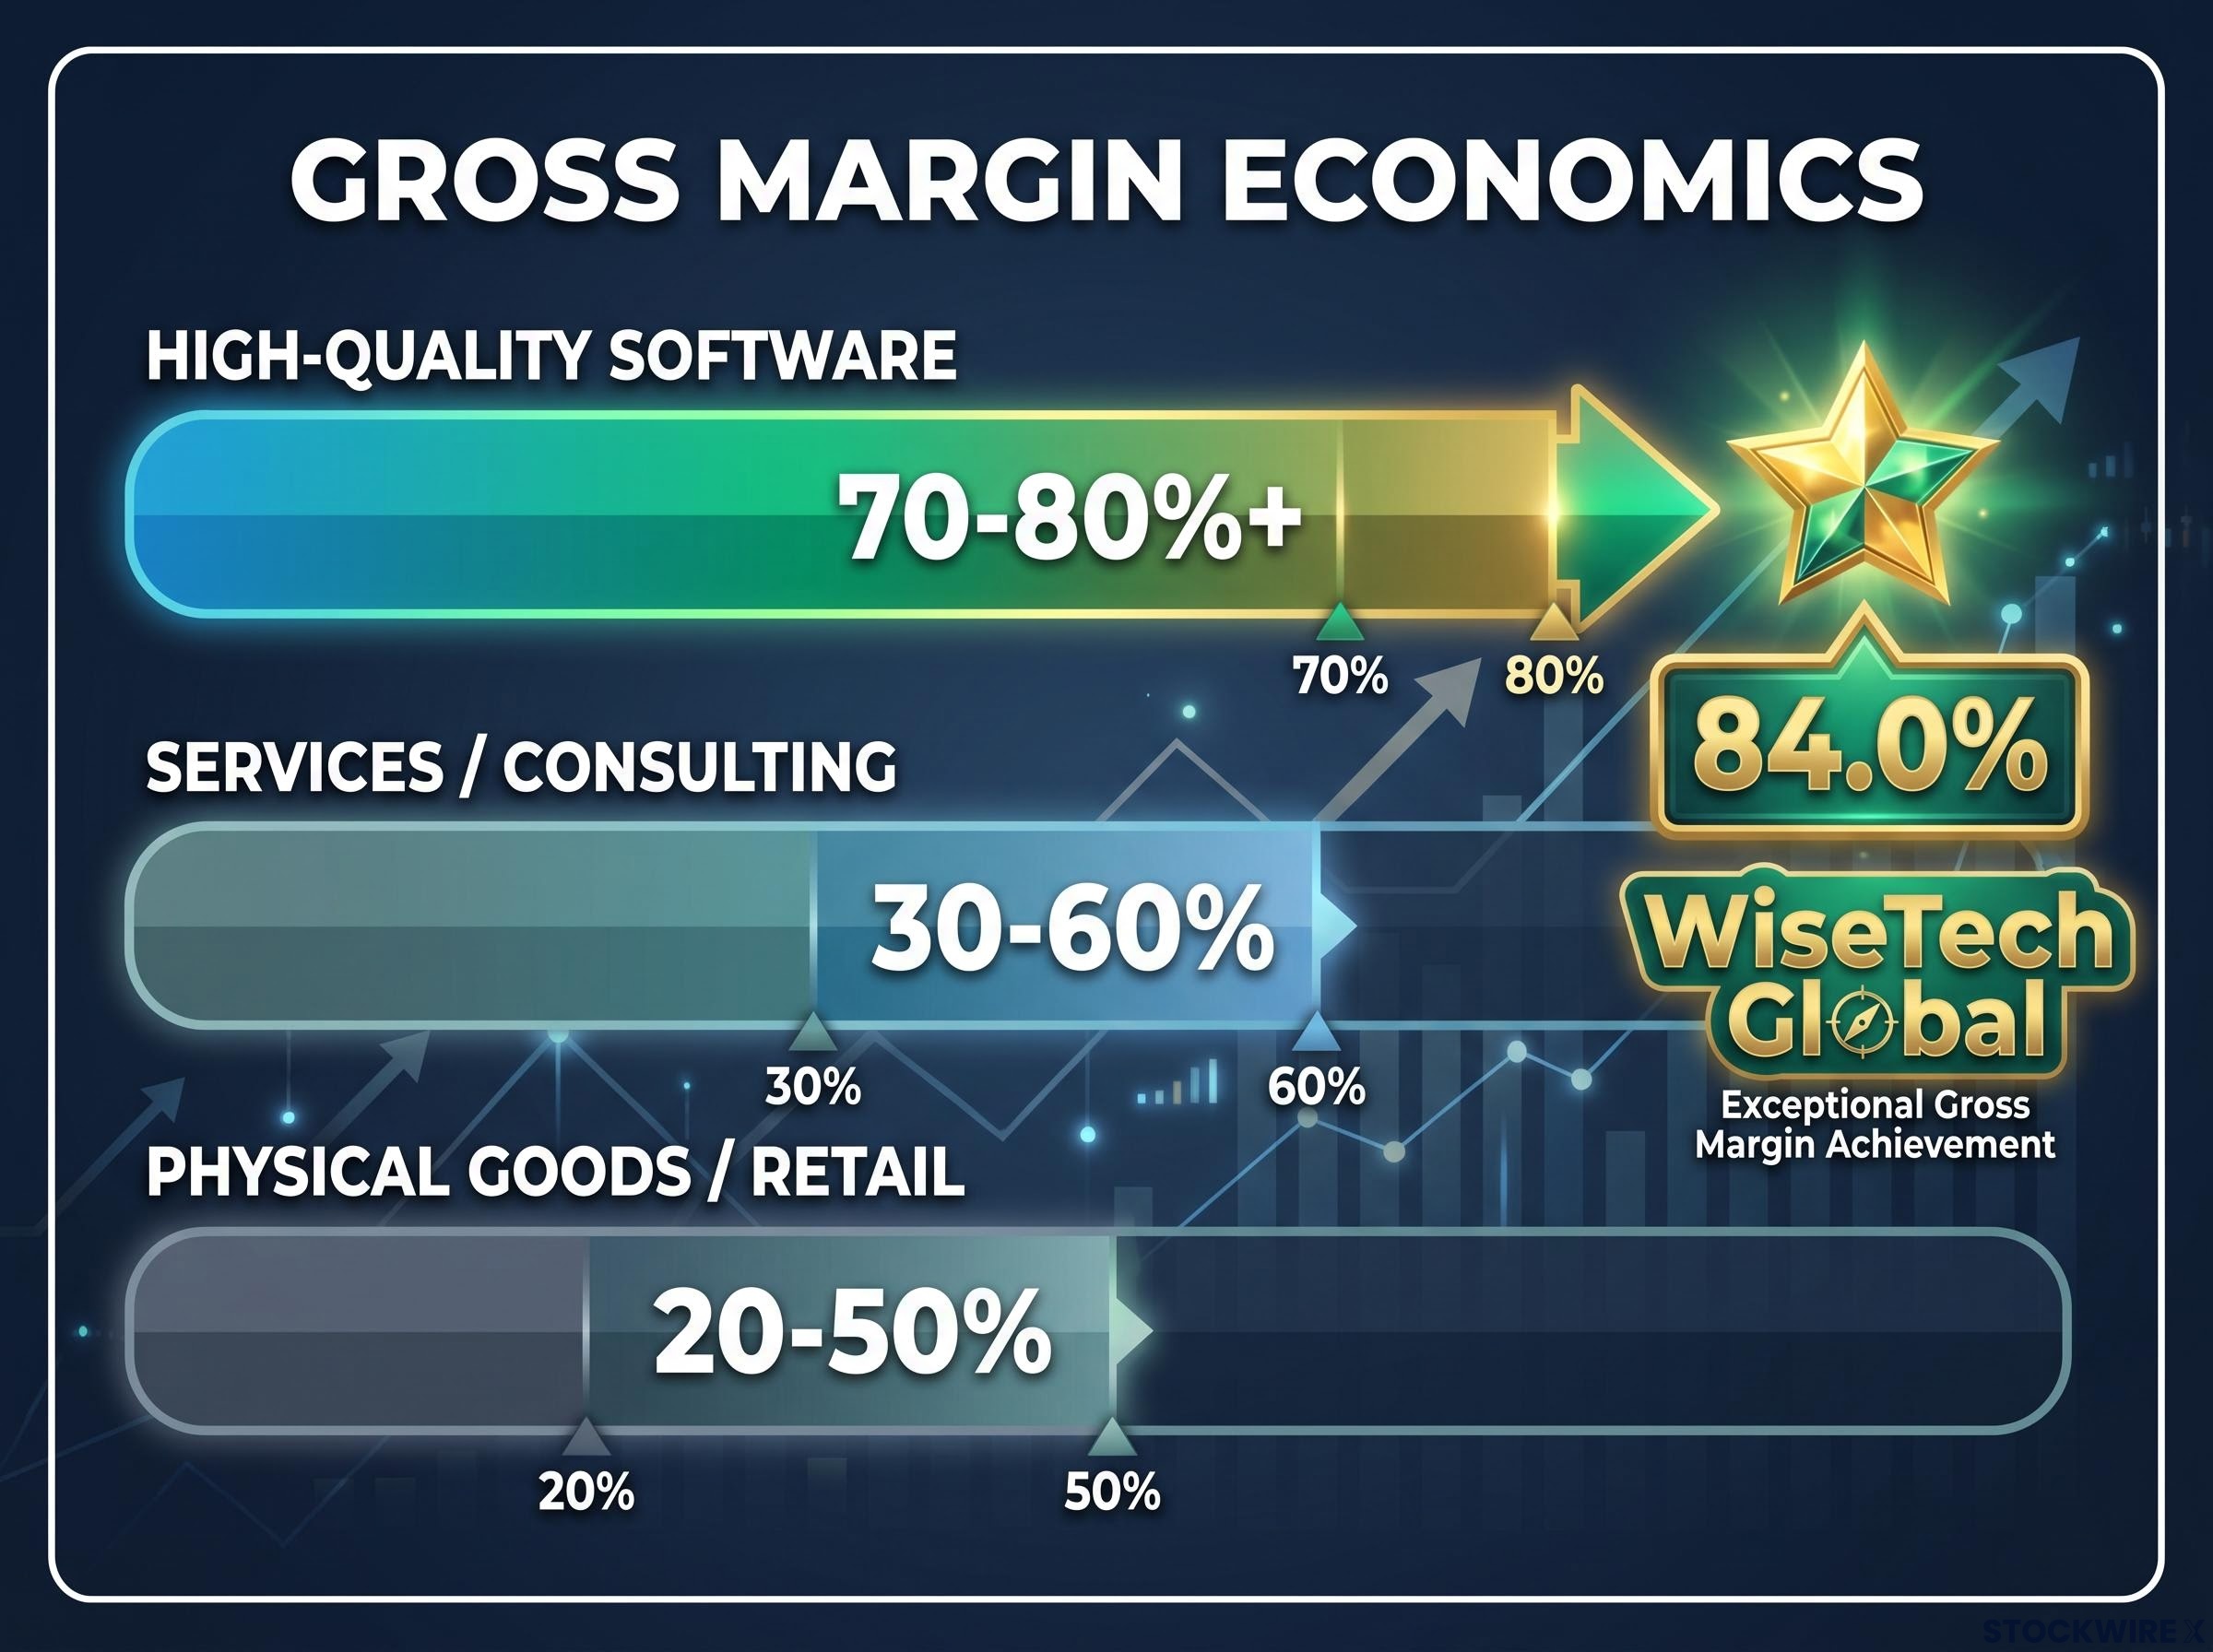
| Business Type | Typical Gross Margin Range | What It Signals |
|---|---|---|
| High-quality software | 70-80%+ | Near-zero marginal cost; strong product economics |
| Services / consulting | 30-60% | Labour-intensive delivery; margins tied to headcount |
| Physical goods / retail | 20-50% | Material and manufacturing costs constrain margins |
Independent commentary from Morningstar Australia and Livewire Markets consistently points to gross margins in the 70%+ to 80%+ range as characteristic of high-quality software businesses.
WiseTech’s gross margin of 84.0% sits above that benchmark range, indicating product economics at the premium end of ASX-listed software.
A high gross margin creates headroom for research and development investment, sales expansion, and profit scaling without proportional cost growth. It measures the economic quality of the product itself, independent of how the company is managed.
How to read net profit growth as a sign of operating leverage
Revenue growth is the starting point. The next question is whether profit is growing faster than revenue, because that gap is what reveals operating leverage at work.
Operating leverage is the dynamic where revenue growth disproportionately lifts profit. It occurs because a software company’s largest costs (engineering teams, infrastructure, management) are largely fixed. Adding new customers or new revenue does not require hiring proportionally more engineers or building proportionally more data centres. Each additional dollar of revenue flows through to profit at a higher rate than the last.
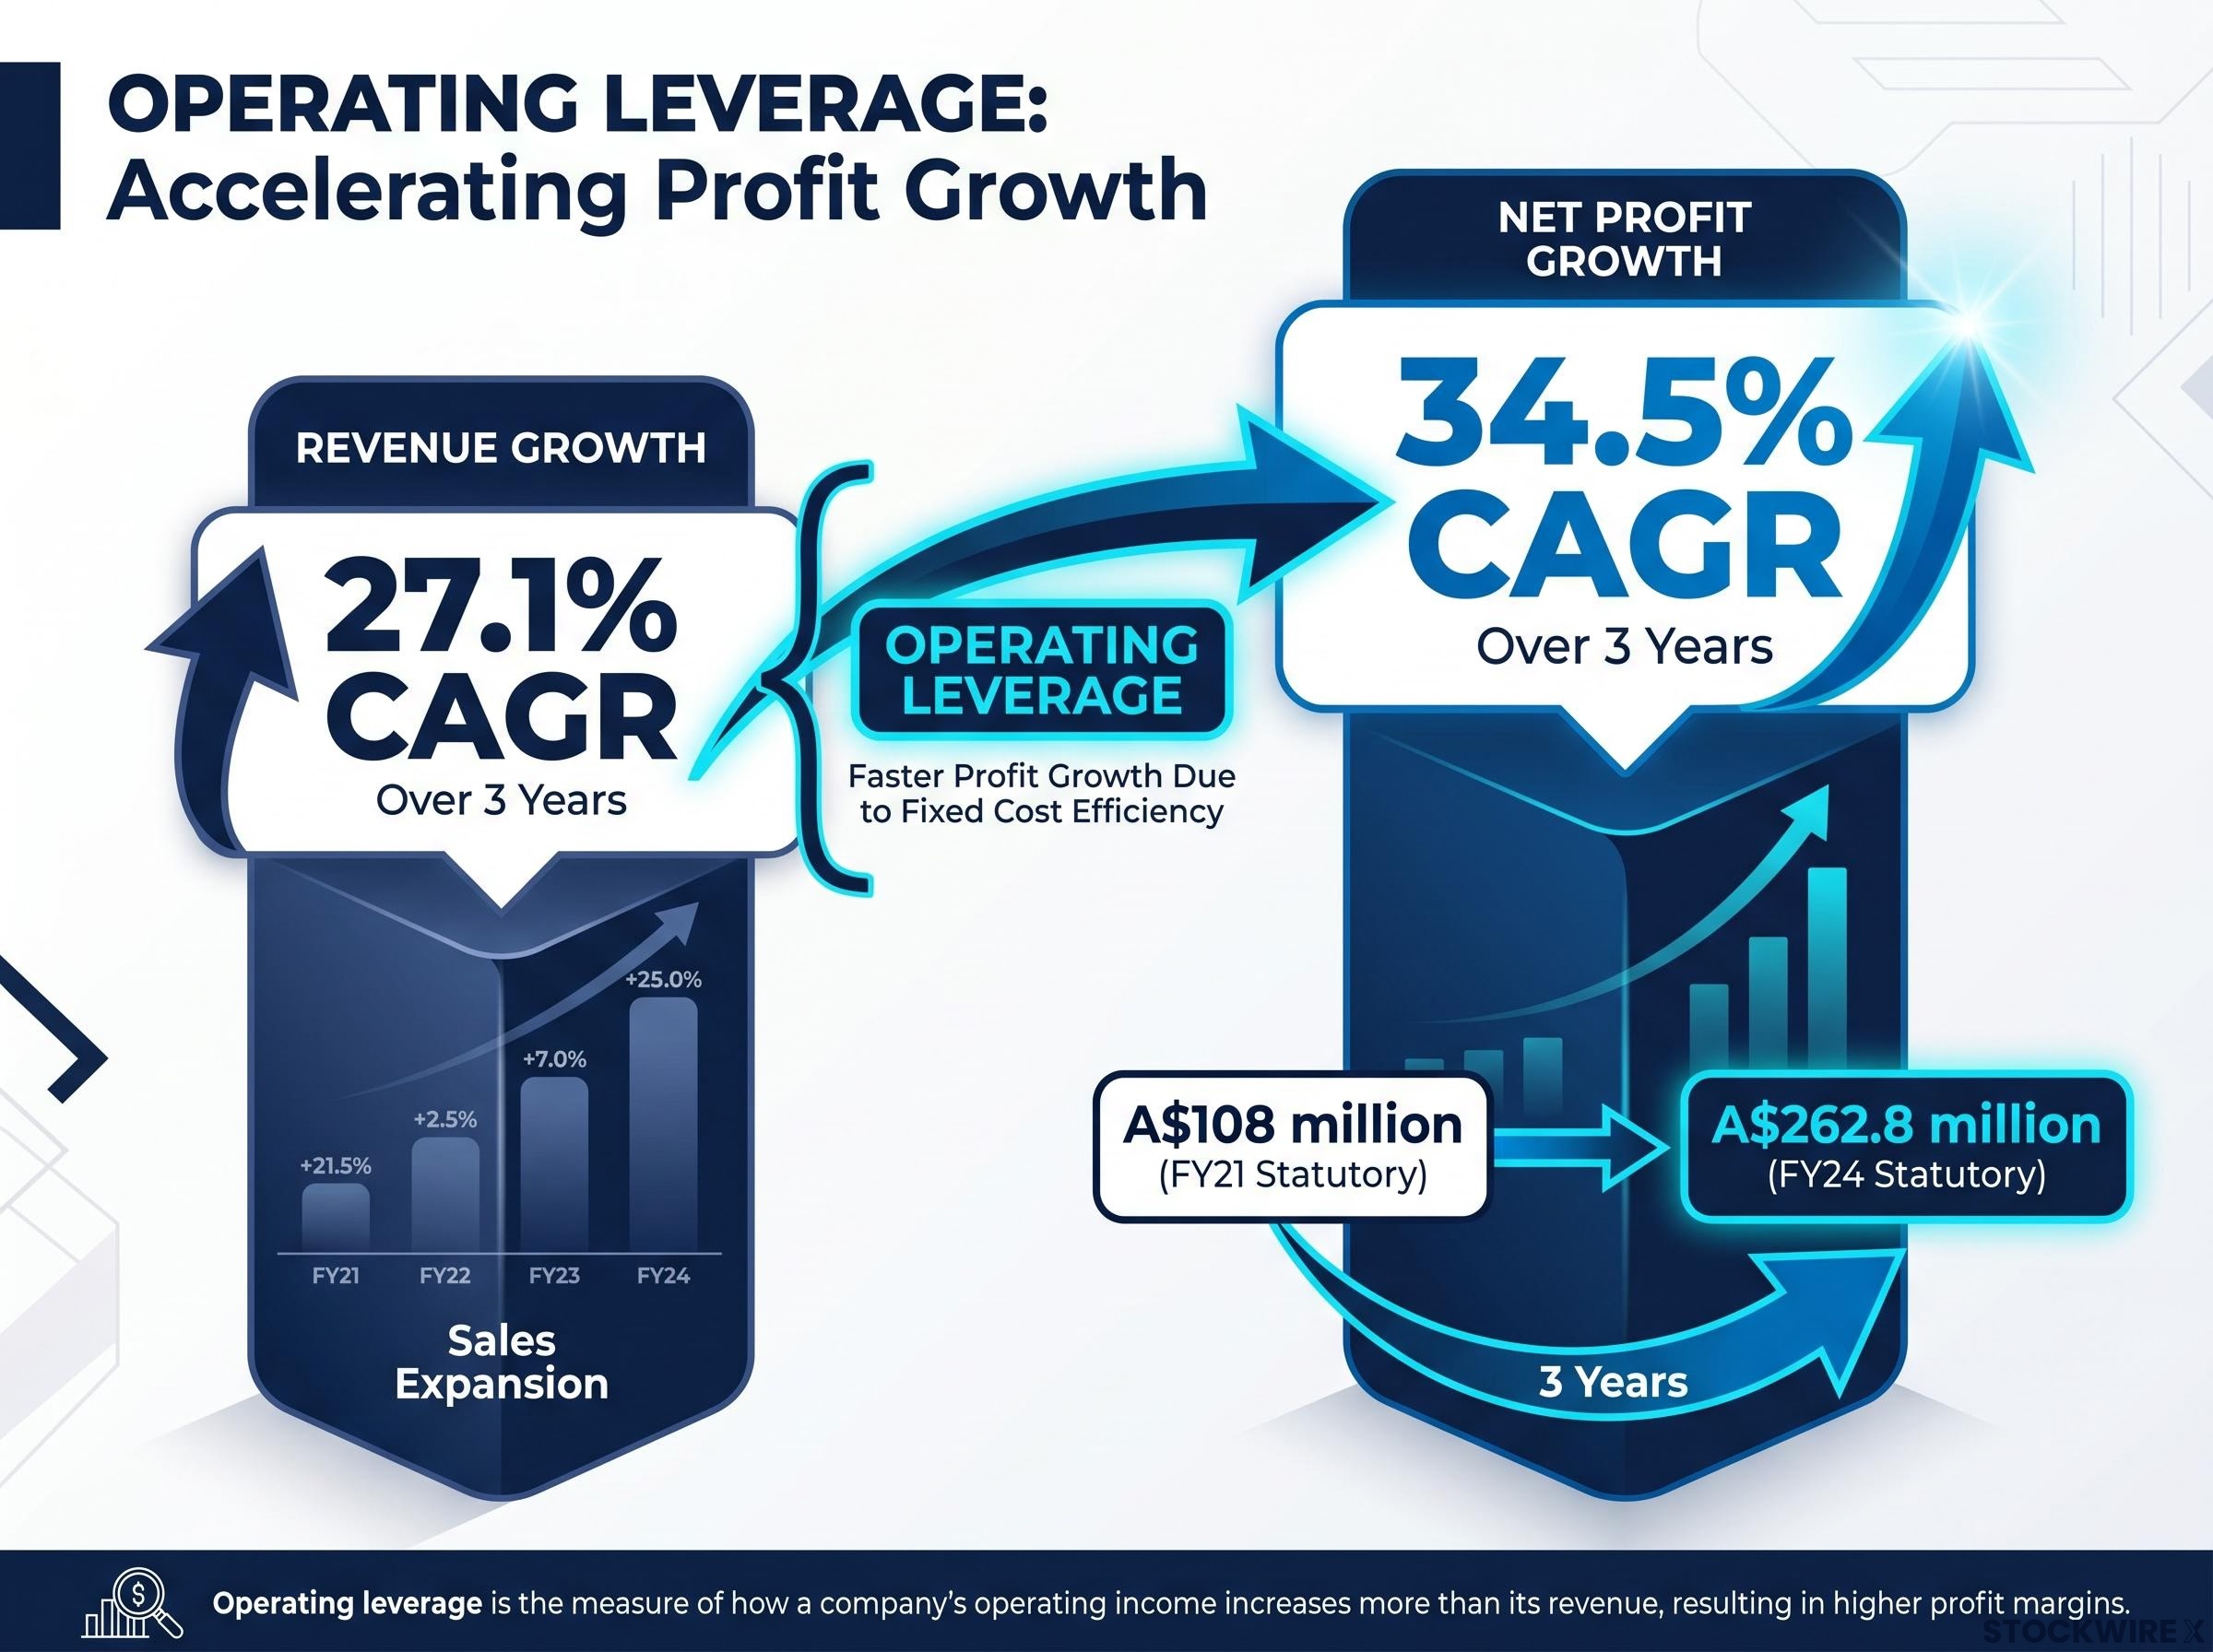
WiseTech’s reported figures illustrate this directly. Net profit after tax grew from A$108 million three years prior to A$262.8 million (statutory) in FY24, representing a 34.5% three-year CAGR. Revenue compounded at 27.1% over the same period. Profit grew materially faster than revenue.
Revenue CAGR: 27.1%. Net profit CAGR: 34.5%. The gap between these two rates is operating leverage at work.
When reading profit figures, two versions often appear in a company’s results:
- Statutory NPAT (net profit after tax): the figure calculated under accounting standards, including all items such as acquisition costs, restructuring charges, and non-recurring expenses. WiseTech reported statutory NPAT of A$262.8 million in FY24.
- Underlying NPAT: an adjusted figure that strips out items the company considers non-recurring or unrelated to ongoing business performance. WiseTech reported underlying NPAT of A$283.5 million in FY24. Both figures matter: statutory NPAT reflects the full economic reality, while underlying NPAT offers a view of recurring profitability.
These results were reported on 21 August 2024. When a company’s profit grows faster than its revenue over multiple years, it signals that the business model is maturing in the right direction. For retail investors assessing ASX software companies, the gap between revenue and profit growth rates is one of the most telling indicators of business quality.
Assessing a Software Company’s Financial Strength: Beyond the Income Statement
Debt is not automatically a warning sign. The question is whether a company’s debt level is proportionate to its earnings power and whether the balance sheet provides strategic flexibility.
Net debt is calculated as total borrowings minus cash on hand. When the result is negative, the company holds more cash than it owes, a position of financial conservatism. WiseTech’s FY24 net debt stood at negative A$19 million, meaning the business was effectively debt-free at that point.
The debt-to-equity ratio (total debt divided by shareholder equity) measures how much of a company’s funding comes from borrowings relative to equity. WiseTech’s FY24 debt-to-equity ratio of 4.7% indicated that shareholder equity substantially outweighed debt obligations, reflecting low financial leverage.
Since FY24, WiseTech has continued its acquisition-led expansion, completing the e2open acquisition on 4 August 2025. As of the 1H26 reporting period (results reported 25 February 2026), WiseTech reported liquidity of over A$950 million, reflecting both ongoing M&A activity and continued cash generation.
| Metric | WiseTech FY24 Figure | What It Measures | Quality Signal |
|---|---|---|---|
| Net Debt | Negative A$19 million | Borrowings minus cash on hand | Negative = net cash position; financial conservatism |
| Debt-to-Equity Ratio | 4.7% | Debt relative to shareholder equity | Low ratio = minimal leverage risk |
| Return on Equity | 12.8% | Profit relative to shareholder equity | Above 10% minimum; below 15%+ stronger signal |
Return on equity: tying profitability to shareholder capital
Return on equity (ROE) measures how efficiently a company generates profit relative to the capital shareholders have invested. It is calculated as net profit divided by shareholder equity.
ROE is particularly informative for software companies because these businesses typically do not require heavy physical capital (factories, equipment, inventory) to operate. A software company generating strong returns on a relatively light equity base is demonstrating efficient use of shareholder capital.
WiseTech’s FY24 ROE of 12.8% sits above the double-digit minimum threshold generally associated with capital efficiency. However, it falls below the 15%+ level that general market commentary treats as a stronger quality signal. In practice, this means WiseTech is producing efficient returns on equity without yet reaching the top tier on this specific measure.
A strong balance sheet is not merely a safety feature. It is a strategic asset that gives software companies the capacity to acquire competitors, invest in product development through downturns, and fund growth without diluting shareholders. Retail investors who overlook balance sheet metrics are assessing only half the picture.
For investors wanting to build fluency with the underlying accounting before applying these ratios, our dedicated guide to reading an ASX balance sheet walks through the assets, liabilities, and equity structure in full, including how to calculate working capital, debt-to-equity, and book value per share from an actual ASX filing.
The moat question: why competitive position shapes every financial metric
The four financial dimensions covered above, revenue growth, gross margin, profit leverage, and balance sheet health, are not independent data points. They are downstream consequences of a company’s competitive position. A durable competitive moat is what allows a software business to sustain high margins and strong pricing power over time without constant discounting.
Independent commentary from Morningstar Australia and Livewire Markets identifies three reinforcing moat sources in WiseTech’s business:
- Network effects: CargoWise becomes more valuable as more logistics operators (freight forwarders, customs brokers, third-party logistics providers) operate on the same platform, creating network-driven adoption.
- Switching costs: CargoWise is deeply embedded in customers’ core operational workflows covering customs, forwarding, and compliance processes. Replacing it would require significant disruption to mission-critical operations.
- Mission-critical functionality: The platform handles operationally non-negotiable functions for large freight operators, reinforcing dependence and pricing power.
What CargoWise’s market penetration tells investors about switching costs
When 24 of the 25 largest freight forwarders use the same platform, that platform becomes a de facto industry standard. This is the strongest form of switching cost, because alternatives require customers to diverge from the workflow their entire industry operates on.
That competitive position connects directly to the financial metrics covered earlier. Switching costs protect revenue retention, supporting the 27.1% revenue CAGR. Mission-critical embedding supports pricing power, protecting the 84.0% gross margin. Network effects expand the installed base with minimal incremental cost, driving the operating leverage that produced a 34.5% profit CAGR.
The financial metrics do not exist in isolation. They are expressions of WiseTech’s competitive position.
Investors wanting to apply moat analysis beyond WiseTech to a wider ASX portfolio will find our full explainer on economic moat investing useful; it walks through all five moat sources identified by Morningstar, including how switching costs and network effects compound over time, with additional ASX examples including CSL.
A framework retail investors can apply to any ASX software company
The five metrics covered in this guide form a coherent evaluation sequence that applies to any ASX-listed software company, not just WiseTech. When opening a company’s annual report or Appendix 4E filing, work through these in order:
- Revenue CAGR: Calculate or locate the multi-year compound growth rate. Sustained double-digit CAGRs indicate a high-growth trajectory. Single-year figures in isolation are insufficient.
- Gross margin: Look for margins in the 70%+ to 80%+ range, per commentary from Morningstar Australia and Livewire Markets. Margins materially below this band may indicate a services-heavy or hardware-dependent business model.
- Profit CAGR versus revenue CAGR: Compare the two rates over the same period. Profit growing faster than revenue is evidence of operating leverage and a maturing business model.
- Balance sheet metrics: Check net debt (negative means net cash), debt-to-equity ratio (lower is more conservative), and assess whether the company has financial flexibility for investment or acquisitions.
- Moat assessment: Identify the structural reasons the company can sustain its financial metrics. Look for switching costs, network effects, or mission-critical functionality. If the moat is unclear, the financial metrics may not be sustainable.
No single metric tells the whole story. The strongest assessments combine financial analysis with qualitative moat evaluation, because the moat determines whether the numbers are sustainable.
WiseTech’s figures, an 84.0% gross margin, 27.1% revenue CAGR, 34.5% profit CAGR, 4.7% debt-to-equity ratio, and 12.8% ROE, illustrate where a high-quality ASX software business sits against these benchmarks.
This article is for informational purposes only and should not be considered financial advice. Investors should conduct their own research and consult with financial professionals before making investment decisions. All financial figures used in this guide are drawn from WiseTech Global’s publicly reported results and independent research commentary.
The bigger picture on WiseTech and ASX software quality
WiseTech Global’s financials are not merely impressive numbers. They are a concrete illustration of what financially healthy, moat-protected software businesses tend to look like, and they give retail investors a reference point for comparison across the ASX technology sector.
A reader who has worked through this guide now knows how to read revenue growth trajectory over multiple years, interpret gross margin against quality benchmarks, identify operating leverage in profit growth, assess balance sheet conservatism through net debt and debt-to-equity, and connect financial metrics to competitive position.
The ability to read these metrics confidently does not replace professional financial advice. It does make an investor a more informed participant in any conversation about ASX technology stocks. Apply this framework to another ASX-listed software company of interest, starting with the company’s most recent annual report or Appendix 4E filing available on the ASX announcements platform.
Acquisition-compounding software models represent the logical extension of the moat and balance sheet principles covered here: Constellation Software, for example, has built a sourcing and integration engine that contacts up to 100,000 private vertical software companies annually, using a low-leverage balance sheet and decentralised approval architecture to sustain high-volume deal flow at returns that reinforce rather than dilute the core moat.
The ASIC financial reporting obligations for listed companies require ASX-listed disclosing entities to lodge half-yearly and full-year financial reports, making the Appendix 4E filing and annual report the primary documents retail investors should consult when applying this framework to any ASX software company.
—