
Micron Confirms HBM4 Deal, Then Falls 7.7% in AI Selloff
3 hrs ago

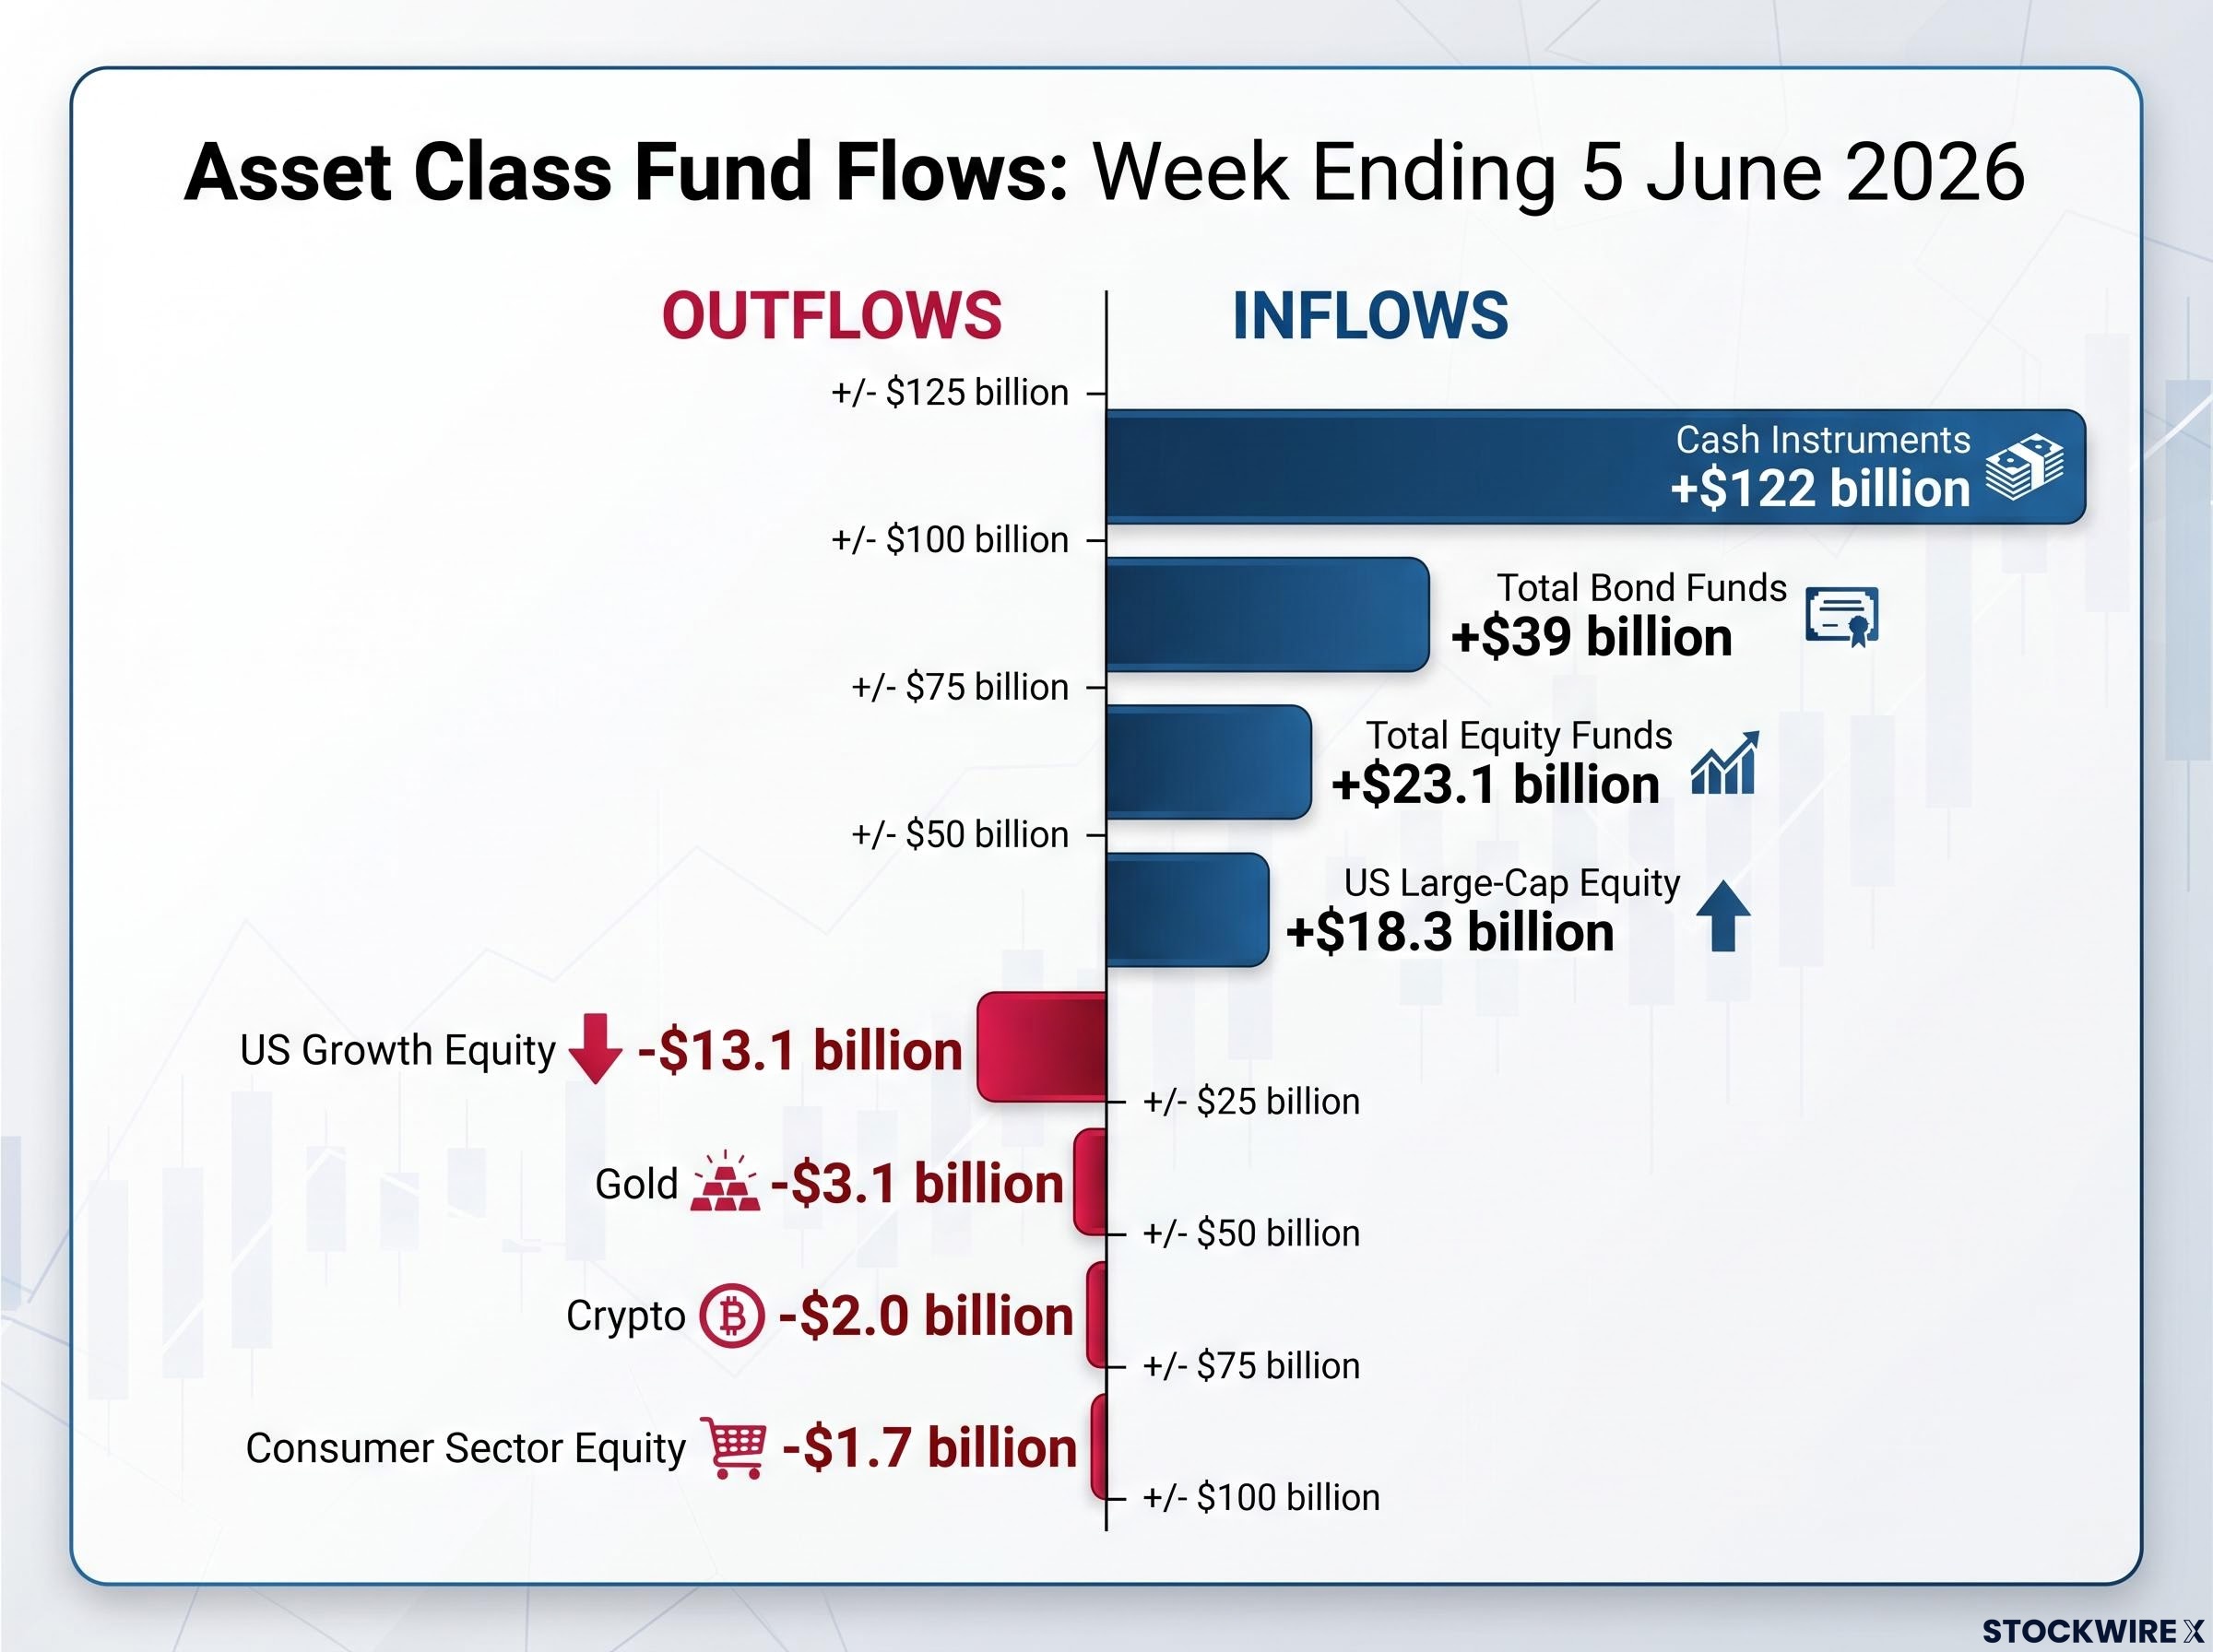
Bond funds absorbed $39 billion in a single week, the largest inflow ever recorded for the asset class, while cash instruments pulled in $122 billion over the same period. Both figures arrived in the same weekly fund flow data snapshot for the week ending 5 June 2026, published by Bank of America with analysis from strategist Michael Hartnett. The BofA Bull and Bear Indicator has now sustained a sell signal for three consecutive weeks, climbing to 8.7. Record defensive positioning in bonds and cash, targeted redemptions from growth and consumer equities, and a persistent contrarian warning from one of Wall Street’s most-watched sentiment gauges: this is an unusually coherent set of signals, and each one warrants individual attention. What follows is a breakdown of where capital moved, what those movements collectively indicate about risk appetite, and why BofA’s indicator is layering caution onto a market that still looks buoyant on the surface.
The number on its own is enough to warrant attention.
$39 billion flowed into bond funds in a single week, making it the largest weekly bond inflow on record, according to BofA’s fund flow report for the week ending 5 June 2026.
What matters more than the headline figure, however, is where within the bond market that capital landed. The composition points to a quality-first allocation rather than a broad-based bond bid:
Investment-grade debt alone accounted for more than half of the record. Capital moved toward predictable income and creditworthy issuers, not toward riskier corners of the fixed-income market. For investors watching bonds as a leading sentiment indicator, the IG concentration sharpens the signal: this was a deliberate, quality-driven defensive move.
The $122 billion net inflow into cash instruments for the same week was roughly three times the size of the bond record. No benchmark comparison period is available for the cash figure, so it cannot be confirmed as a record. The scale alone, however, is difficult to attribute to routine portfolio rebalancing.
What makes the combination of both figures more informative than either in isolation is the strategic logic each represents. Bonds and cash are both defensive, but they serve different purposes in a portfolio.
Together, the two moves describe a wait-and-see posture: generate income on the portion of capital that has been redeployed, while keeping a larger pool liquid for opportunistic re-entry. The $122 billion cash surge, roughly three times the bond figure, suggests the balance tilted heavily toward optionality. At that scale, the positioning likely reflects institutional-level decision-making rather than retail caution alone.
The cash rush preceding this week was itself notable: $136 billion moved into cash funds in the week ending 8 May 2026, the largest single-week defensive cash move since January 2026, placing the Bull and Bear Indicator at 7.2 and just 0.8 points below the sell-signal threshold that has since been breached and sustained.
BofA’s Bull and Bear Indicator aggregates positioning, sentiment, and flow data across markets into a single score. It is a contrarian tool, meaning it is designed to warn when consensus has become crowded in one direction. Readings above approximately 8.0 have historically been associated with near-term weakness, not because they predict a crash, but because they signal that bullish positioning has become stretched enough that the market is vulnerable to a pullback or consolidation.
The distinction matters. A sell signal from this framework is not a directional forecast. It reflects the degree to which investors have already acted on optimism, leaving fewer marginal buyers to push prices higher.
The indicator’s sell-signal threshold at 8.0 is not a routine crossing: the contrarian sell signal has been triggered only 18 times since 2002, with each prior instance historically preceding average global equity declines of 2-3% within three months.
The indicator now reads 8.7, up from 8.5 the prior week, and has sustained its sell signal for three consecutive weeks, the longest current streak of elevated readings.
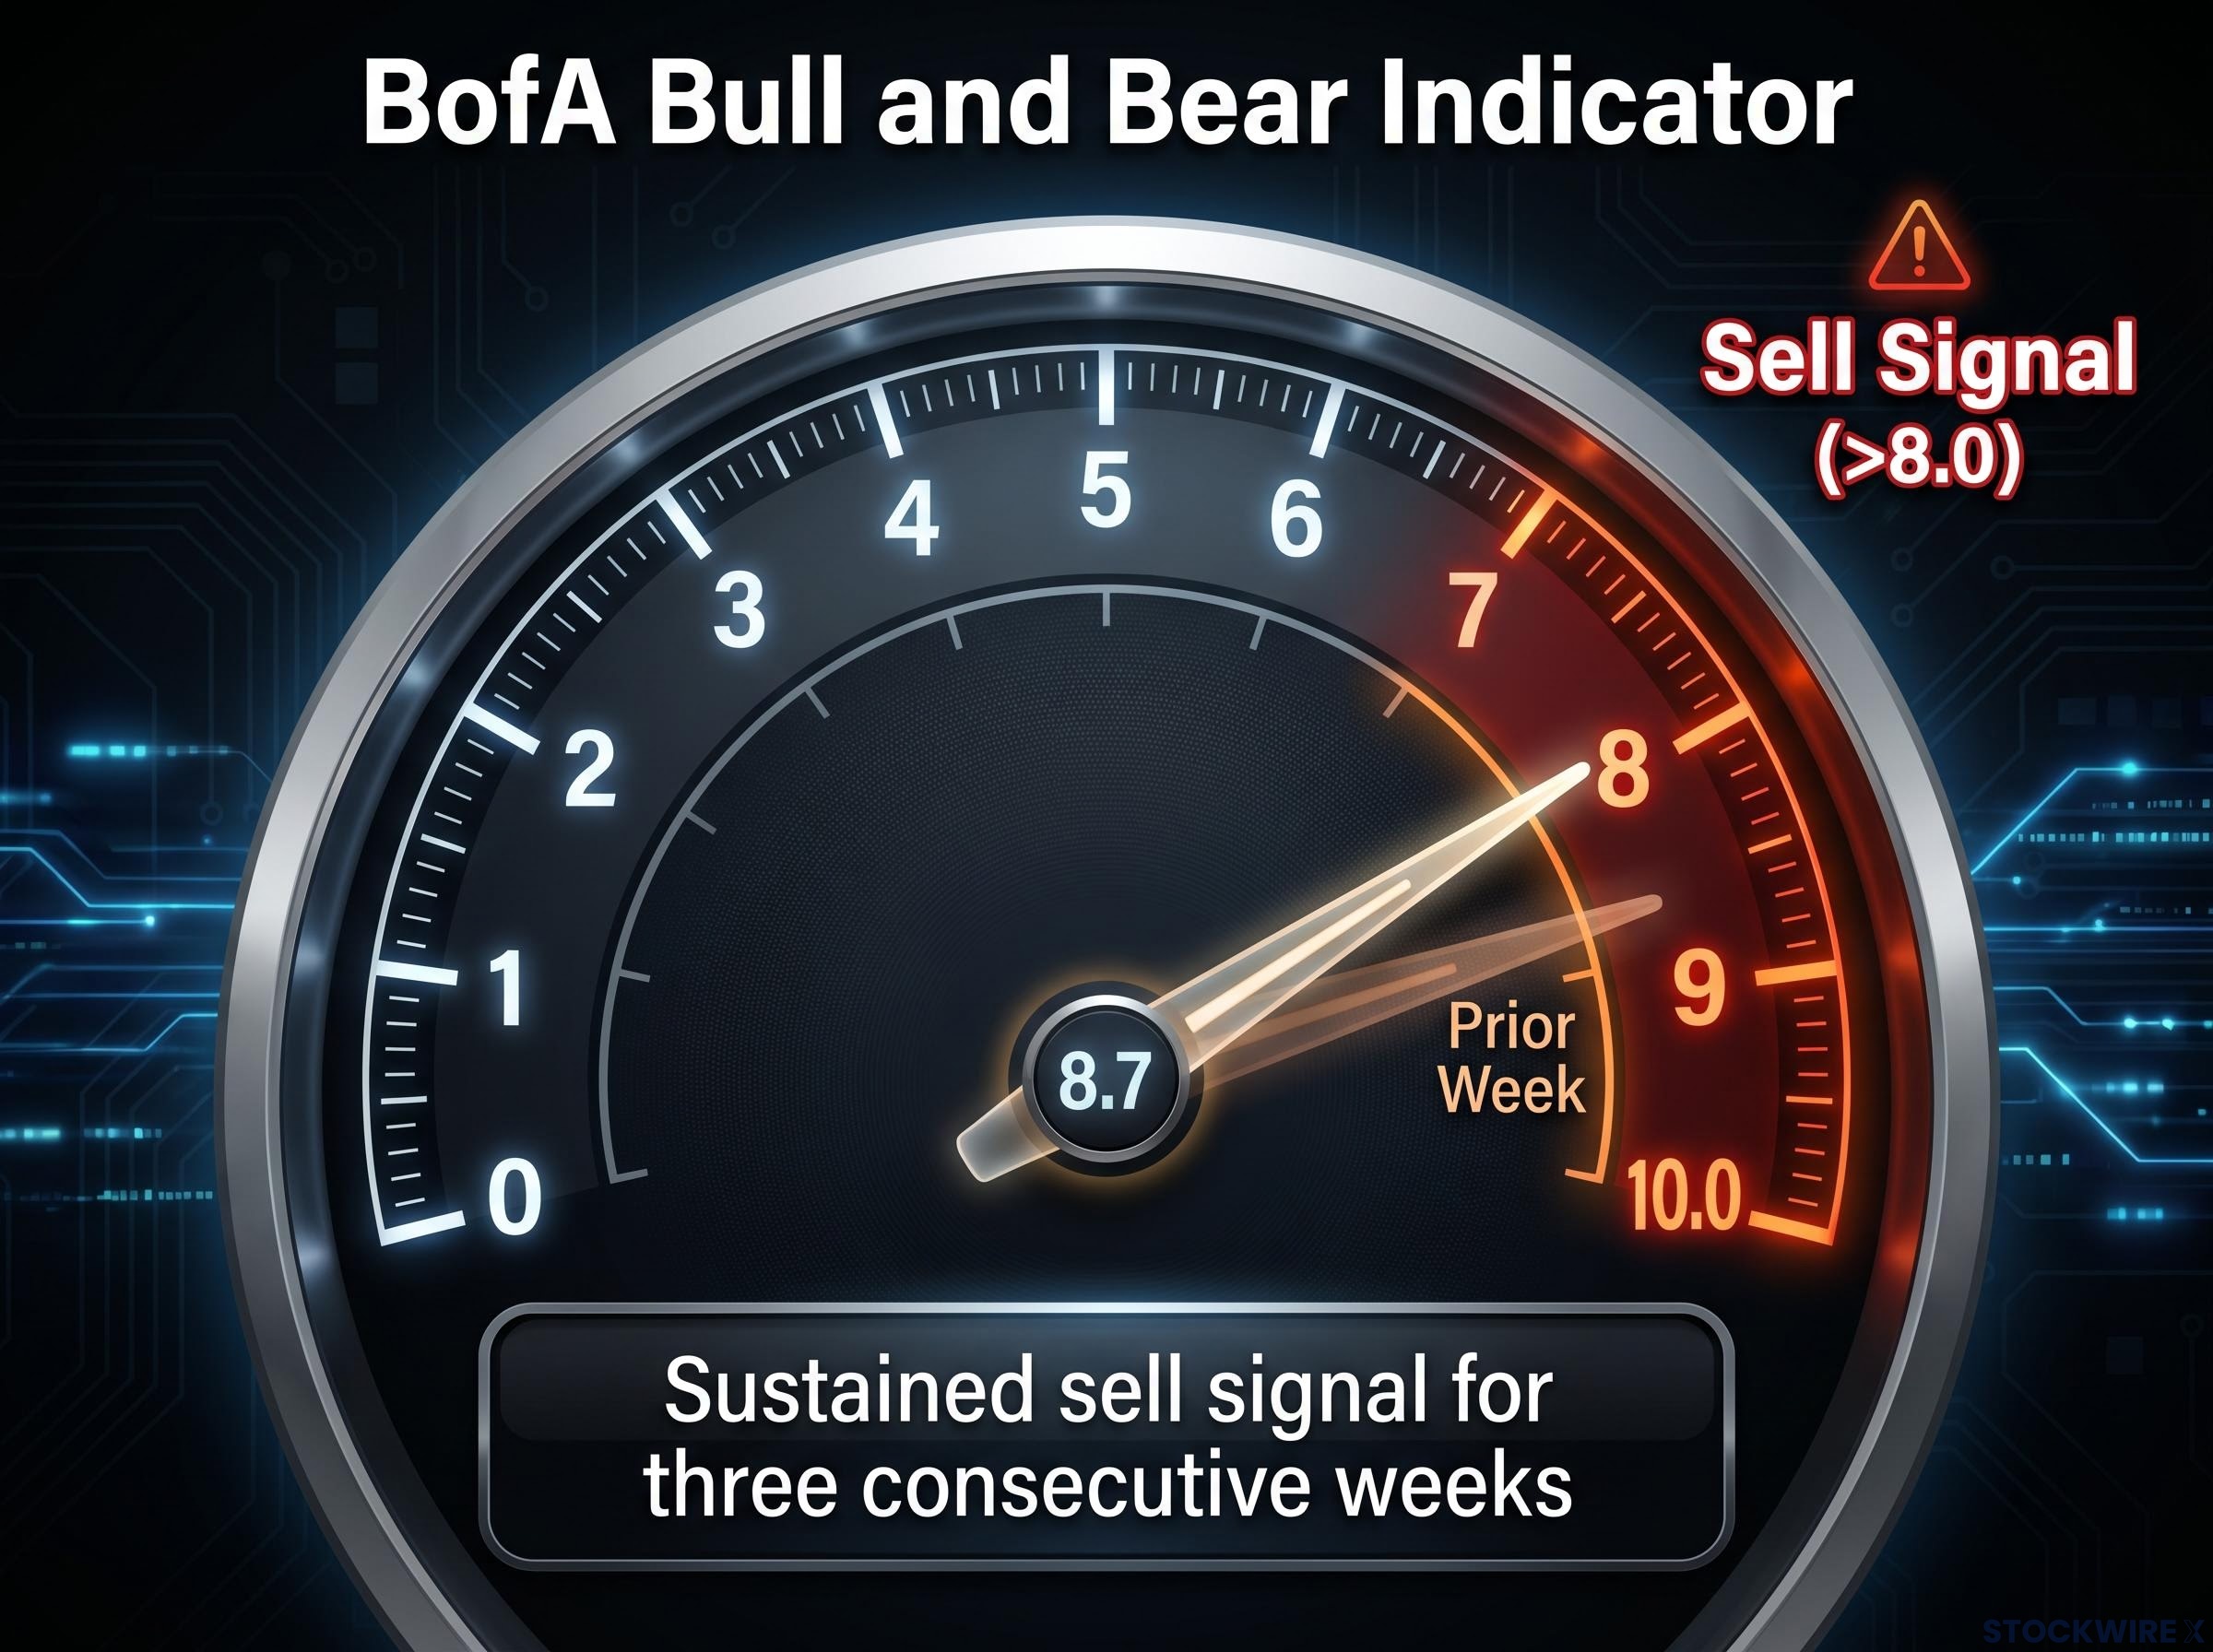
A single week above the threshold is a data point. Three consecutive weeks at sell-signal levels, with the reading still climbing, amplifies the cautionary weight. For investors unfamiliar with contrarian sentiment tools, the instinct may be to read a high number as confirmation that the rally has legs. The indicator’s logic runs in the opposite direction: the higher the reading, the more stretched the consensus, and the greater the historical probability of a near-term pause.
Total equity fund inflows reached $23.1 billion for the week. On the surface, that figure looks healthy. The composition tells a more complicated story.
| Category | Flow Direction | Amount | Context |
|---|---|---|---|
| Total equity funds | Inflow | $23.1 billion | Headline figure |
| US large-cap equity | Inflow | $18.3 billion | Dominant share of total |
| US growth equity | Outflow | $13.1 billion | Largest since December 2025 |
| Consumer sector equity | Outflow | $1.7 billion | Largest since December 2024 |
US large-cap funds captured $18.3 billion, accounting for nearly 80% of the equity total. Capital did not leave stocks entirely; it concentrated in the largest, most liquid names. The growth equity outflow of $13.1 billion, the steepest single-week redemption from that category since December 2025, represents a meaningful fracture in the growth trade. The $1.7 billion consumer sector outflow, the largest since December 2024, arrived alongside Hartnett’s note that Trump’s approval rating on inflation has dropped below Biden-era lows, a macro backdrop that may be eroding confidence in consumer-facing equities specifically.
The rotation within stocks, into large-cap quality and out of growth and consumer exposure, mirrors the bond and cash story: investors are not fleeing risk assets wholesale, but they are repositioning within them toward safety and liquidity.
Gold lost $3.1 billion and cryptocurrency funds shed $2.0 billion in the same week. Both asset classes are often associated with defensive or alternative positioning, so outflows during a week of record bond and cash inflows appear counterintuitive. The most probable interpretation: profit-taking or liquidity generation from positions that have performed well, rather than a genuine shift in risk appetite toward equities.
Hartnett framed the broader context through what he described as a “boom loop,” a self-reinforcing dynamic in US household equity wealth:
US household equity wealth has risen by approximately $6 trillion year-to-date through early June 2026, following gains of roughly $10 trillion in 2025 and $9 trillion in 2024.
Hartnett’s boom loop framework was articulated earlier in 2026 alongside his preferred trade expressions: commodities, semiconductors, consumers, and China, positioning choices that assumed the self-reinforcing wealth cycle would extend before rotating, and that now sit in sharper relief against this week’s defensive shift.
The boom loop explains why the Bull and Bear Indicator can sit at 8.7 while defensive flows simultaneously hit records. The two signals are not contradictory. They are both symptoms of the same stretched cycle: wealth accumulation driving sentiment higher, while the sophistication of positioning at the margins reveals that some investors are quietly building defensive ballast around it.
Taken individually, each data point from this week’s report tells a partial story. Taken together, the composite signal is more coherent than any single figure.
BofA’s contrarian framework suggests that this combination of stretched sentiment and defensive rotation has historically preceded periods of increased volatility or consolidation rather than sharp, immediate reversals. The market is not breaking down; it is showing the internal strain of a cycle that has run long.
A single week of record flows is a data point. Sustained multi-week confirmation would be required to characterise this as a durable defensive rotation rather than a one-week anomaly. Three specific indicators are worth monitoring in coming weekly reports:
The specific macroeconomic or geopolitical catalysts behind this week’s rotation are not documented in the available data. Investors should watch for fundamental developments that may emerge as explanations for the defensive shift, particularly around inflation, trade policy, and Federal Reserve commentary.
For investors weighing whether to replicate the defensive rotation visible in this week’s data, our dedicated guide to crash protection costs examines the measurable opportunity cost of conventional defensive strategies, including how the 60/40 portfolio lagged the S&P 500 by 14 percentage points in 2024 and why the timing window for active defensiveness has compressed with algorithmic trading.
This article is for informational purposes only and should not be considered financial advice. Investors should conduct their own research and consult with financial professionals before making investment decisions.
The week ending 5 June 2026 produced an unusually coherent set of defensive signals: an all-time record $39 billion bond inflow led by investment-grade debt, a $122 billion cash surge, the largest growth equity redemption since December 2025, and a third consecutive sell signal from BofA’s Bull and Bear Indicator at 8.7. These are not contradictory readings. They describe a market where headline equity wealth remains elevated but where the positioning underneath is shifting toward caution with conviction.
One week’s fund flow data is never a definitive market forecast, and the absence of third-party corroboration for some figures means these numbers should be treated as directional rather than conclusive. Investors monitoring near-term risk appetite now have a specific baseline against which subsequent weekly flow reports can be measured. When next week’s data arrives, the watchpoints are clear: indicator trajectory, growth equity flows, and cash positioning. The signals from this week set the benchmark.
BofA's Bull and Bear Indicator aggregates positioning, sentiment, and fund flow data into a single score ranging from 0 to 10, functioning as a contrarian tool that warns when bullish consensus has become overly crowded. Readings above 8.0 have historically preceded average global equity declines of 2-3% within three months, not because they predict a crash, but because stretched positioning leaves fewer marginal buyers to push prices higher.
The record $39 billion weekly bond inflow, with over half directed into investment-grade debt, signals a deliberate quality-driven defensive move rather than a broad reach for yield. The concentration in investment-grade securities suggests capital is prioritising creditworthy issuers and predictable income over riskier fixed-income categories.
The $122 billion cash inflow reflects a wait-and-see posture at institutional scale, preserving maximum liquidity and optionality to re-enter risk assets quickly if conditions change. At that magnitude, the positioning likely reflects institutional-level decision-making, tilting the overall defensive balance heavily toward flexibility rather than income generation alone.
Total equity inflows of $23.1 billion looked healthy on the surface, but nearly 80% concentrated in US large-cap funds while growth equity suffered its largest outflow since December 2025 at $13.1 billion and consumer sector equities saw their biggest redemption since December 2024. The internal rotation into quality large-caps and away from growth and consumer exposure mirrors the broader defensive shift visible in bond and cash flows.
Investors should track fund flow data across multiple consecutive weeks rather than treating a single week as a definitive signal, watching specifically for the trajectory of the Bull and Bear Indicator, whether growth equity outflows persist beyond one week, and whether cash inflows sustain at elevated levels. Sustained multi-week confirmation across all three of these metrics would indicate a durable defensive rotation rather than a temporary anomaly.


