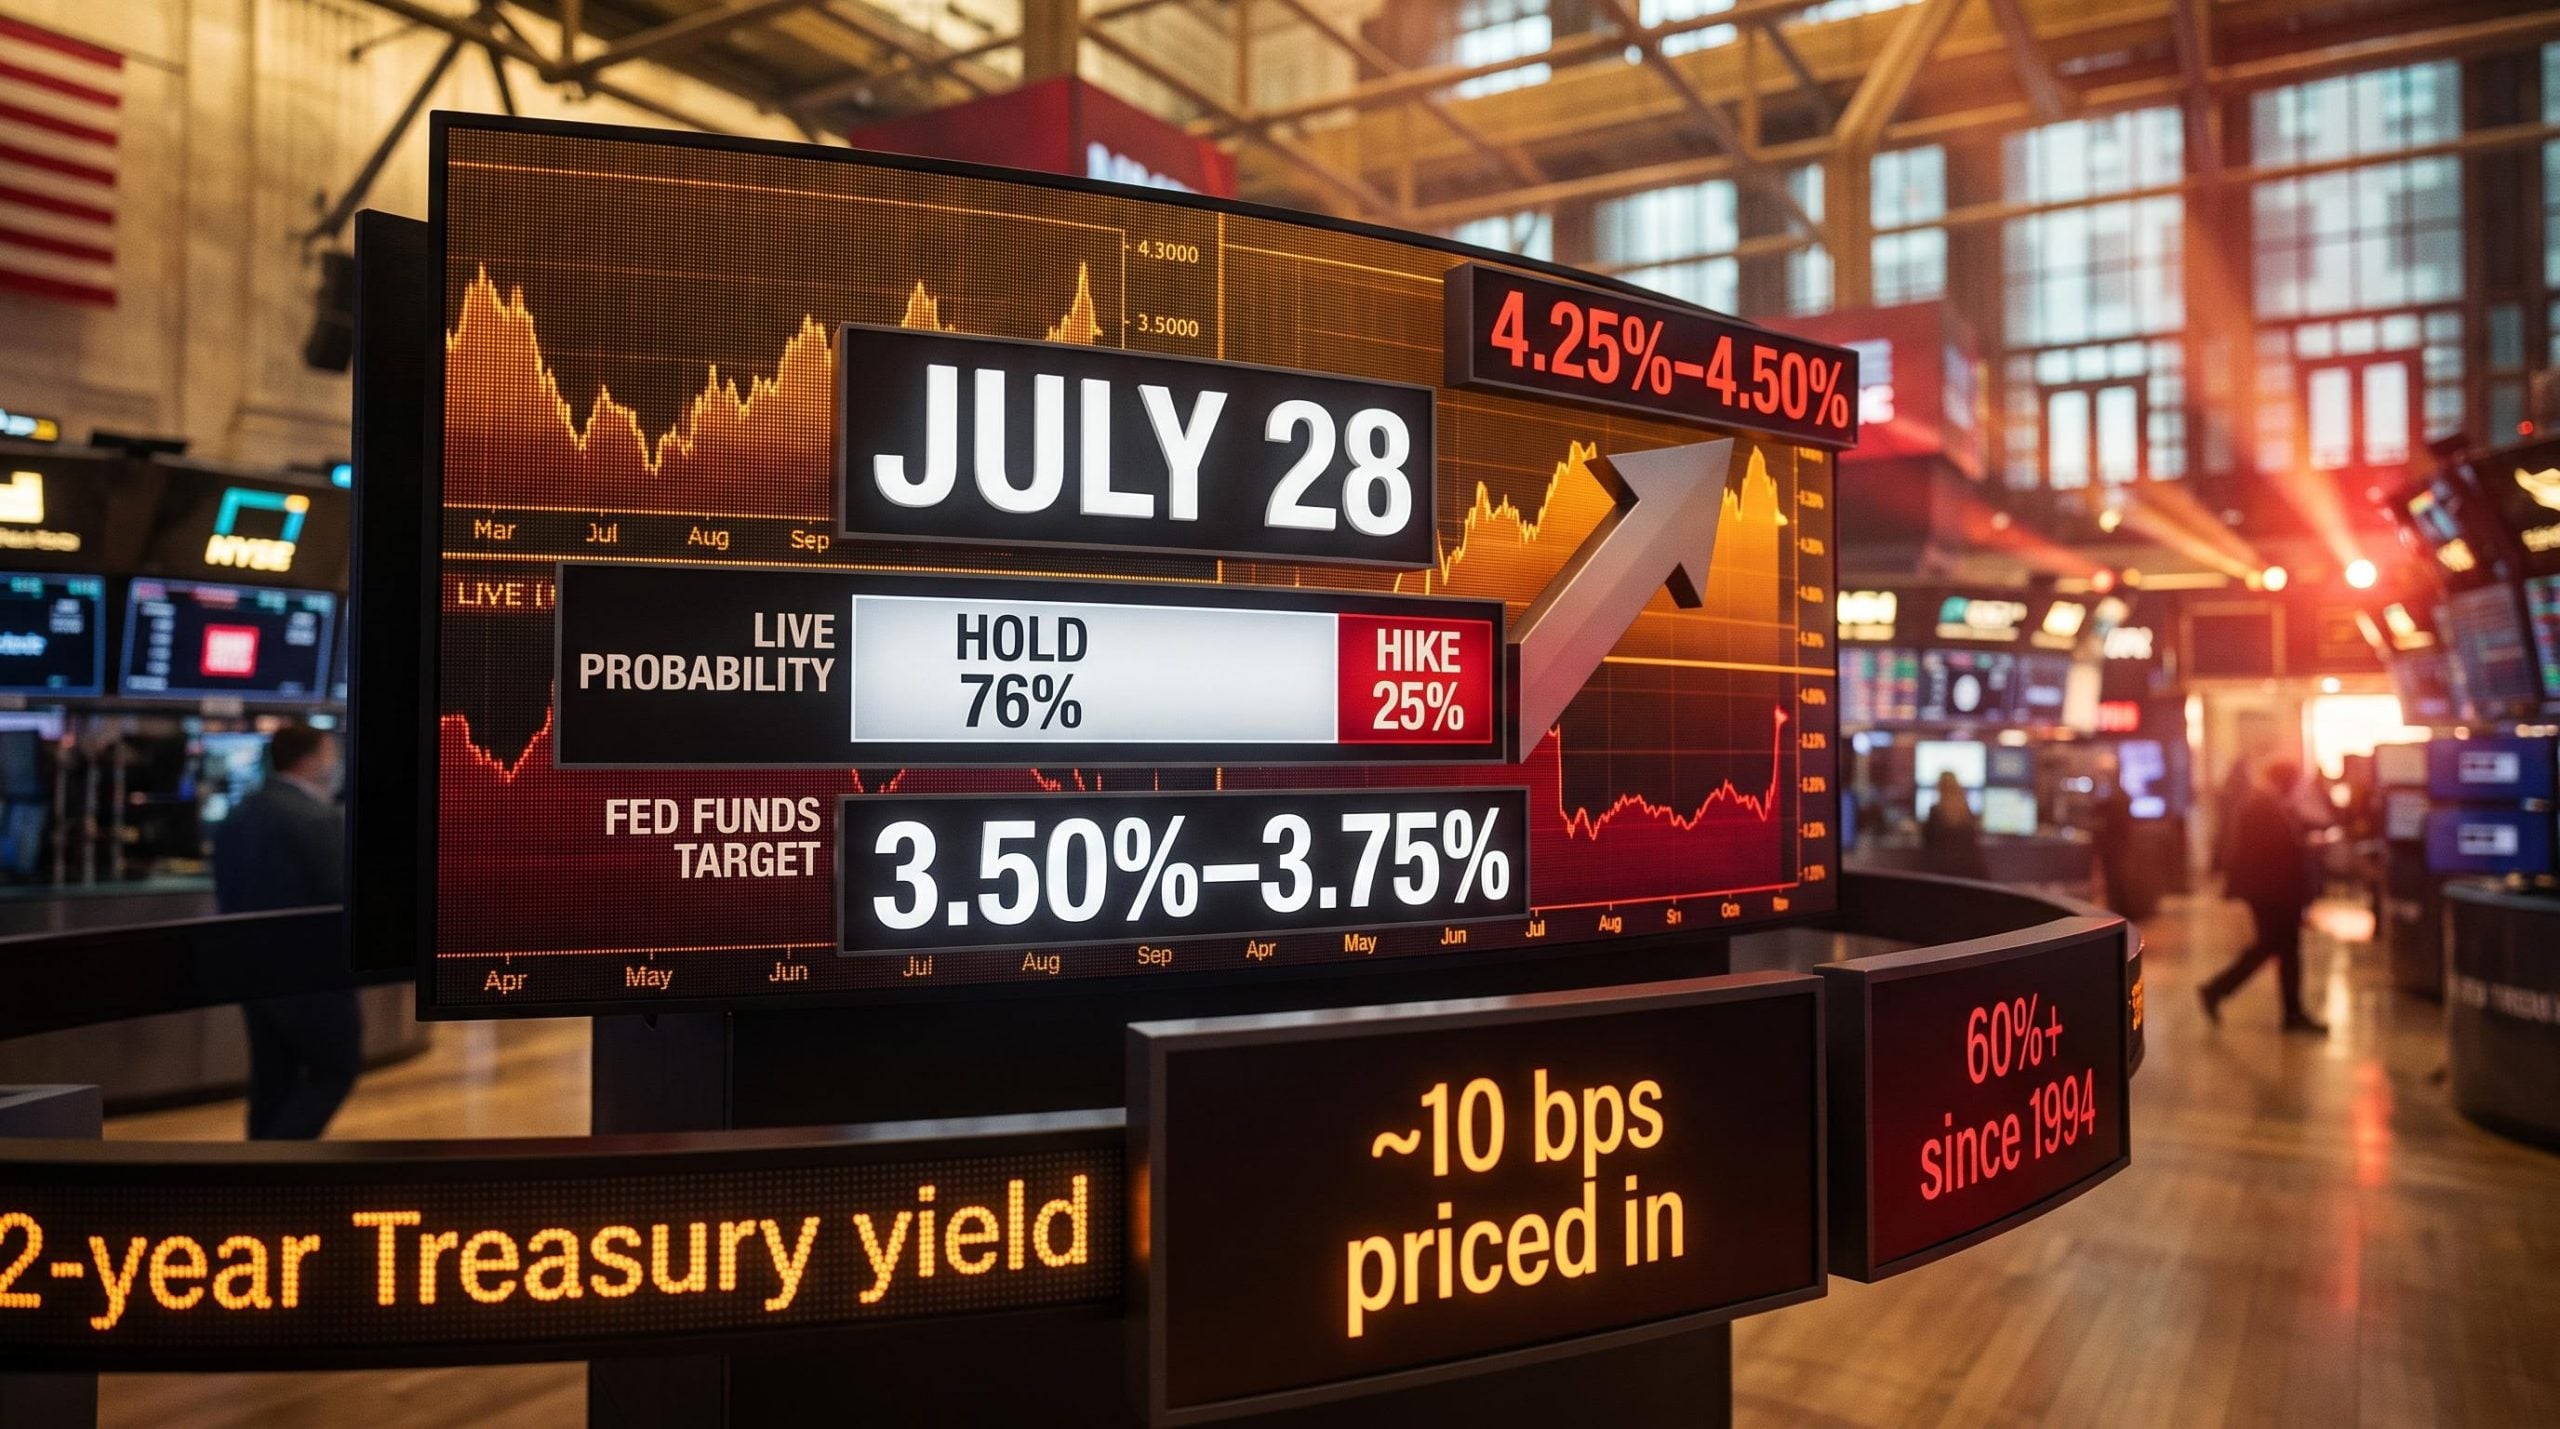
A stock yielding 11% sounds like an income investor’s dream. More often, it is a warning sign dressed up as an opportunity. Australian investors are among the most yield-focused in the world, drawn by a franking-credit system that makes dividend income uniquely attractive and an ASX dominated by high-payout banks, miners and property trusts. That same structure creates fertile conditions for dividend traps, where a rising yield figure signals deteriorating fundamentals rather than improving income prospects. This guide explains exactly how these traps form, why Australia’s market is particularly susceptible, how ETF distributions can mislead even experienced investors, and what practical checks to run before committing capital to any high-yield position.
How a rising yield can signal falling value, not rising income
Yield is a simple calculation: annual distributions divided by the current share or unit price. That simplicity is the source of the problem.
When a company’s share price falls, the yield figure rises automatically, even if the payout has not changed by a single cent. The headline number looks more generous, but nothing about the income has actually improved. The business may be deteriorating, and the market is repricing it accordingly.
Consider how this works in practice:
| Scenario | Share price | Annual dividend | Yield |
|---|---|---|---|
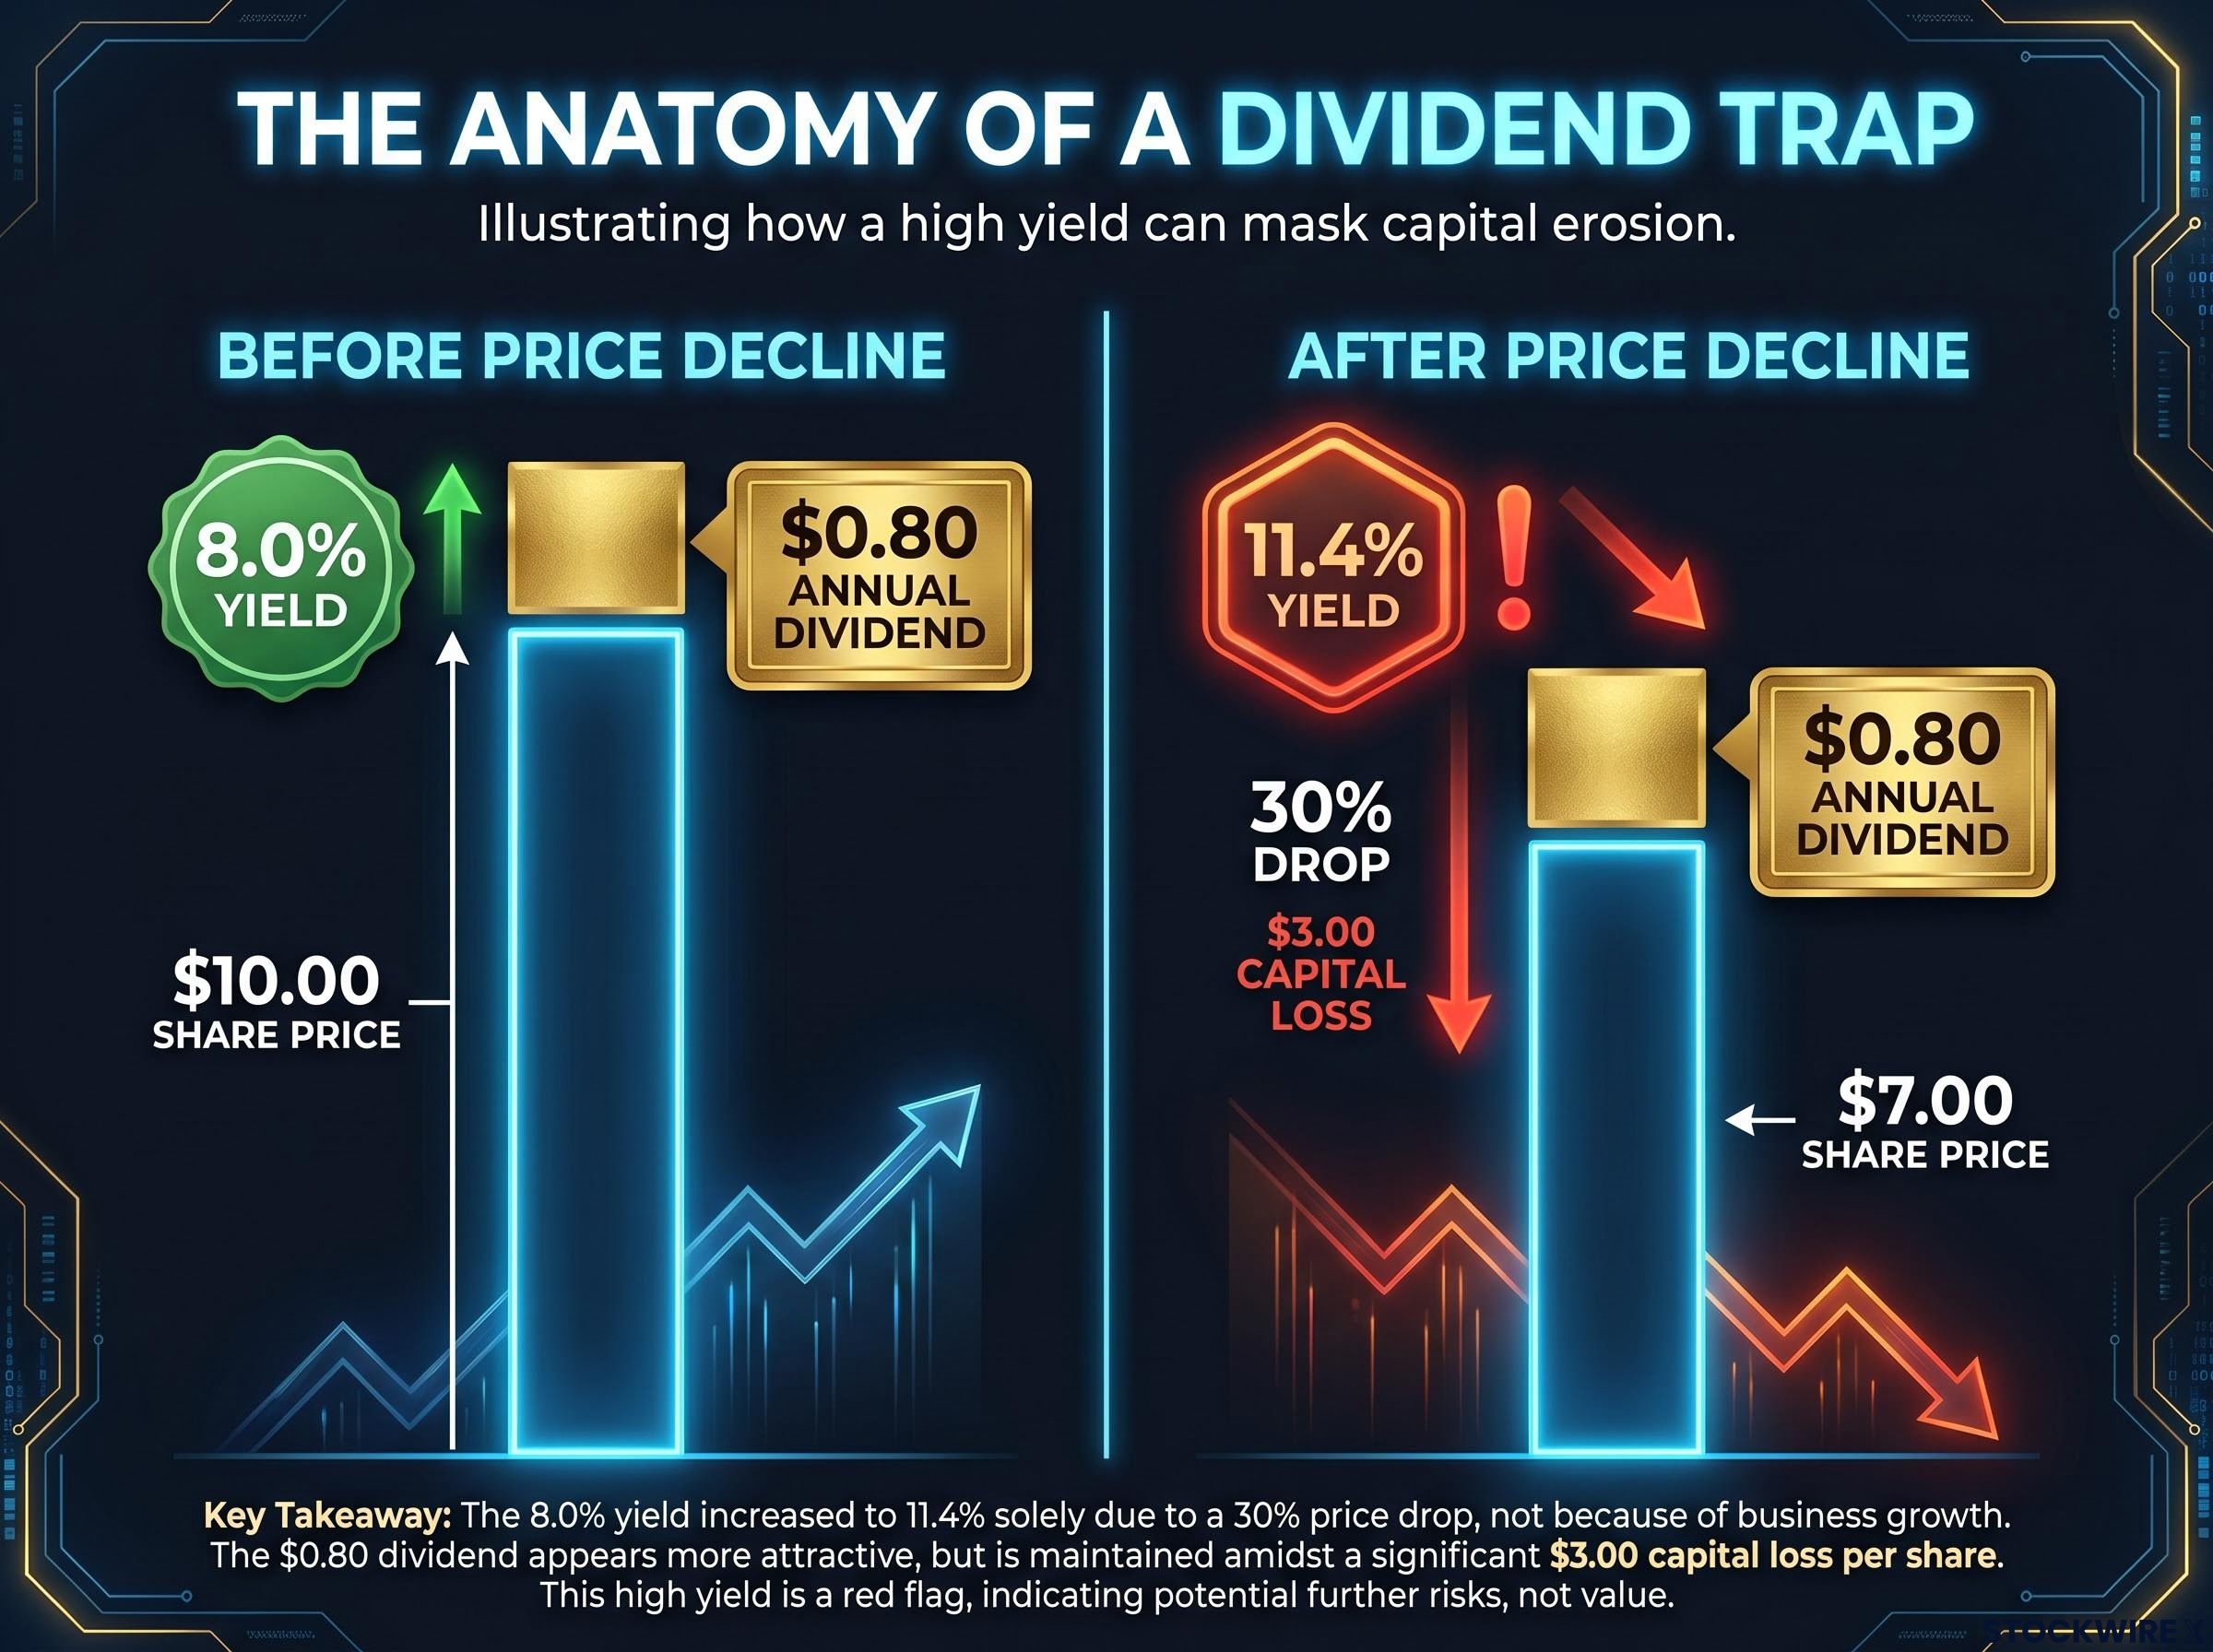
| Before price decline | $10.00 | $0.80 | 8.0% |
| After price decline | $7.00 | $0.80 | 11.4% |
The payout is identical. The yield has jumped from 8% to 11.4%, entirely because the share price fell 30%. An investor who bought at $10 and held through the decline collected $0.80 in income but lost $3.00 in capital. Stocks yielding in the 10-12% range frequently carry exactly this profile.
Ex-dividend price mechanics provide the theoretical foundation for why yield and wealth are not the same concept: on the date a stock trades without entitlement to a declared dividend, its market price typically falls by approximately the amount of that payment, leaving total investor wealth unchanged before tax.
A yield rising because of a falling share price is a warning sign, not an income opportunity. Total return, which combines income and capital movement, is the only honest measure of what a position has delivered.
When big ASX news breaks, our subscribers know first
Why Australian investors face this risk more than most
The ASX is one of the highest-yielding developed equity markets in the world, and that is not an accident. The index is structurally weighted toward sectors that pay large portions of their earnings as dividends:
- Banks and financials, which dominate the top end of the ASX 200
- Miners and resources companies, whose earnings are cyclical but whose payout culture is generous
- REITs and property trusts, which are required to distribute most of their income
- Franking-credit incentives, which make every dollar of fully franked dividend worth more in the hands of Australian taxpayers
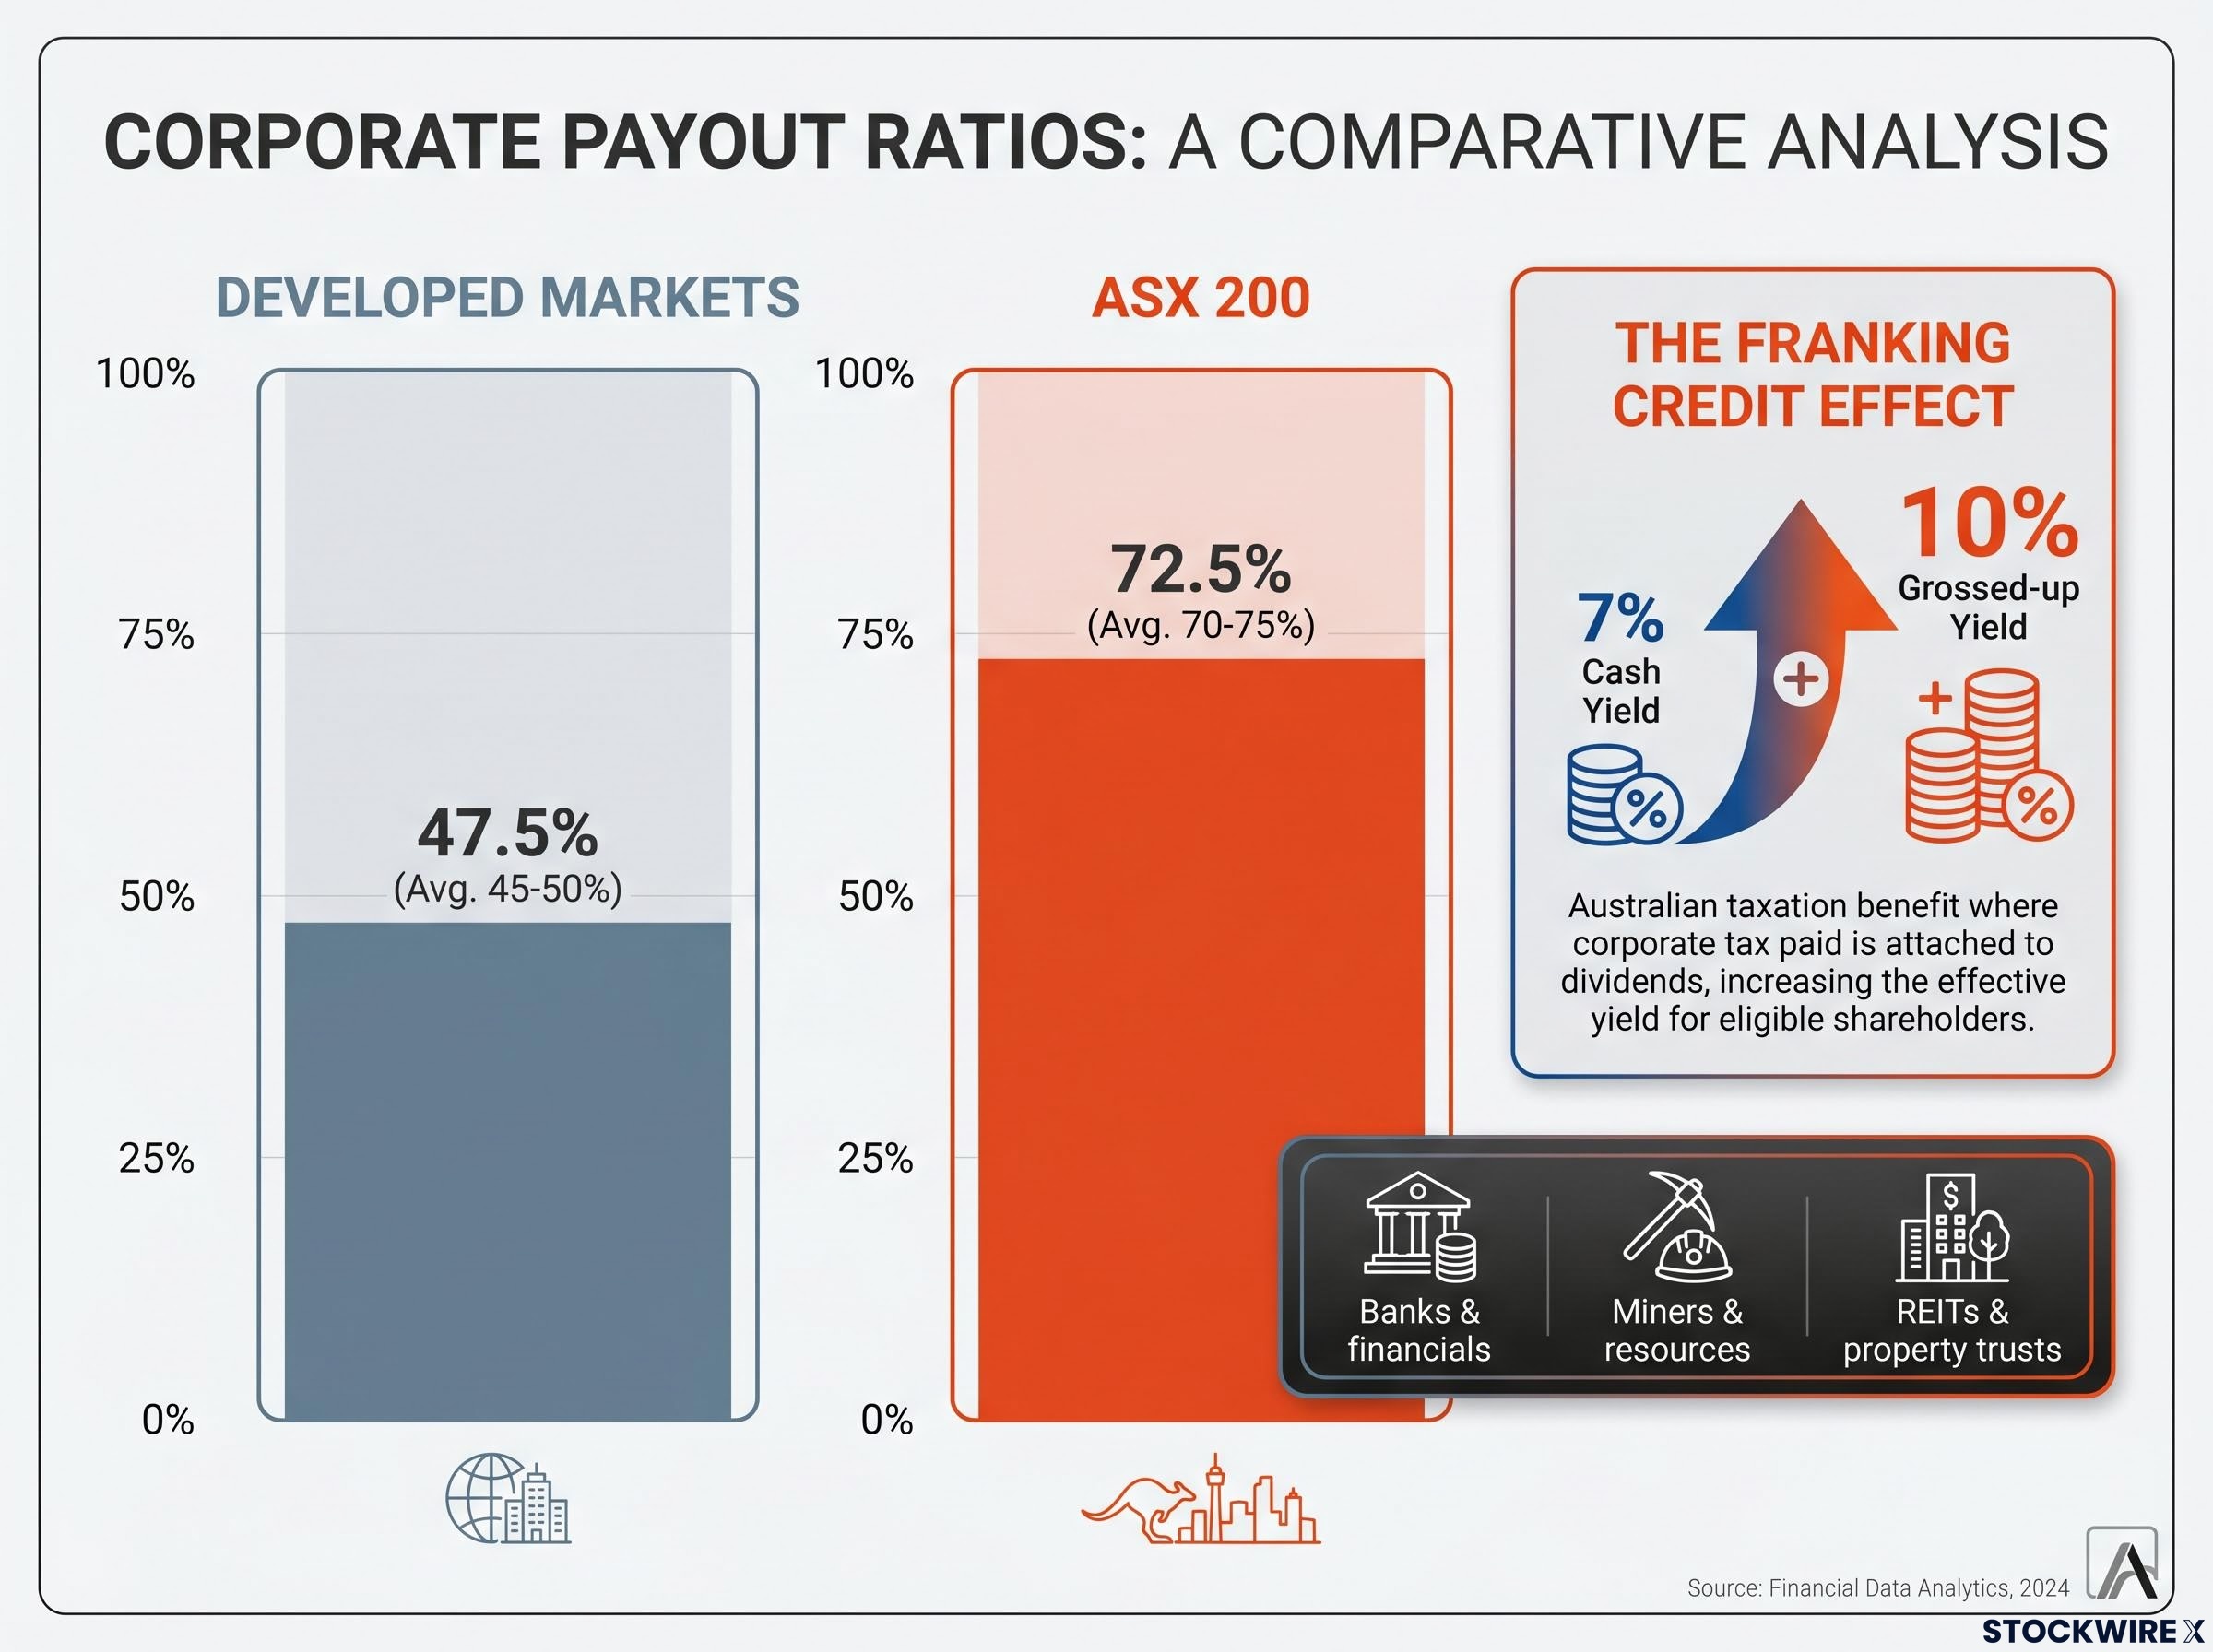
Aggregate payout ratios across the ASX 200 sit at approximately 70-75% of earnings, compared with developed-market benchmarks closer to 45-50%. That gap means Australian companies retain less capital as a buffer when earnings disappoint. The margin for error is narrower by design.
The COVID dividend cycle demonstrated exactly how quickly that buffer can evaporate. Major bank yields looked attractive heading into 2020. Within months, dividends were cut sharply as the banks braced for credit losses. They later recovered, but investors who had bought for income at pre-COVID yields experienced precisely the trap described above: the yield looked safe right until it was not.
When franking credits encourage the wrong questions
Franking credits are real and valuable. For Australian taxpayers, particularly retirees and self-managed super funds, a fully franked dividend is worth materially more after tax than an unfranked one.
The risk is that franking shifts the analytical focus from sustainability to gross yield. A stock paying a 7% cash yield might gross up to roughly 10% with franking credits. That 10% figure looks compelling. But franking does not protect against a dividend cut if the underlying business cannot cover the payout from earnings. The credits are only valuable if the dividend continues to be paid.
The grossed-up yield figure that often drives buying decisions is derived from franking credit calculations that vary materially by investor type: a retiree with no other income, an SMSF in pension phase, and a high-income professional can face three entirely different effective returns on the identical cash dividend.
Financial commentary through 2024 specifically identified franking as a factor that can encourage complacency among Australian income investors, leading some to hold positions longer than the fundamentals warrant because the grossed-up yield obscures weakening earnings coverage.
When ETF distribution figures obscure more than they reveal
Individual stock yields are at least straightforward to interrogate. ETF distribution yields introduce a layer of complexity that catches even experienced investors.
The distortion follows a three-step sequence:
- An ETF’s underlying index rebalances, adding and removing constituent stocks
- The fund realises capital gains on positions sold during the rebalance
- Those gains are distributed to unitholders as part of the annual or semi-annual payout, inflating that period’s distribution yield
The industry-standard metric, the 12-month trailing distribution yield, is calculated by summing the last 12 months of per-unit distributions and dividing by the current price or net asset value. When one of those 12 months includes a large capital-gains distribution from rebalancing, the trailing yield spikes.
Some Australian equity ETFs have reported distribution yields in the 8-9% range near financial year-end, partly reflecting embedded capital gains rather than sustainable, repeatable income. That figure fades once the spike rolls out of the 12-month window.
ETF providers are transparent about this, for investors who read the disclosures:
Betashares explicitly warns that trailing yield can be temporarily inflated by a capital-gains distribution following a major index rebalance and that investors should not assume such yields will recur. The SPDR S&P/ASX 200 Fund (STW) PDS states that past distributions are not a reliable indicator of future distributions.
ASIC’s Regulatory Guide RG 234 reinforces that headline yield figures in financial product advertising must be balanced, explain assumptions, and avoid creating misleading impressions.
ASIC’s Regulatory Guide RG 234 sets out that headline yield figures in financial product advertising must be balanced, explain their underlying assumptions, and avoid creating misleading impressions about the income a product is likely to generate.
What to look for in an ETF fact sheet and index methodology
The distribution history section of an ETF fact sheet is the first place to check. Look for lumpy, one-off spikes in the per-unit distribution that suggest a capital-gains event rather than a steady income stream.
Index methodology documents, generally available on the provider or index provider website, explain rebalancing frequency and criteria. A fund that rebalances quarterly in a concentrated index may generate more frequent capital-gains distributions than one tracking a broad, stable benchmark.
It is also worth checking whether the ETF specifically targets income (such as dividend-focused or yield-weighted strategies) or simply passes through all distributions from its underlying index. These two structures produce very different income reliability profiles, and the distinction is not always obvious from the fund name alone.
The performance divergence across ASX dividend ETFs in the year to March 2026, where total returns ranged from a gain of 26.7% to a loss of 4.0% across funds with superficially similar mandates, illustrates precisely why index methodology and total return context matter more than any single distribution yield figure.
How sector concentration compounds the damage of yield-chasing
A single dividend trap is a portfolio setback. A portfolio full of them is a structural problem.
Sorting a universe of stocks or ETFs by headline yield and concentrating capital in the top results tends to produce heavy sector skews. The names that rise to the top are overwhelmingly drawn from the same corners of the market:
- Banks and financials
- Miners and resources
- REITs and property trusts
- Utilities
These sectors share a common vulnerability: they are disproportionately exposed to interest rate movements, credit cycles and commodity price swings. A single macro shift, such as a rate increase or a commodity price correction, can impair income across the entire portfolio at once.
An investor holding five high-yielding names spread across banks, a miner and two REITs may believe the portfolio is diversified. In practice, all five positions are responding to the same forces. According to Plato Investment Management, systematic yield-chasing strategies can run into value traps, and the firm has advocated for quantitative screens covering earnings downgrades, balance-sheet risk and dividend-cut probability rather than simply ranking by trailing yield.
The capital required for dividend income sufficient to fund retirement spending in Australia is substantially higher than many investors assume: at a 5.5% grossed-up yield, generating $50,000 per year requires approximately $910,000 in invested capital, a figure that highlights how dividend cuts from concentrated sector exposure can force portfolio restructuring at exactly the wrong moment.
| Dimension | Yield-only approach | Total-return approach |
|---|---|---|
| Selection criteria | Highest trailing yield | Yield, growth, diversification, risk |
| Typical sector exposure | Concentrated in financials, resources, REITs | Broader across sectors and geographies |
| Key risk | Correlated dividend cuts in a downturn | Lower single-factor concentration |
Six checks that separate sustainable income from a yield illusion
No single metric confirms whether a high yield is sustainable. Running through a structured set of questions before committing capital builds a clearer picture than relying on any one figure.
- Is the payout ratio comfortably covered by earnings across the last three years? The ASX 200 average sits around 70-75%, so anything materially above that warrants closer scrutiny, particularly if earnings have been volatile.
- Does the business generate sufficient free cash flow to sustain distributions without borrowing or selling assets? A dividend funded by debt or asset disposals is not income; it is a drawdown on the balance sheet.
- Has the dividend been maintained, grown, or cut over the past five years? A history of cuts or erratic payments across different market conditions signals structural instability in the payout.
- Does earnings per share reliably cover the dividend across cycles? Businesses with highly cyclical earnings, such as miners or airlines, may report strong coverage in a boom year that disappears when conditions normalise.
- Is the balance sheet strong enough to support the payout at higher interest rates? Elevated debt levels and thin interest coverage ratios increase the risk that servicing costs crowd out distributions.
- For ETFs, does the distribution history show lumpy, rebalancing-driven spikes? If trailing yield includes a large non-recurring capital-gains component, the sustainable income run-rate is lower than the headline figure suggests.
No single check is definitive. A stock may pass five and fail one, or present ambiguous signals across several. The value lies in running all six before acting.
Yield is one component of total return, not a standalone objective. Assessing the sustainability of income alongside capital risk and diversification produces better outcomes than optimising for the highest headline number.
This article is for informational purposes only and should not be considered financial advice. Investors should conduct their own research and consult with financial professionals before making investment decisions.
High yield is data, not a decision
A rising yield figure is a mathematical output, not an endorsement. It reflects both the income a company or fund distributes and the price the market assigns to it. When the price is falling, the yield rises whether the business is thriving or deteriorating. The number alone cannot tell the investor which scenario is unfolding.
The tools for making that distinction are accessible. Fact sheets, index methodology documents, payout ratio data and five-year dividend histories are publicly available for every listed stock and ETF on the ASX. Australia’s franking-credit system genuinely rewards income investors who do their homework, but it penalises those who chase yield without checking its foundations.
Income investing remains a legitimate strategy in the Australian market. It works best when yield is treated as a starting question rather than a final answer, and when every high number triggers the six checks above before it triggers a buy order.