Why European Equities Are 9% Behind, and What Could Close the Gap
16 mins ago


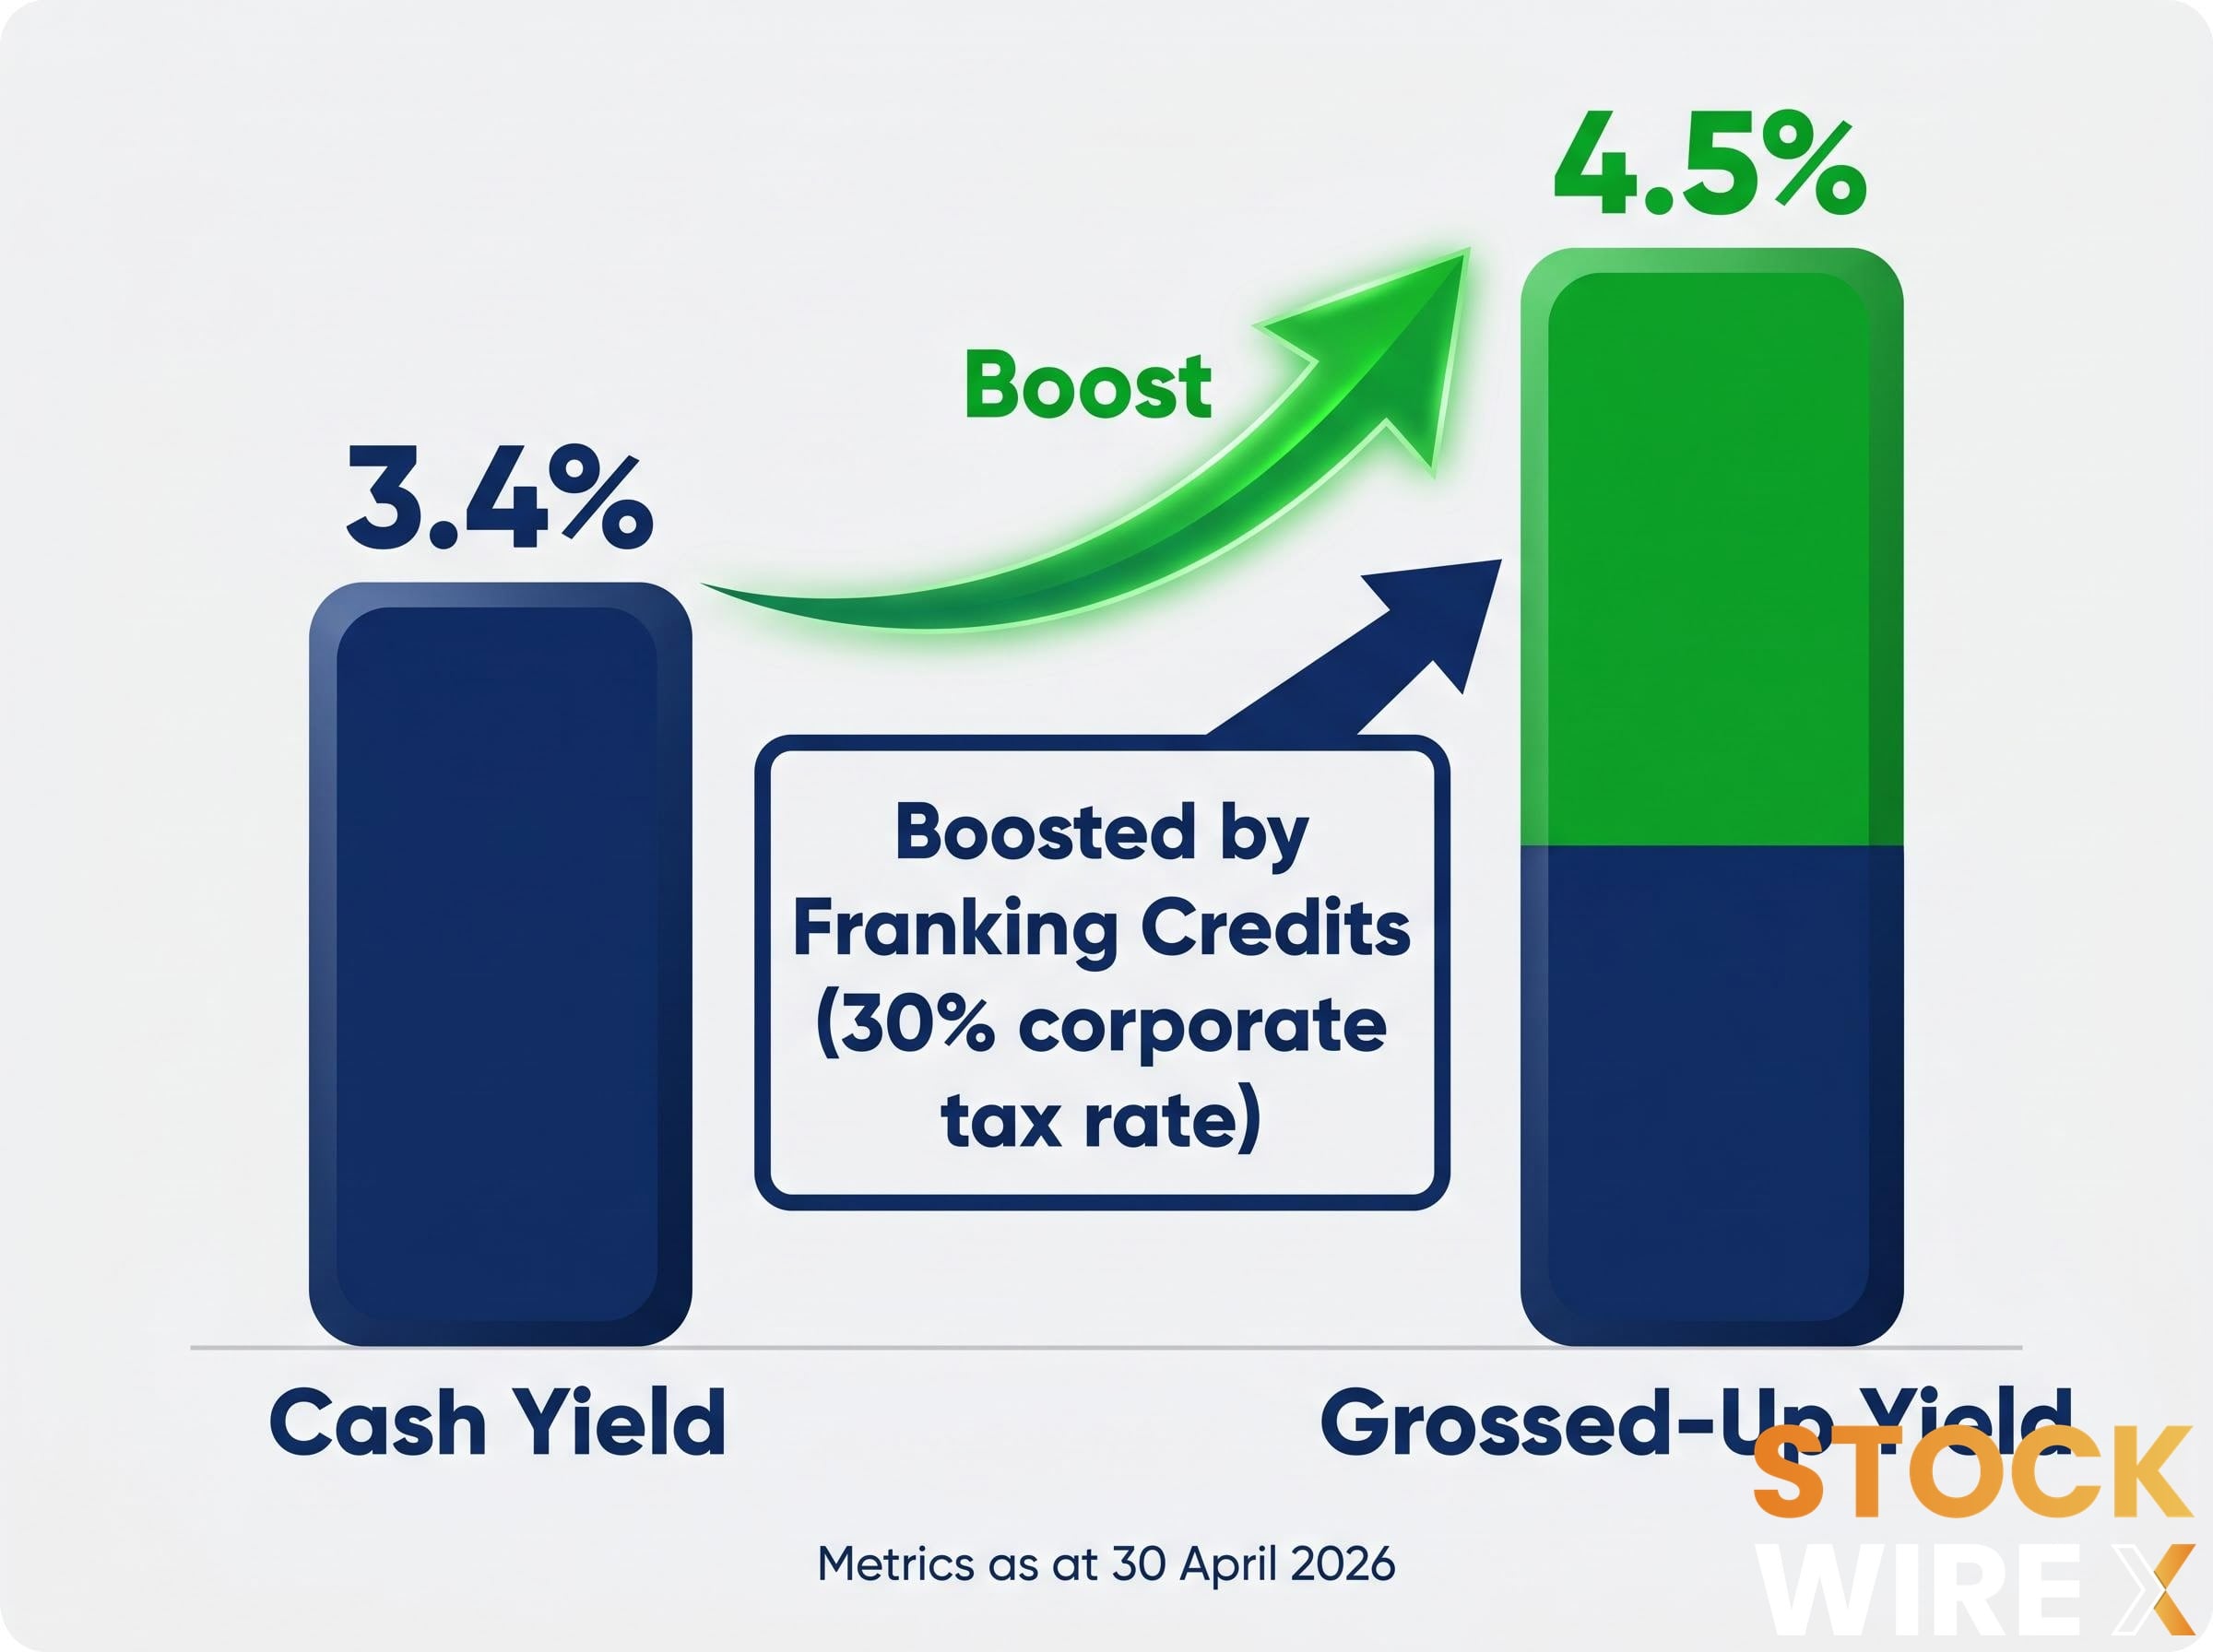
The headline cash yield on the A200 ETF is 3.4%. The number Australian taxpayers should actually be evaluating is 4.5%. That gap, worth more than a full percentage point, is not a rounding error. It is the franking credit system doing exactly what it was designed to do: returning prepaid corporate tax to shareholders who can use it. With net assets now above $9.61 billion and quarterly distributions arriving in January, April, July, and October, A200 has become a default holding for income-focused Australian investors. But the income story is inseparable from the portfolio composition story, and most coverage of A200 treats these as separate conversations. What follows examines what A200 investors actually own, how franking credits amplify effective yield beyond the headline figure, and what the fund’s concentration in financials and materials means when the macro environment turns.
A200 tracks the S&P/ASX 200 index, giving investors exposure to the 200 largest companies listed on the Australian Securities Exchange. The fund’s character, however, is defined by a handful of names and two sectors.
Major holdings include:
These names sit at the centre of a portfolio that concentrates heavily in financials and materials, with limited healthcare representation.
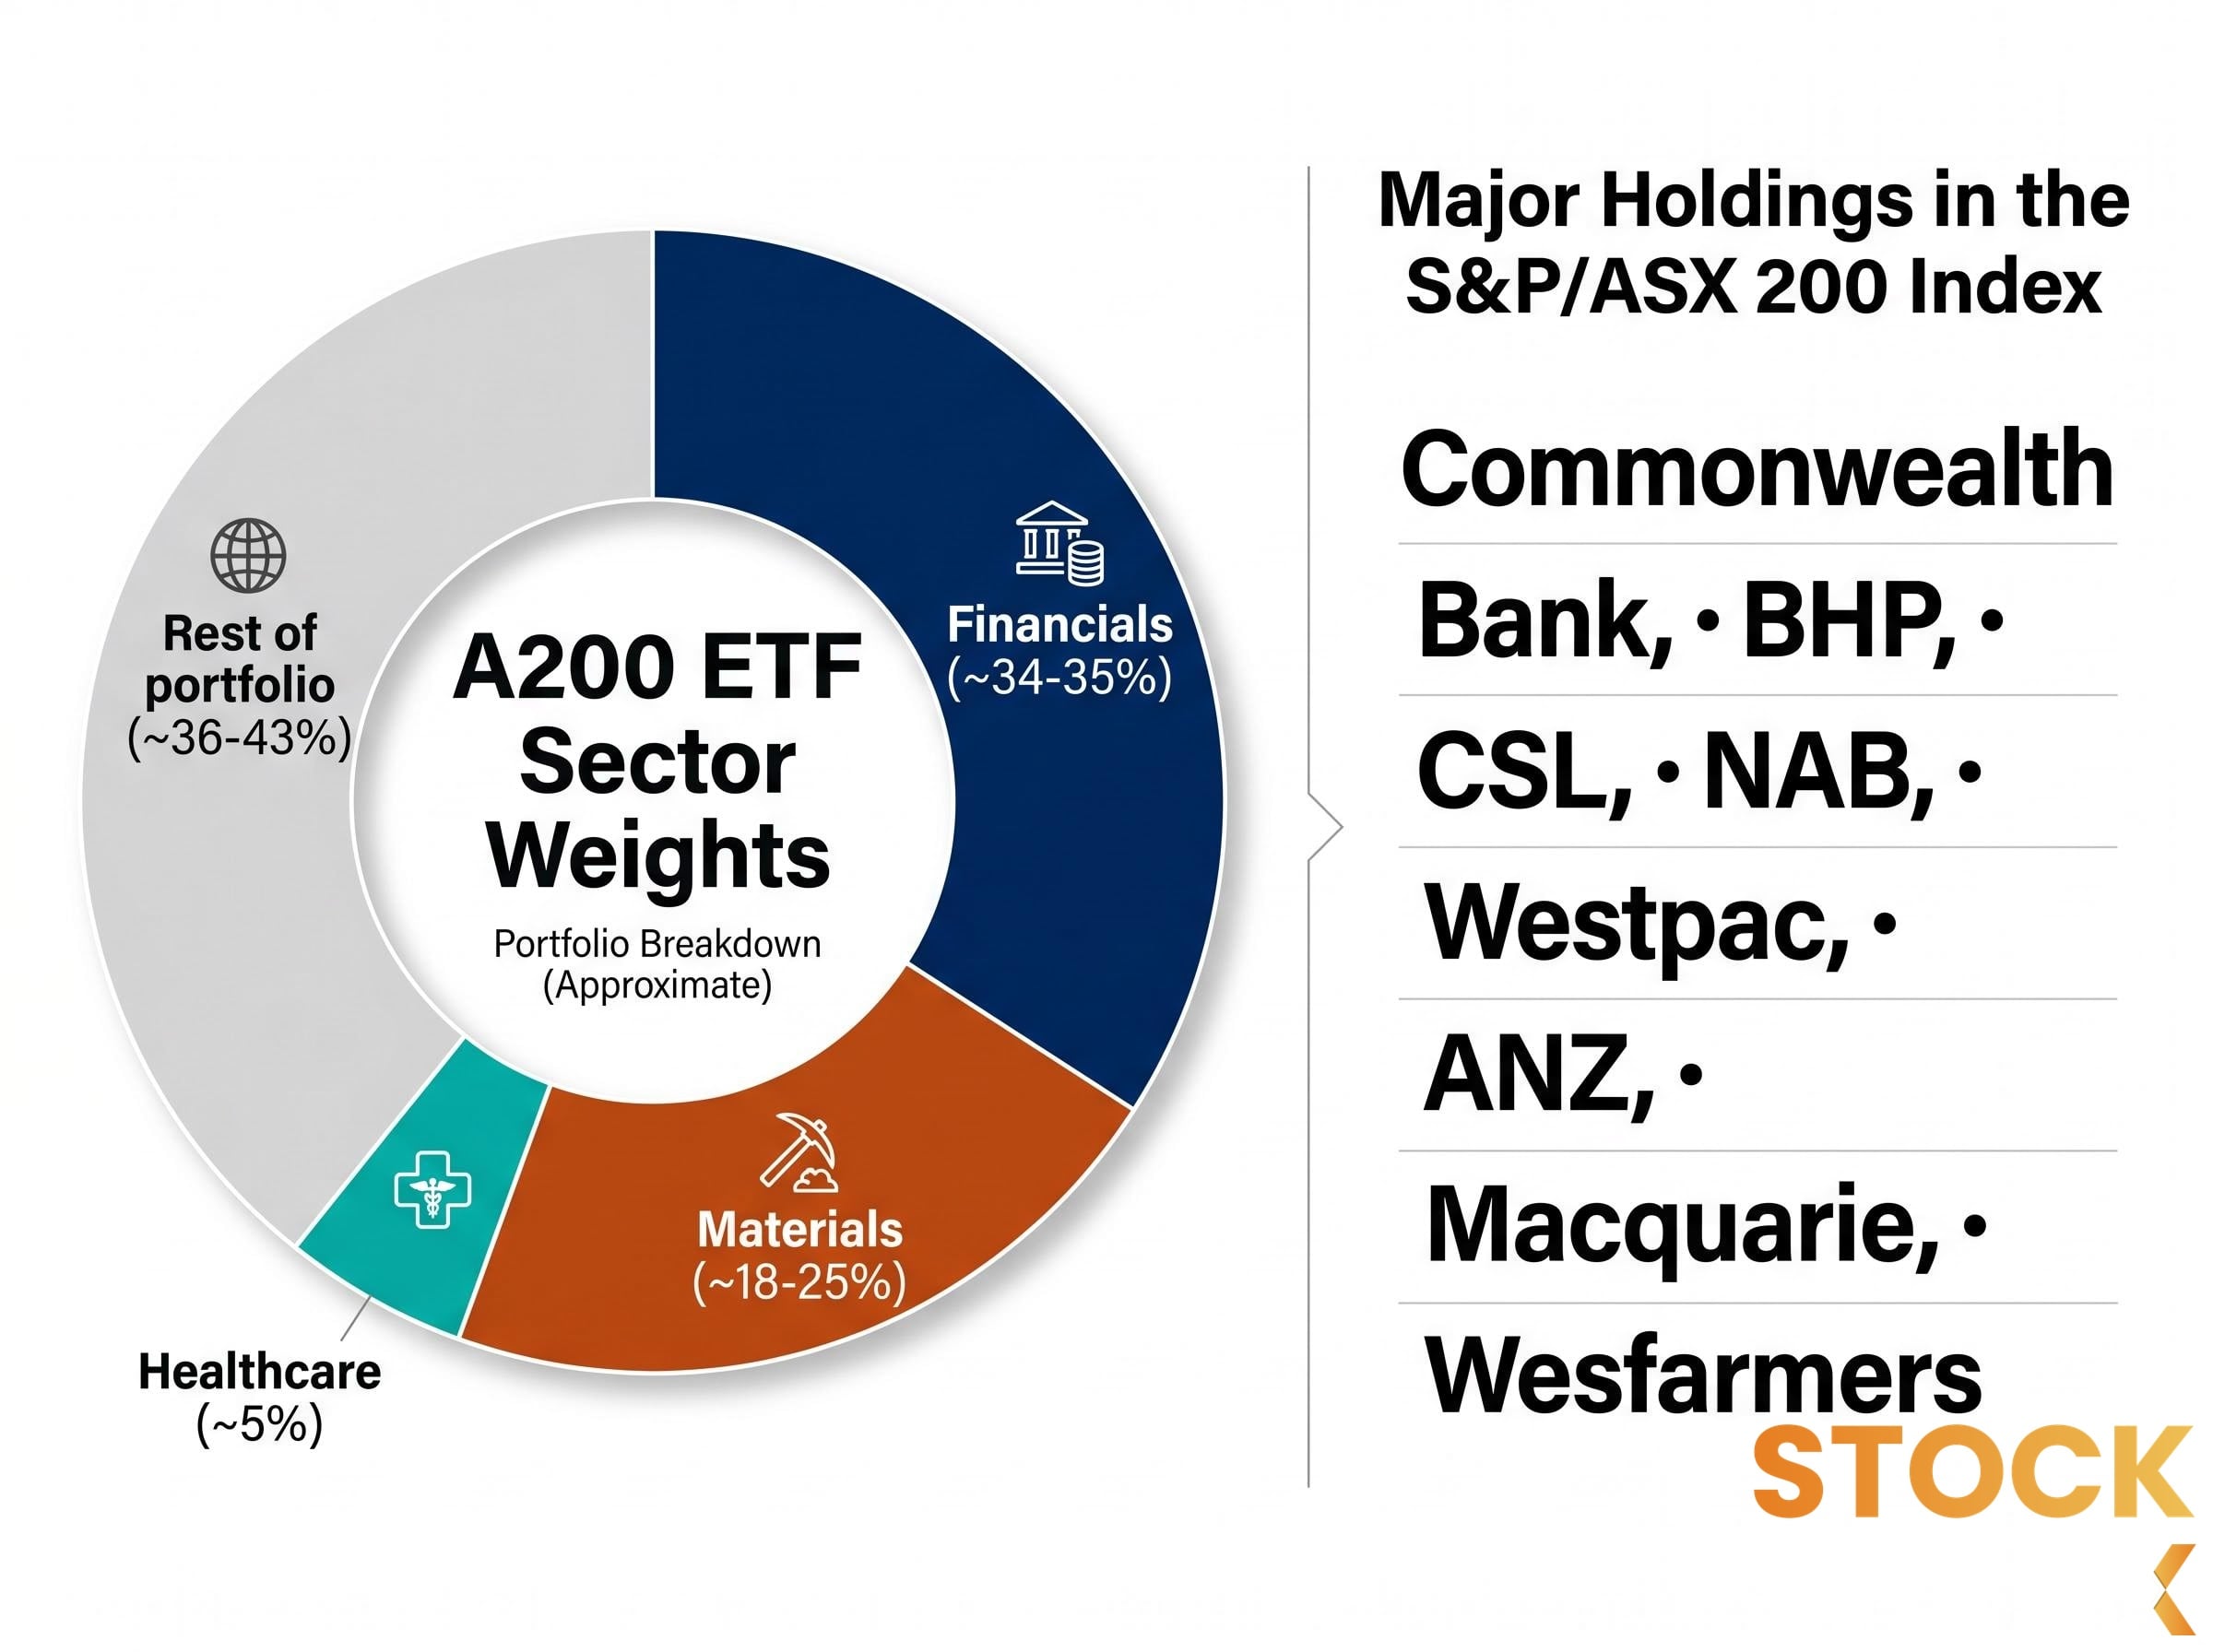
| Sector | Approximate weight |
|---|---|
| Financials | ~34-35% |
| Materials* | ~18-25% |
| Healthcare | ~5% |
| Rest of portfolio | ~36-43% |
\Sources conflict on the precise materials weighting as of April/May 2026. Financials at approximately 34-35% is consistent across sources.*
The top 10 stocks in the S&P/ASX 200 accounted for 49.2% of the index as at 27 March 2026, up from 45.6% in November 2025. This is not A200’s portfolio construction choice. It is a structural feature of the Australian equity market. Every broad-market domestic ETF inherits it.
“Broad market exposure” and “highly specific sectoral bet” are both accurate descriptions of the same fund.
ASX 200 concentration risk is a permanent structural feature of market-cap weighting rather than a cyclical anomaly: financials and materials together account for more than 50% of the index, meaning the top-10 weighting increase from 45.6% in November 2025 to 49.2% by late March 2026 reflects an ongoing drift that no individual ETF issuer controls.
Australia’s dividend imputation system works on a straightforward principle. When an Australian company earns a profit, it pays corporate tax at 30%. When that company then distributes a dividend, it can attach a franking credit representing the tax already paid. The investor receives both the cash dividend and the credit.
For investors whose marginal tax rate is at or below 30%, the credit either fully offsets their tax liability on the dividend or generates a cash refund. The result is that the effective income return exceeds the headline cash distribution.
ASFA’s analysis of dividend imputation confirms that the system is most valuable to investors whose marginal tax rate falls at or below the 30% corporate rate, particularly superannuation fund members in pension phase who can receive excess franking credits as a direct cash refund rather than merely as an offset against tax payable.
Effective yield = (cash distributions + franking credits) / current unit price
At A200’s trailing 12-month metrics as at 30 April 2026, that formula produces the gap between the 3.4% cash yield and the 4.5% grossed-up yield. The trailing 12-month franking level sits at 73.5%, but this average masks significant quarterly variability.
The franking credit calculation follows a fixed formula: cash dividend multiplied by 30, then divided by 70, reflecting the 30% corporate tax already remitted by the company before the distribution reaches shareholders. For an SMSF in pension phase, that arithmetic converts a $1,000 fully franked dividend into $1,428.57 of total value once the ATO refunds the attached credit as cash.
| Distribution | Amount per unit | Franking level |
|---|---|---|
| April 2026 | $1.195966 | 85.14% |
| January 2026 | $1.153635 | 60.08% |
The April distribution carried franking credits well above the trailing average, while January came in substantially below it. Investors relying on a steady franking percentage quarter to quarter should expect this kind of variability.
The imputation benefit is greatest for investors whose marginal tax rate is at or below the 30% corporate rate. This includes retirees in lower tax brackets and superannuation funds in pension phase, where franking credits can generate a direct cash refund. Investors on higher marginal rates still benefit; the credit offsets tax payable on the dividend rather than producing a net refund.
The 2026-27 Federal Budget introduced changes affecting discretionary trusts and CGT discounts, but no changes to the core imputation mechanics for individual ETF investors. The grossed-up yield case for A200 remains intact under current law.
A200’s income yield sits within a broader performance context. The fund delivered a one-year total return of approximately 10.38% and a five-year annualised return of approximately 8.52%, both measured to 30 April 2026. Income is a meaningful component of those returns, but not the whole story.
CGT discount eligibility adds a further after-tax dimension to the A200 return calculation: units held for at least 12 months qualify for the 50% CGT discount for individual investors, meaning the total return figure of approximately 10.38% over one year carries different net-of-tax implications depending on whether the investor has crossed that holding threshold.
The fee structure matters as an income variable. Betashares lists A200’s management fee and costs at 0.04% per annum, with third-party estimates placing the all-in management expense ratio (MER) at approximately 0.07%. A lower MER means a larger share of the underlying dividend stream reaches the investor. Over a 10-20 year holding period, that difference compounds.
The peer group, VAS (Vanguard Australian Shares ETF) and IOZ (iShares Core S&P/ASX 200 ETF), offers broadly comparable exposure with grossed-up yields in the approximate range of 3.9-4.5% across the group.
| ETF | Cash yield (approx) | Grossed-up yield (approx) | MER | Distribution frequency |
|---|---|---|---|---|
| A200 | 3.4% | 4.5% | 0.04% (0.07% all-in est.) | Quarterly |
| VAS† | ~3.0-3.6% | ~3.9-4.5% | Higher than A200 | Quarterly |
| IOZ† | ~3.0-3.6% | ~3.9-4.5% | Higher than A200 | Quarterly |
†VAS and IOZ yield figures are directional estimates and have not been independently verified.
For income investors evaluating these ETFs, the variables that matter are:
A200’s sector concentration creates a specific risk architecture. The macroeconomic shocks most likely to reduce the fund’s capital value are the same shocks that reduce its distributions and franking credits. This is not two separate problems. It is one compounding event.
The two primary risk channels operate through distinct macro drivers:
The fund’s limited exposure to healthcare (approximately 5%) and minimal technology representation mean A200 may also lag materially during periods when growth sectors lead broader global markets. This is a return drag in certain environments, not merely a diversification gap.
A China-driven commodity demand slowdown reduces miner valuations and miner dividends at the same time. A domestic housing downturn reduces bank valuations and bank dividend capacity simultaneously. The income stream that A200 investors hold in place of capital growth is not insulated from the same shocks hitting the fund’s capital base.
This structural correlation is not resolved by holding the full ASX 200, because the index itself is concentrated in exactly these sectors.
VAS, IOZ, and A200 offer substantially similar market exposure. The structural overlap in their underlying indices means the yield differences within this peer group are narrow, and the concentration risks are shared.
The genuinely differentiating variables, ranked by practical importance for long-term income investors, are:
For investors choosing between broad Australian equity ETFs, the concentration risk is the same whichever fund they select. The differentiator is what they pay to hold it.
Investors spending significant time comparing headline yields between these three products may be optimising the wrong variable. The peer grossed-up yield range of approximately 3.9-4.5% (directional, not independently verified) is narrow enough that fee savings compound into a larger long-run income advantage.
A200 delivers a grossed-up yield of 4.5% at a management fee of 0.04%, backed by $9.61 billion in net assets. The imputation system remains intact for individual investors and superannuation funds under current law, confirmed by the 2026-27 Federal Budget. The income case is real.
So is the concentration risk. A200 suits certain investor profiles well and others poorly:
International equity ETFs returned approximately 32% over the 12 months to May 2026 while A200’s domestic-equivalent peers delivered around 10%, a gap that illustrates precisely the opportunity cost of an Australia-only allocation during periods when global growth sectors lead and domestic banks face margin compression.
The fund rewards investors who have explicitly accepted the Australian financials and resources bet. It penalises those who hold it on the assumption that broad-market tracking means broad-risk diversification. Understanding what A200 actually owns is the prerequisite to holding it with conviction, or deciding to complement it with something different.
This article is for informational purposes only and should not be considered financial advice. Investors should conduct their own research and consult with financial professionals before making investment decisions. Past performance does not guarantee future results.
The A200 ETF has a grossed-up yield of approximately 4.5%, compared to a headline cash yield of 3.4%. The difference comes from franking credits, which represent corporate tax already paid by the underlying companies; the formula adds those credits to the cash distribution and divides by the current unit price.
Franking credits attached to A200 distributions can either offset your tax liability on the dividend or, for investors such as superannuation funds in pension phase, generate a direct cash refund from the ATO. As of the trailing 12 months to 30 April 2026, A200's average franking level was 73.5%, though individual quarterly distributions varied significantly, ranging from 60.08% in January 2026 to 85.14% in April 2026.
A200 allocates approximately 34-35% to financials and 18-25% to materials, meaning more than half the portfolio is exposed to Australian banks and miners. This concentration means a China-driven commodity slowdown or a domestic housing downturn can reduce both the fund's capital value and its dividend distributions at the same time.
A200 carries a management fee of 0.04% per annum (approximately 0.07% all-in), which is lower than both VAS and IOZ; all three funds offer broadly similar grossed-up yields in the approximate range of 3.9-4.5%. For long-term income investors, the fee advantage compounds into a more durable income benefit than marginal differences in trailing yield.
A200 is best suited to income-focused retirees, pension-phase superannuation fund members who can receive franking credit refunds as cash, and investors who already hold international equity exposure elsewhere and want to add Australian large-cap income. It is less suitable for investors with no international diversification or those who assume broad-market tracking protects against domestic sector concentration risk.