In 1968, investors bought shares in some of the finest companies ever assembled, including Hewlett-Packard, Coca-Cola, IBM, and Merck, and then watched their portfolio lose roughly 90% of its value over the next five years. The companies were not the problem. The price was.
The confusion between a good company and a good investment is one of the most persistent and costly errors in finance. It shows up in every market cycle, from the Nifty Fifty of the late 1960s to the AI-driven enthusiasm of the 2020s, and it afflicts experienced professionals as readily as it does beginners. Howard Marks, founder of Oaktree Capital Management and author of The Most Important Thing, has spent decades building a framework for understanding why price paid is the single most consequential variable in investing, and why it is so routinely ignored.
What follows unpacks that framework in full: what intrinsic value means and how it differs from quality, why second-level thinking is required to act on the distinction, what historical and recent market evidence shows when investors confuse the two, and what practical implications follow for anyone trying to build a durable portfolio.
The one principle most investors get backwards
Most investors begin with a reasonable-sounding question: is this a good company? Strong management, growing revenue, defensible market position. If the answer is yes, they buy. The logic feels sound. It is also incomplete, and the gap between “incomplete” and “wrong” is where most wealth destruction occurs.
In The Most Important Thing, Marks structured the argument deliberately. A chapter on assessing intrinsic value is immediately followed by a chapter on the relationship between price and that assessed value. The two are treated as inseparable. Identifying what an asset is worth accomplishes nothing if the purchase price already exceeds that worth.
The distinction becomes sharpest in an example Marks returns to often. Moody’s historical definition of B-rated bonds described them as “lacking desirable investment characteristics,” with no reference to price. That omission is, in Marks’ view, a fundamental analytical error. A B-rated bond purchased at a steep discount to its recovery value can be a highly profitable investment. A triple-A-rated bond purchased at a premium can deliver losses.
The implication reframes everything:
- The question most investors ask: Is this a good asset?
- The question that actually determines outcomes: Is this asset’s price below my estimate of its intrinsic worth?
High quality at an inflated price is a loss-making proposition. Low quality purchased cheaply can be a profitable one. The variable that matters is not the asset itself; it is the price paid relative to what the asset is worth.
When big ASX news breaks, our subscribers know first
What the Nifty Fifty teaches about paying too much for the best
Nobody buying the Nifty Fifty was being naive about fundamentals. The basket included Hewlett-Packard, Texas Instruments, Merck, Xerox, IBM, Kodak, and Coca-Cola. These were genuine franchise businesses with dominant market positions, strong earnings growth, and the kind of competitive advantages that investment textbooks still cite decades later.
The problem was what investors paid for that quality. At the time of purchase around 1968, these stocks traded at 80 to 90 times forward earnings.
80 to 90 times forward earnings, against a post-WWII average of roughly 16 times.
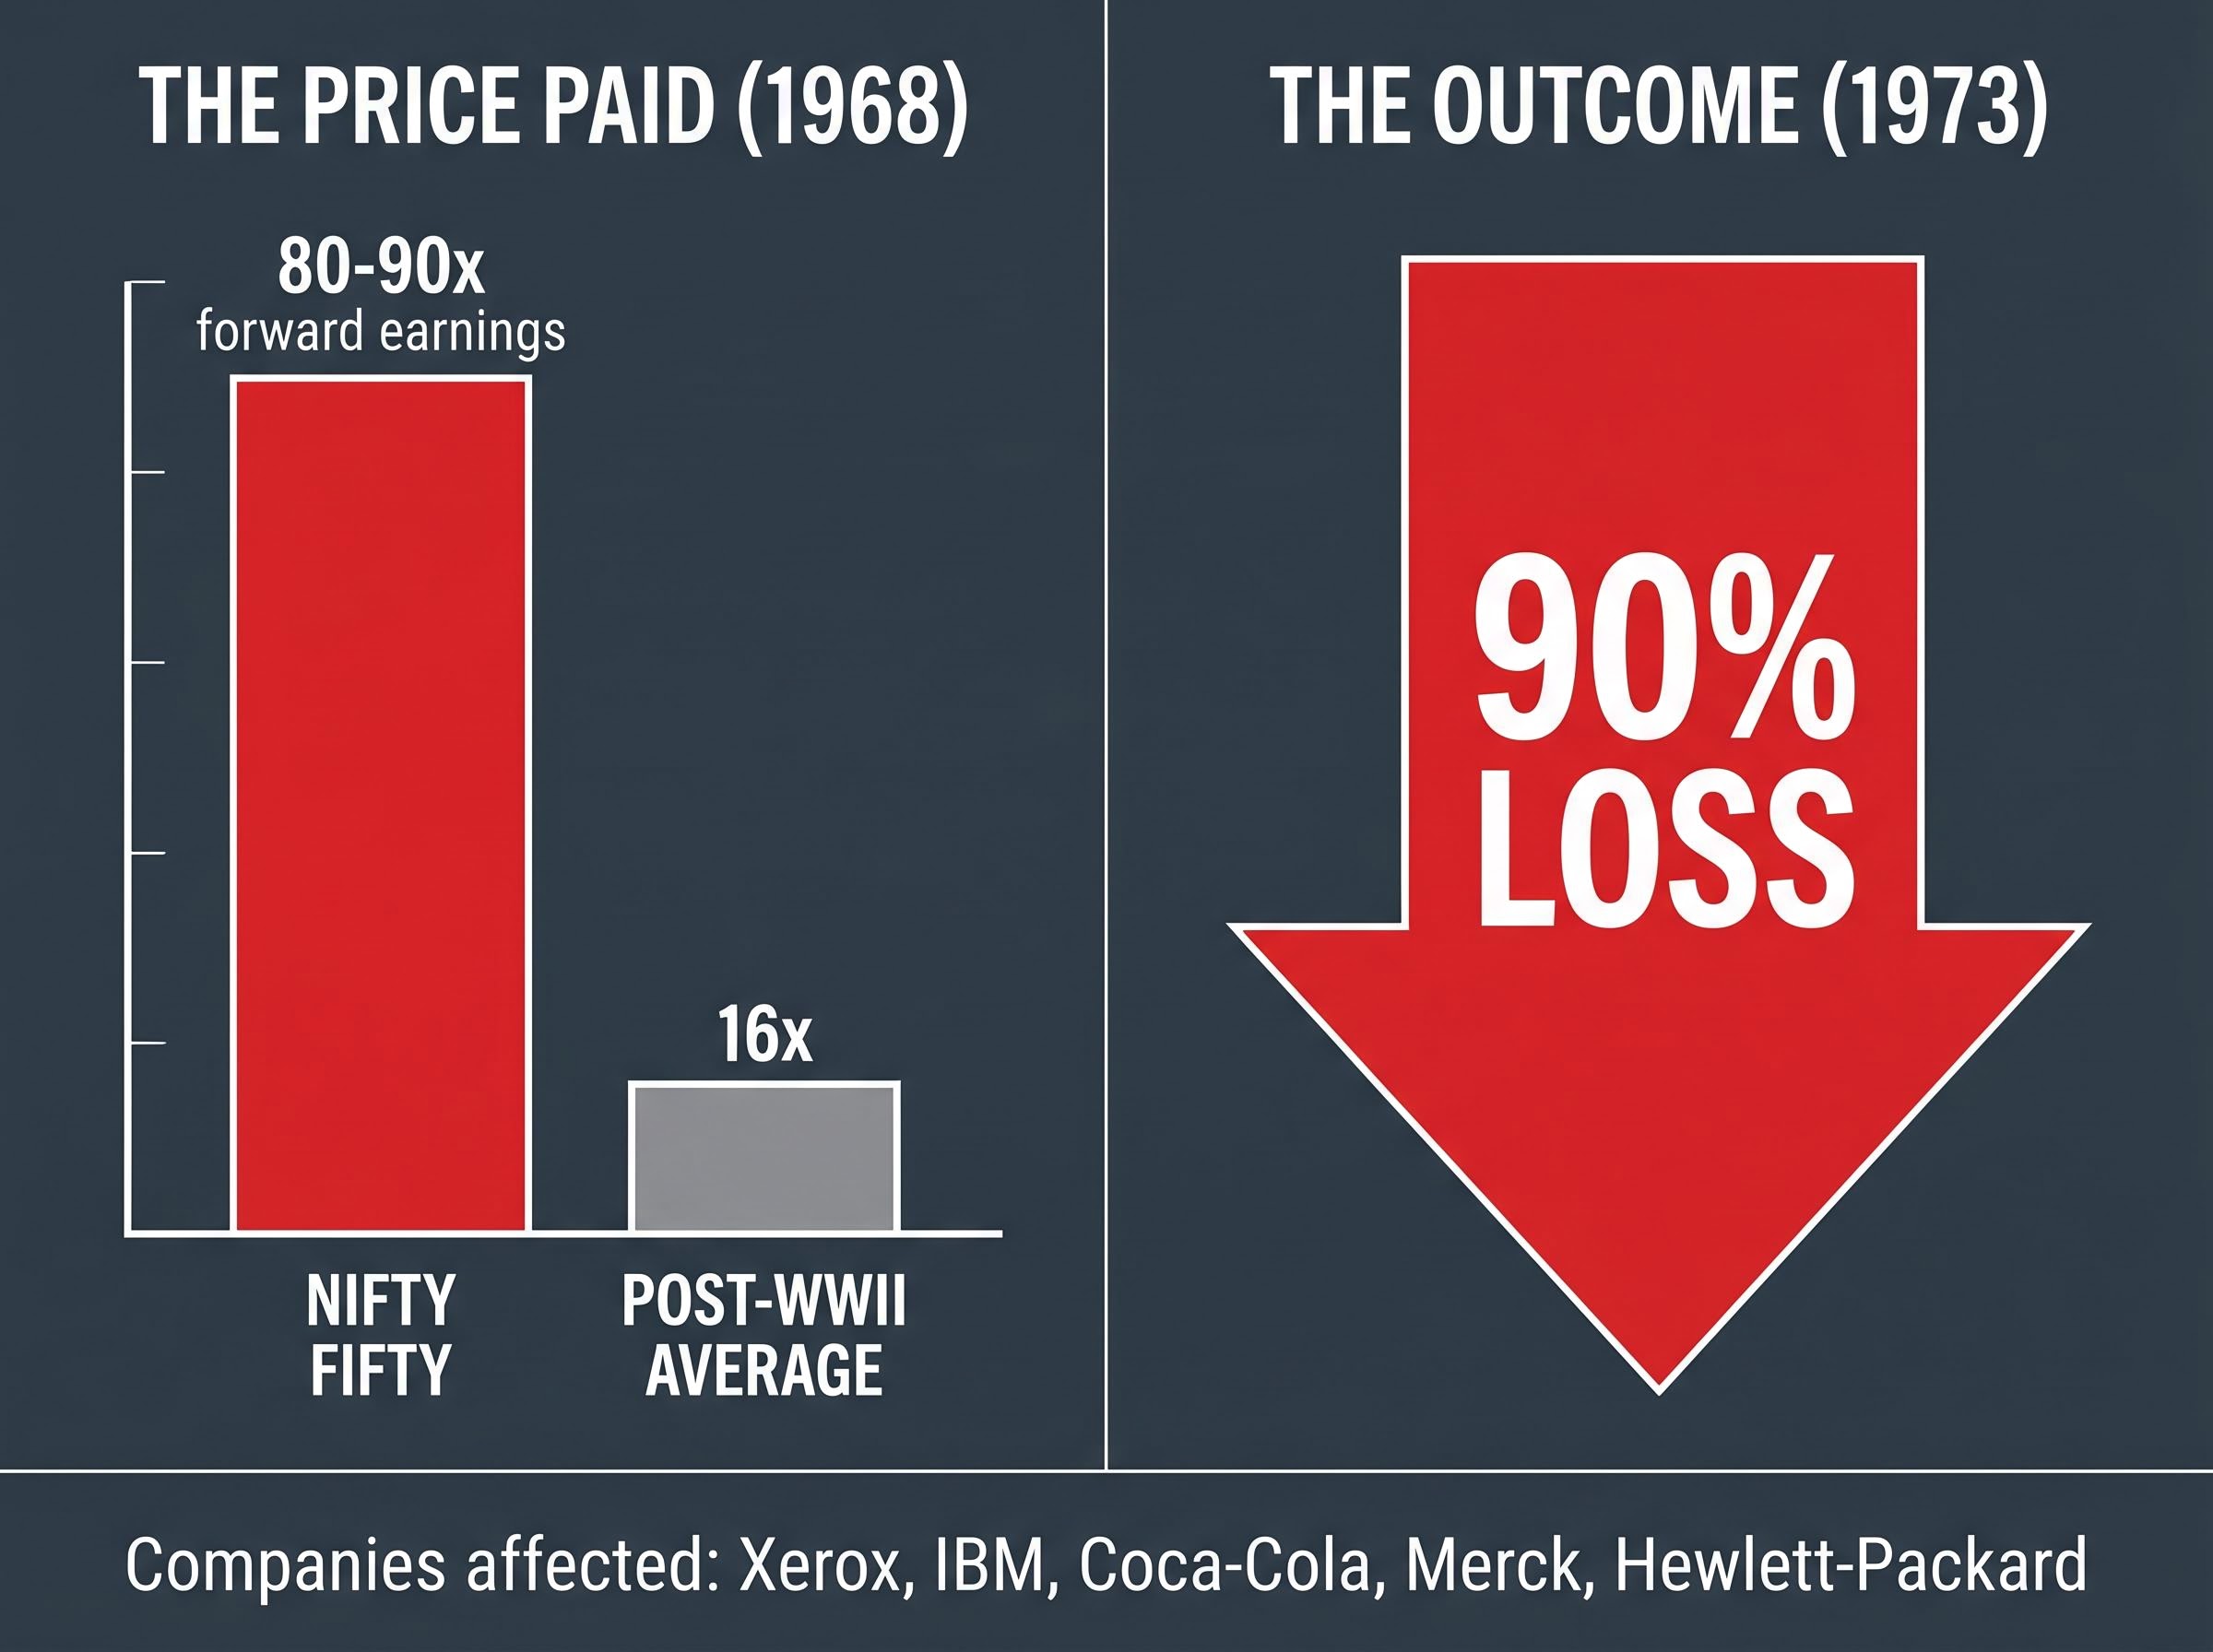
The gap between the purchase multiple and any reasonable baseline was not a rounding error. It was a structural guarantee that even flawless execution by the underlying businesses could not generate returns sufficient to justify the entry price. By 1973, the basket had lost approximately 90% of its value.
The symmetry of the lesson matters. During the same period, lower-rated corporate debt, the kind of instruments Moody’s described as lacking desirable investment characteristics, delivered strong returns. The “inferior” assets outperformed the “superior” ones because price, not quality, determined the outcome.
| Company | Approx. Purchase-Era P/E | 1968-1973 Outcome |
|---|---|---|
| Xerox | ~80-90x forward earnings | Severe drawdown (~90% basket loss) |
| IBM | ~80-90x forward earnings | Severe drawdown (~90% basket loss) |
| Coca-Cola | ~80-90x forward earnings | Severe drawdown (~90% basket loss) |
| Merck | ~80-90x forward earnings | Severe drawdown (~90% basket loss) |
| Hewlett-Packard | ~80-90x forward earnings | Severe drawdown (~90% basket loss) |
The companies survived. Many went on to thrive for decades. The investors who bought at those prices did not.
Why thinking past the obvious consensus is what separates investors who generate returns
If the principle is straightforward, why does every generation of investors repeat the error? The answer lies in how markets process information, and in the specific cognitive habit required to avoid the trap.
Marks draws a distinction between two levels of thinking:
The cognitive pattern driving this error has a formal name in behavioral economics: the representativeness heuristic, a documented bias in which people judge the quality of an outcome by how closely the surface characteristics of a choice resemble a prototype of success, causing them to conflate a recognisably great company with a reliably profitable investment.
- First-level thinking: “This is a great company with strong growth. Buy.”
- Second-level thinking: “This is a great company with strong growth. Everyone knows that. The price already reflects it, and possibly more. At this price, what are the expected returns?”
The first level identifies quality. The second level asks whether the market has already paid for that quality, and then some. The distinction is not academic; it is arithmetic. If most investors recognise the same strengths in the same company, that recognition gets bid into the price. Buying at that price earns consensus returns at best, which is to say, average returns from an above-average asset, a poor trade.
The structural difficulty is real. Generating above-average returns requires being above average, which by definition most participants cannot simultaneously be. Charlie Munger, citing the philosopher Demosthenes, observed that people tend to believe what they wish to be true. In markets, this manifests as the tendency to treat a compelling narrative as sufficient evidence that an investment will work, regardless of the price paid.
Applying second-level thinking to today’s AI market
The current AI cycle is a live test of this framework. In an interview with the Financial Times reported on 4 April 2024, Marks applied the principle directly: the question is “not just whether AI will be big, but whether today’s prices already discount that, and then some.”
In a Bloomberg Television interview reported on 19 March 2024, Marks reinforced the point further. In a higher-rate world, the relevant variable is “what you pay relative to value,” not whether the company is high quality. The AI companies may indeed be exceptional businesses. That is first-level thinking. The second-level question, whether the exceptionalism is already priced into the stock, is where investment returns are actually determined.
The expectations gap framework formalises this intuition: investment returns are driven by the difference between what a price already implies and what actually occurs, not by the quality of the outcome in isolation, and the BofA Global Fund Manager Survey data showing a 37-percentage-point single-month surge in equity allocation provides a measurable proxy for how crowded the consensus has become.
How inflated optimism shows up in market prices today
The abstract principle has a concrete shape across multiple asset classes and geographies. Taken individually, each data point is a valuation snapshot. Taken together, they form a pattern: when investors pay premium multiples for recognised quality, they compress their own future returns.
Start with the broadest measure. The S&P 500 traded at approximately 20-20.4 times forward earnings in mid-2024, according to data reported by the Wall Street Journal and the Financial Times. The 10-year average sat at roughly 17.7 times. The post-WWII average cited in Marks’ own analysis is approximately 16 times. The broad market was already priced above both baselines.
Within that market, concentration amplified the premium. Bloomberg News reported on 7 January 2025 that the Magnificent Seven cohort traded at an average forward P/E above 30 times, versus approximately 19 times for the rest of the S&P 500. Nvidia reached a forward P/E in the mid-to-high 30s range across 2024, characterised by Barron’s on 24 May 2024 as “priced for near-flawless execution.” Microsoft, Alphabet, and Meta traded on forward multiples in the mid-20s to low-30s, compared with the long-run S&P 500 average of approximately 16-17 times, as reported by the Financial Times on 3 March 2024.
The pattern extended beyond US technology. The Economist reported on 9 May 2024 that LVMH and Hermès, European luxury houses with formidable brands and margins, traded at forward P/Es in the high-20s to mid-30s.
“Even indomitable franchises become dangerous when investors assume perfection forever.” The Economist, 9 May 2024
| Asset | Forward P/E | Baseline | Period |
|---|---|---|---|
| Magnificent Seven (avg) | Above 30x | Rest of S&P 500 ~19x | January 2025 |
| Nvidia | Mid-to-high 30s | Historical tech norms | 2024 |
| S&P 500 (broad) | ~20-20.4x | 10-yr avg ~17.7x | Mid-2024 |
| LVMH, Hermès | High-20s to mid-30s | N/A | May 2024 |
Each of these companies may deserve premium valuations. The second-level question is whether the premium already exceeds what the business can deliver.
Growth stock valuations are structurally elevated by design: the high P/E ratios attached to companies like Nvidia and the Magnificent Seven reflect the market pricing distant future earnings through discounted cash flow mechanics, but that same structure means rising interest rates compress share prices even when the underlying business keeps performing, adding a macro-level risk layer on top of the valuation stretch already documented in the current cycle.
What out-of-favour assets earning strong returns actually proves
If overpaying for quality compresses returns, the corollary should hold: buying unfashionable assets at depressed prices should generate above-average returns. The evidence from 2023 and 2024 confirms the symmetry.
- Global value stocks outperformed growth in 2023 and into early 2024, with value-tilted indices beating growth by several percentage points, according to the Financial Times on 8 January 2024. Many of these names were cyclical, capital-intensive, and previously shunned.
- UK equities hit record highs on the FTSE 100, with numerous stocks trading at single-digit P/Es and high dividend yields outpacing US technology over the prior months, as reported by the Financial Times on 6 May 2024.
- European banks and energy companies, formerly dismissed for structural weakness and policy risk, delivered double-digit gains over the prior year, according to The Economist on 16 March 2024.
- Emerging-market value and old-economy sectors, including materials, industrials, and traditional financials, outperformed more fashionable emerging-market technology in the prior 12 months, as reported by The Economist on 11 May 2024.
Credit and distressed debt as the clearest proof
The argument becomes cleanest in credit markets, where Marks built his career and where Oaktree Capital applies its framework institutionally.
Bloomberg News reported on 22 February 2024 that distressed-debt and high-yield credit funds generated returns in the low-to-mid teens in 2023, beating many equity indices. These credits were initially regarded as low quality. As restructurings progressed and default outcomes proved less severe than feared, valuations rerated sharply.
Oaktree’s own portfolio provided direct evidence. Selected distressed opportunities in real estate and corporate credit produced equity-like returns from assets widely viewed as toxic in 2022, according to Bloomberg. The same B-rated bonds that Moody’s once described as lacking desirable investment characteristics became the highest-returning part of the fixed-income universe, precisely because their prices had been set by fear rather than by a sober assessment of intrinsic value.
The mechanism is identical in both directions. Overpaying for quality compresses returns. Underpaying for perceived weakness expands them.
Investors wanting to stress-test the second-level question against structured analytical tools will find our dedicated guide to AI stock bubble frameworks useful; it applies the Shiller CAPE ratio at 40.11, Minsky financing stages, and Kindleberger’s anatomy of manias to the current AI cycle, and includes a practical rebalancing checklist for portfolios with elevated Magnificent Seven concentration.
The question every investor should ask before committing capital
The framework distils into a sequence of questions that apply before any purchase, in any asset class, in any market environment:
- What is the estimate of this asset’s intrinsic value?
- What is the market’s estimate, as implied by the current price?
- Is there a difference between those two views, and why?
- Is the gap between price and value wide enough to justify the risk of being wrong?
Asking these questions is straightforward. Acting on the answers is not. Munger’s observation about believing what one wishes to be true operates with particular force in crowded markets. When the consensus is that a company is exceptional, questioning the price feels like questioning the company, and few investors want to be the person who argues against obvious quality.
Translating the price-versus-quality principle into practice requires a working set of value investing metrics: P/E ratios, price-to-book ratios, free cash flow yield, and debt-to-equity thresholds each capture a different dimension of whether an asset is priced below its intrinsic worth, and no single figure is sufficient on its own.
Marks noted in his February 2024 memo, “Further Thoughts on Sea Change,” that higher interest rates have made the discipline more consequential. In a world where risk-free rates offer meaningful yield, stretching for richly valued assets carries a higher opportunity cost. As Marks told Bloomberg Television in March 2024, investors “can get reasonable returns without stretching on price.”
Rob Arnott, founder of Research Affiliates, framed the risk precisely in commentary reported by the Wall Street Journal on 25 March 2024:
“When everyone agrees on the greatness of a set of companies, expected returns fall because their superiority is already priced in.”
Cliff Asness of AQR Capital Management reinforced the point in a post discussed by the Financial Times on 30 May 2024: even if these companies are excellent, “it does not follow that their stocks are excellent investments at today’s prices.”
The discipline is not about avoiding good companies. It is about refusing to let the quality of the asset override the obligation to assess the price.
Good companies and good investments are not the same thing
The distinction between price and quality is simple to state and structurally difficult to act on. Every piece of evidence in this framework, from the Nifty Fifty’s 90% drawdown to the 2023-2024 outperformance of unloved UK equities and distressed credit, confirms the same mechanism: investment outcomes are determined by the relationship between price paid and intrinsic value, not by the quality of the underlying asset in isolation.
That the lesson needs restating in every generation is itself evidence of its difficulty. Recognising a great business feels like insight. Paying whatever the market demands for it feels like conviction. Both feelings are sincere. Neither protects against overpayment.
The lasting discipline is a single question, applied consistently: is the price below what this asset is worth? Every other consideration, quality, narrative, consensus, popularity, is secondary to the answer.
This article is for informational purposes only and should not be considered financial advice. Investors should conduct their own research and consult with financial professionals before making investment decisions. Past performance does not guarantee future results. Financial projections are subject to market conditions and various risk factors.