
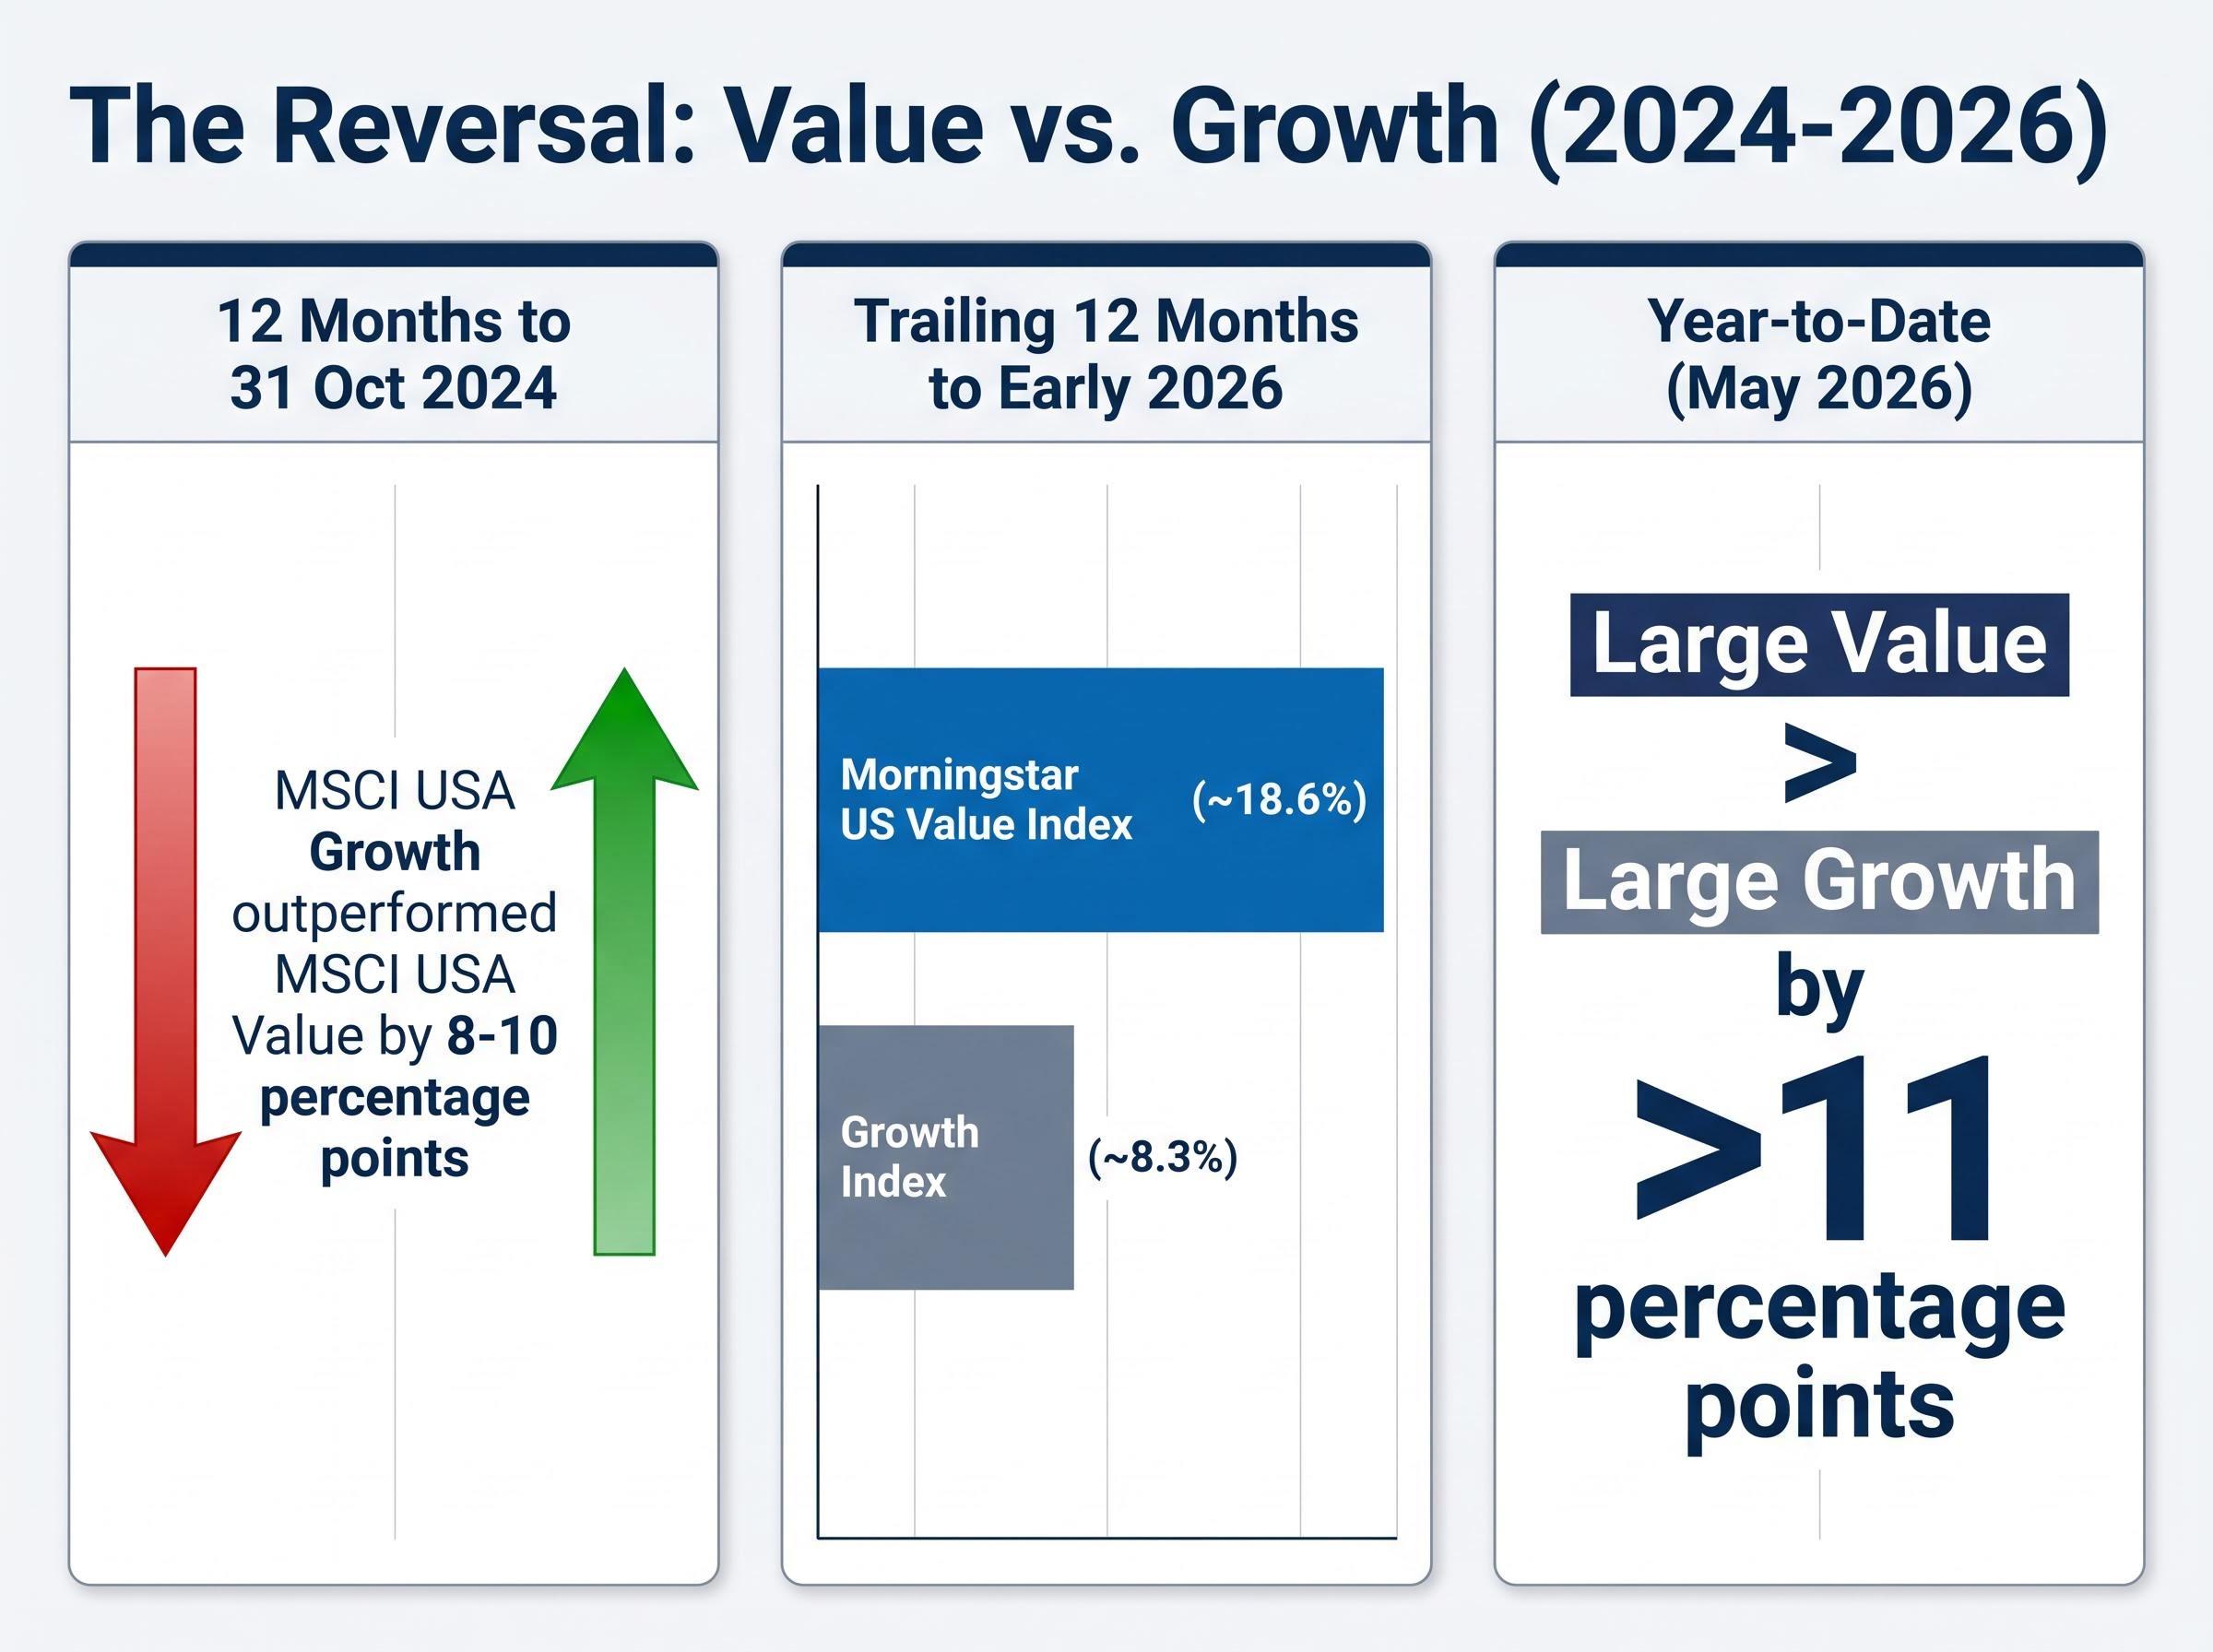
For much of the past decade, buying “cheap” stocks looked like a losing bet. Growth names, particularly mega-cap technology and AI-related companies, dominated returns so thoroughly that value investing began to feel like a strategy stuck in another era. Then 2026 arrived. Through early May 2026, large value has outperformed large growth by more than 11 percentage points year-to-date, forcing a reassessment of an approach many retail investors had written off entirely.
Value investing is one of the oldest systematic investment strategies in equity markets, associated with practitioners from Warren Buffett to Dodge & Cox, yet it remains widely misunderstood. Too many investors conflate “cheap” with “bad business” and walk away from opportunities, or worse, buy genuinely deteriorating companies and call it value investing. The strategy has concrete, learnable tools at its core.
This guide covers exactly what value investing means, which financial metrics to use and how to interpret them, how the approach differs from growth investing, what the real risks are, and whether individual stock picking or a value-focused index fund makes more sense for different investor situations.
What value investing actually means (and what it doesn’t)
The most common misconception is that value investing means buying whatever has a low share price or a single-digit price-to-earnings ratio. It does not. Value investing is the practice of buying stocks that trade below their estimated intrinsic value, the price a business would be worth if all its future cash flows were calculated and discounted back to today.
The intrinsic value framework underlying value investing has deeper intellectual roots than most retail investors realise: John Burr Williams formalised it in 1938 as a direct response to the speculative excesses of the 1920s, establishing that a stock’s worth is the present value of its future cash flows rather than whatever price the market is willing to pay today.
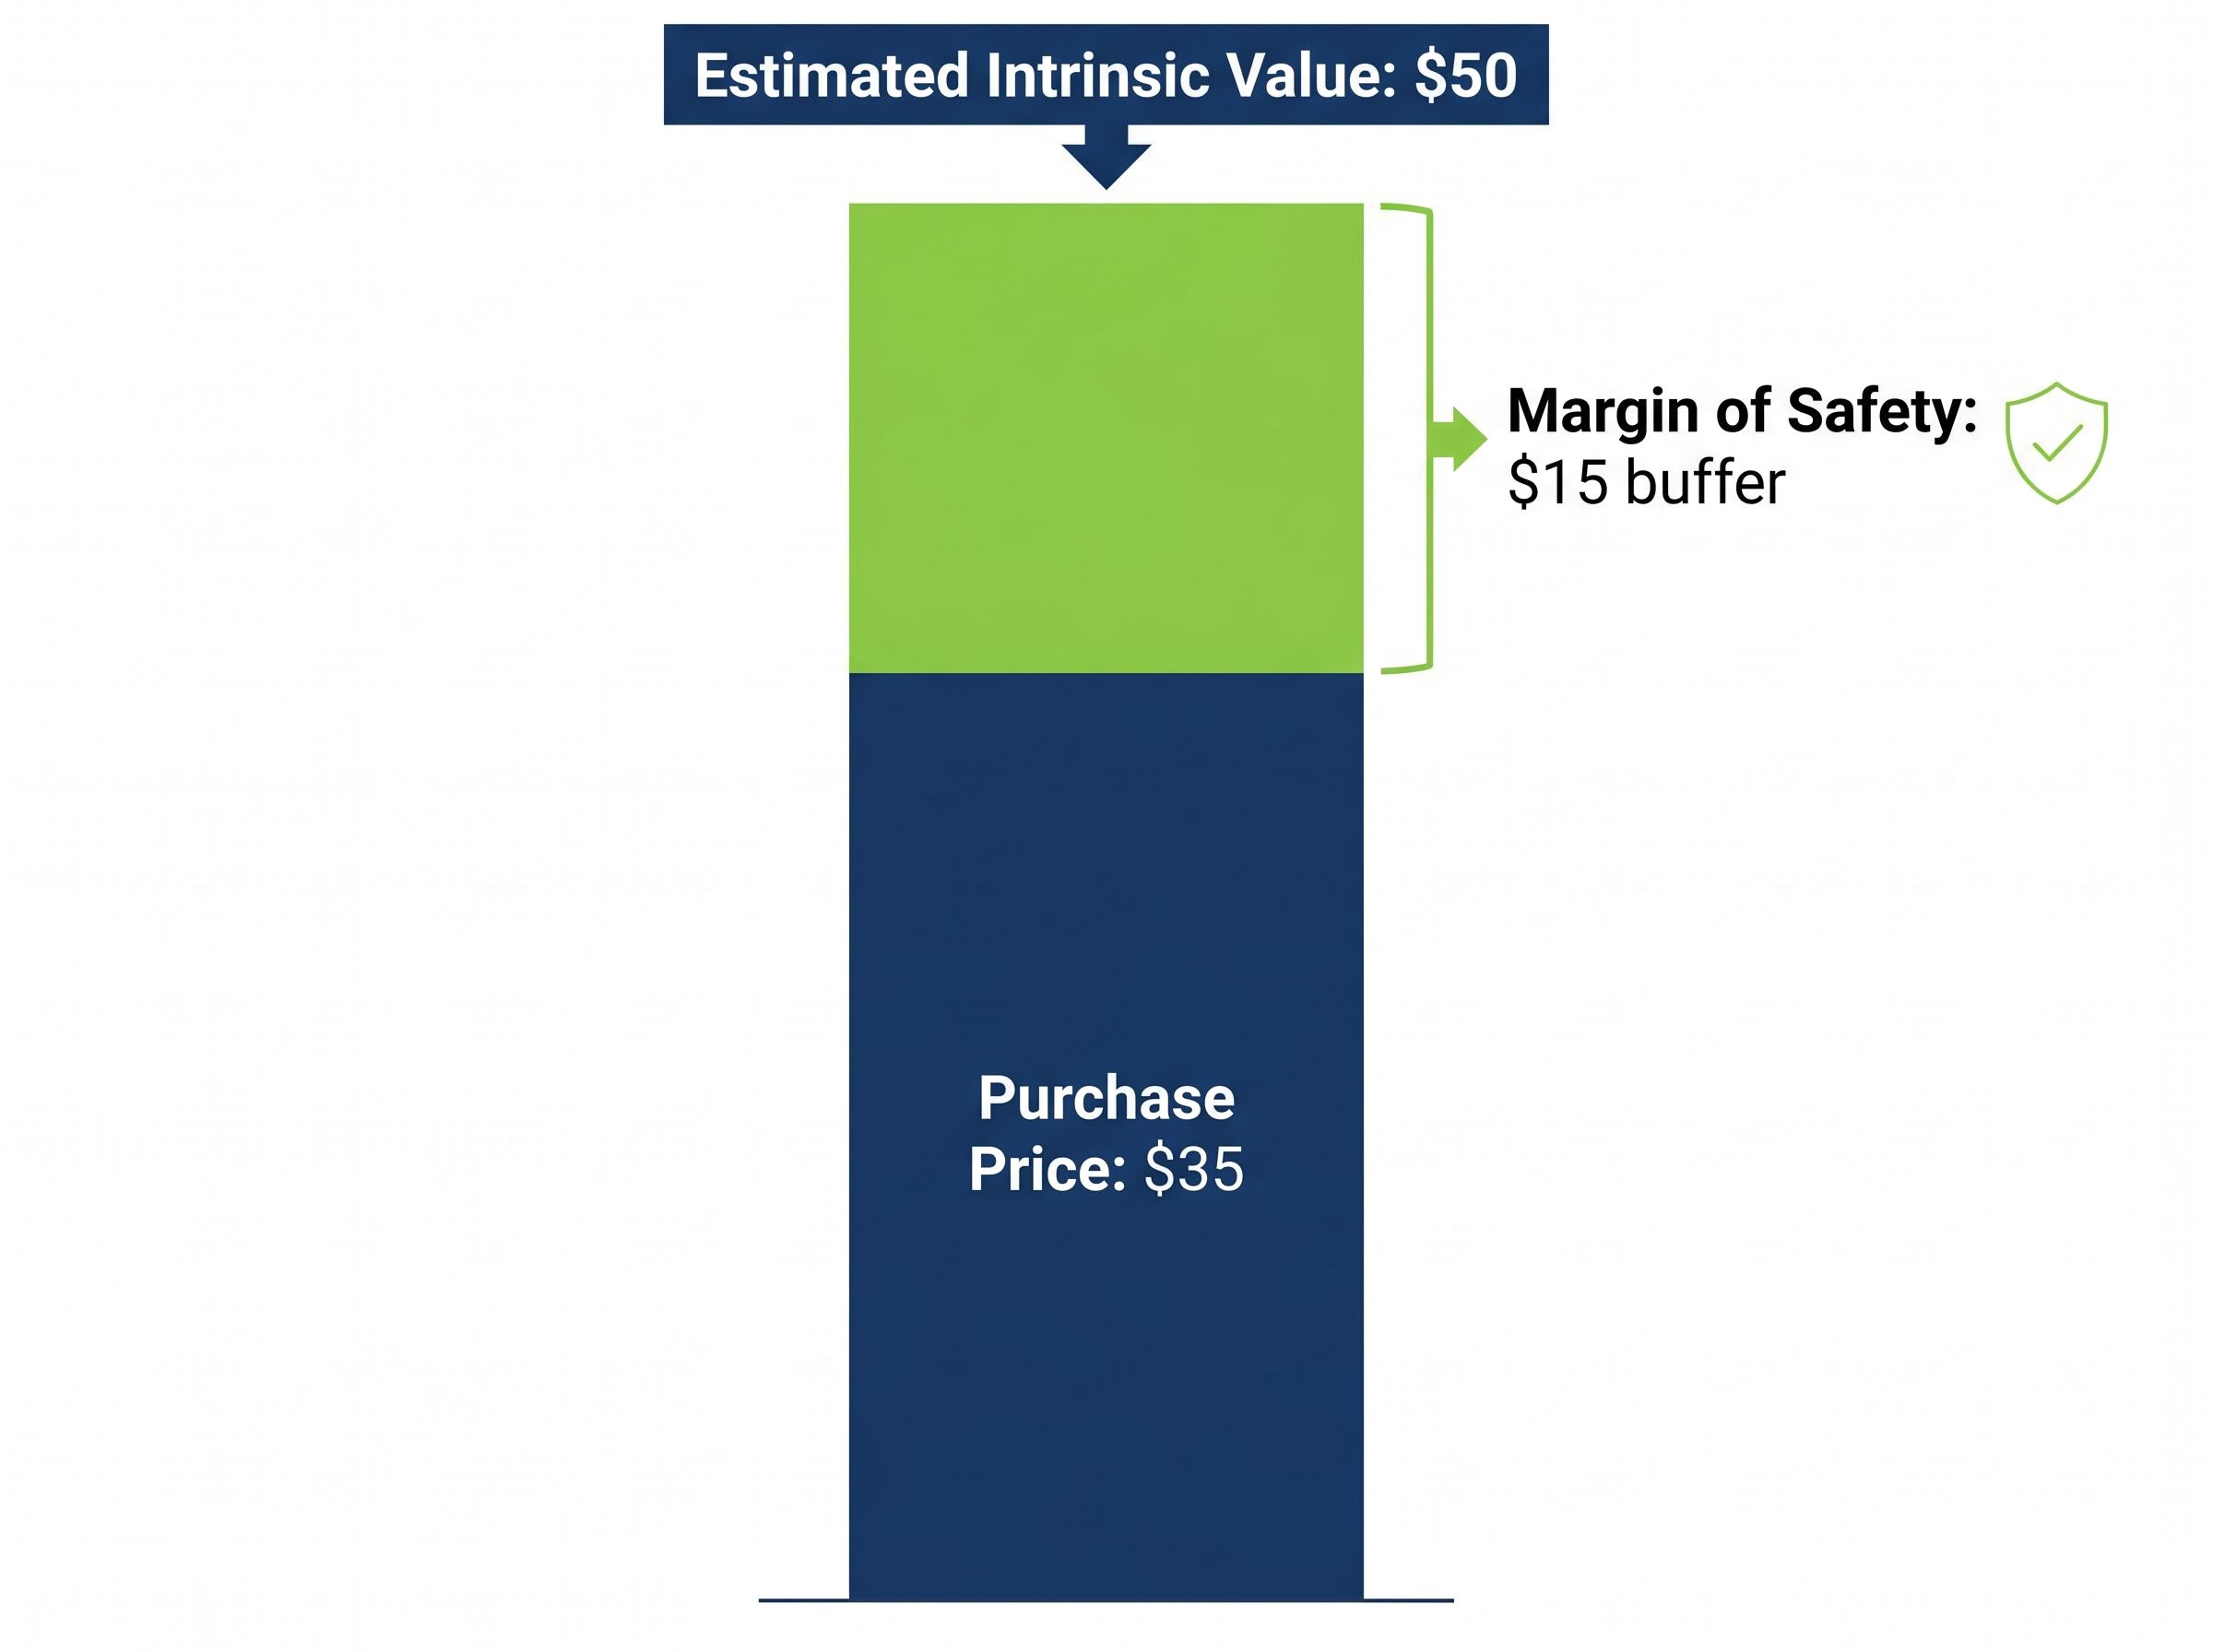
The concept that separates informed value investors from bargain hunters is the margin of safety: the gap between a stock’s estimated intrinsic value and its current market price. That gap provides a buffer against estimation errors. If an investor calculates a company is worth $50 per share and buys it at $35, the $15 difference is the margin of safety. Even if the intrinsic value estimate turns out to be somewhat optimistic, the investor still has room.
“Value investing is not buying low P/Es; it is paying less than something is worth.” Bill Nygren, Oakmark Funds (Morningstar interview, June 2024)
Berkshire Hathaway, under Buffett’s leadership, demonstrated this discipline clearly in 2024 by building cash reserves exceeding $180 billion rather than deploying capital at unattractive valuations. Waiting for mispriced opportunities is not hesitation; it is the strategy working as designed.
Not every cheap-looking stock is a genuine opportunity. Before moving to the metrics that quantify value, it helps to understand the difference:
- Signs of genuine undervaluation: stable or growing free cash flow, temporary industry headwinds rather than structural decline, a strong balance sheet with manageable debt
- Warning signs of a value trap: declining revenues and margins over multiple years, excessive leverage relative to peers, disruption risk from technology or regulation that threatens the business model permanently
The distinction between these two categories is where most value investing mistakes occur, and it receives a full treatment later in this guide.
When big ASX news breaks, our subscribers know first
Comparing value and growth investing: philosophy, performance, and portfolio fit
Growth investing prioritises companies expected to expand earnings faster than the market average, accepting higher current valuation multiples in exchange for that future potential. Value investing prioritises companies priced below their estimated current worth, betting that the market will eventually recognise what the price does not yet reflect.
Neither approach wins permanently, and the gap between them can persist for years.
| Dimension | Value Investing | Growth Investing |
|---|---|---|
| Primary goal | Buy below intrinsic value | Buy future earnings acceleration |
| Typical valuation profile | Lower P/E, higher dividend yield | Higher P/E, lower or no dividend yield |
| Historical performance driver | Mean reversion, rising rates | Innovation cycles, falling rates |
| Typical sectors | Financials, energy, industrials | Technology, consumer discretionary, biotech |
What the last two years of performance data actually show
Growth dominated for much of 2024 and into 2025. Over the 12 months to 31 October 2024, MSCI USA Growth outperformed MSCI USA Value by roughly 8-10 percentage points, driven almost entirely by AI-related technology stocks, according to the Financial Times. J.P. Morgan Asset Management confirmed in February 2025 that growth had led value over the preceding 1, 3, and 5 years in U.S. equities.
Then the rotation arrived. By early 2026, the Morningstar US Value Index was up approximately 18.6% over the trailing 12 months, versus approximately 8.3% for the Growth index. That is not a marginal difference; it is a reversal that caught many momentum-driven portfolios off guard.
The same rotation that propelled value outperformance in early 2026 created an unusual simultaneous condition: a growth stock discount of approximately 21% to fair value, a level Morningstar data shows occurring less than 5% of the time since 2011, suggesting that style rotation rarely produces a one-sided outcome and that both camps can be mispriced relative to fundamentals at the same time.
The underperformance of value during the prior period did not signal a broken strategy. It reflected structural headwinds: ultra-low interest rates, the rise of intangible-heavy technology businesses, and index-fund flows that concentrated capital into the largest growth names. Several of those headwinds have since shifted. AQR Capital Management noted in September 2024 that valuation spreads between cheap and expensive stocks remained historically wide, suggesting the value factor was attractively priced even during growth’s leadership.
The three financial metrics every value investor should know
Three quantitative starting points give investors a practical screening framework. None works in isolation. Each should be evaluated against the company’s own history, sector peers, and the prevailing interest rate environment.
Price-to-earnings (P/E) ratio measures how much investors pay for each dollar of earnings. Value investors typically look for P/E ratios below the stock’s own 5-year average and below the broader market or sector average, according to Morningstar’s Susan Dziubinski. Single-digit P/Es may signal deep value but require extra caution, as they can also signal business deterioration.
Free cash flow (FCF) yield measures the cash a business generates after capital expenditures, expressed as a percentage of its market value. A yield of approximately 5-8% or higher is commonly cited as attractive relative to bond yields and industry medians. Morningstar’s May 2024 screen used FCF yields above 4% for large caps and above 6% for smaller companies as a starting universe.
Debt-to-equity ratio measures how much a company relies on borrowed money relative to shareholder equity. For most non-financial sectors, a ratio under approximately 1.0 is preferred. Below 0.5 signals a particularly strong balance sheet. Utilities and financials, where leverage is structurally normal, warrant higher thresholds.
| Metric | What it measures | Common value threshold | Key caveat |
|---|---|---|---|
| P/E ratio | Price paid per dollar of earnings | Below stock’s 5-year average and sector average | Single-digit P/Es may reflect decline, not opportunity |
| FCF yield | Cash generated relative to market value | ~5-8% or higher | Compare to bond yields and industry median, not in isolation |
| Debt-to-equity | Leverage relative to equity | Under ~1.0 (under 0.5 is strong) | Financials and utilities structurally carry higher ratios |
The most effective approach uses these three metrics as overlapping filters rather than standalone rules. A stock with a low P/E, a strong FCF yield, and moderate debt is a more compelling candidate than one that passes only a single screen.
Vanguard research (January 2025) found that value strategies incorporating screens for moderate leverage historically showed better risk-adjusted returns than pure deep-value screens that ignored balance sheet risk.
The real risks of value investing: value traps, patience, and the limits of simple screens
The risks of value investing are not theoretical. They are the precise mechanism by which most retail value investors underperform, and naming them clearly is what separates informed practitioners from casual screen-runners.
A value trap is a stock that looks cheap on multiples because the business is structurally declining, not because the market is being irrational about a good company. Morningstar’s August 2024 analysis identified the warning signs: declining revenues and margins, excessive debt, and industry disruption risks. A low P/E on a business losing market share permanently is not a bargain. It is a price that reflects reality.
The patience requirement is equally serious. Value strategies can underperform for years. As The Economist noted in May 2024, value trailed growth for much of the post-2009 period, with structural factors including low interest rates, intangible-heavy business models, and index-fund flows all favouring growth stocks. Many investors abandoned the approach at exactly the wrong time. AQR acknowledged in September 2024 that the value factor premium can be “painfully slow” to realise and can endure multi-year droughts.
AQR research on factor premia cycles draws on nearly a century of equity market data to show that the value premium is real but cyclical, with prolonged underperformance periods being a structural feature of the factor rather than evidence of its permanent decay.
Why “cheap” and “broken” are not the same thing
A bank whose stock fell during a rate scare but whose lending margins remain intact is temporarily out of favour. A bricks-and-mortar retailer losing permanent market share to e-commerce is structurally impaired. Both may screen as low-P/E stocks. Only one is a value opportunity.
Classifying industry-wide selloffs before applying any valuation multiple is the discipline that separates genuine value identification from value trap exposure: a bank whose lending margins remain intact during a rate scare belongs in a different analytical category than a retailer losing permanent market share to e-commerce, even if both print similar P/E ratios on a screen.
Fidelity’s July 2024 analysis raised a further complication: interpreting valuation metrics becomes harder in shifting rate environments because the correct P/E depends on discount rates and growth expectations that many retail investors do not model explicitly. A stock that looked cheap in a low-rate environment may be fairly priced or expensive when rates are higher.
Four concrete cautions for retail investors:
- Patience requirement: Value investing can underperform for long stretches, particularly in technology-driven markets. The post-2009 growth era demonstrated this over more than a decade.
- Value trap risk: Simple low-multiple screens can produce value traps if business quality and balance sheet health are ignored.
- Macro complexity: The “correct” P/E level shifts with interest rates and inflation, adding a layer of analytical difficulty many retail investors underestimate.
- Quality-aware approach: Most research now recommends combining value screens with profitability and quality filters, or defaulting to diversified value ETFs, rather than relying on simple P/E screens alone.
Value investing in practice: stock picking versus value index funds
The traditional approach to value investing involves selecting individual stocks through deep fundamental analysis, monitoring them over time, and holding through periods of underperformance. Buffett, whose leadership at Berkshire Hathaway transitioned to Greg Abel at the end of 2025, built one of the most successful track records in history through concentrated, conviction-driven positions. Dodge & Cox has followed a similar philosophy, adding to out-of-favour healthcare and energy names while trimming winners, according to Barron’s.
Individual stock picking requires specific capabilities:
- Significant time for reading financial statements, earnings calls, and industry analysis
- Analytical skill in interpreting valuation metrics relative to sector context and macro conditions
- Ongoing monitoring of portfolio holdings for changes in business quality
- Emotional discipline to hold positions during extended periods of underperformance
For investors without the time or inclination for that depth of analysis, value-focused ETFs and index funds apply value screens automatically at low cost. They also provide diversification that reduces the damage any single value trap can inflict on a portfolio.
The decision between stock picking versus ETFs is not purely about analytical capacity; it also turns on cost compounding, concentration risk, and tax treatment, with passive index ETFs outperforming approximately 80% of active funds on a net-of-fees basis in 2025, a figure that sets the baseline any individual stock-picker must clear to justify the effort.
| Fund name / ticker | Index tracked | Geographic focus | Notable feature |
|---|---|---|---|
| Vanguard Value ETF (VTV) | CRSP US Large Cap Value | U.S. large cap | Low expense ratio, broad core value holding |
| iShares Russell 1000 Value ETF (IWD) | Russell 1000 Value | U.S. large cap | Deep liquidity, close index tracking |
| Schwab U.S. Large-Cap Value ETF (SCHV) | Dow Jones U.S. Large-Cap Value | U.S. large cap | Very low expense ratio |
| Vanguard Small-Cap Value ETF (VBR) | CRSP US Small Cap Value | U.S. small cap | Higher volatility, higher long-term return potential |
As U.S. News & World Report noted, buying a diversified value ETF is often easier than judging whether an individual low-P/E stock is a bargain or a value trap. For most retail investors without time for deep fundamental work, a rules-based value ETF is likely the more practical starting point.
How to decide if value investing fits your situation
Understanding the strategy in the abstract is not the same as knowing whether it suits a specific investor’s circumstances. Suitability depends on three personal factors, not financial resources:
- Time horizon: Value investing often requires holding through multi-year periods of underperformance relative to the broader market. A minimum horizon of 5 years or more is typical.
- Tolerance for relative underperformance: Watching a portfolio lag growth benchmarks for quarters or years at a time tests conviction. Mohnish Pabrai, in an April 2024 interview with the Economic Times, emphasised that high-conviction concentrated value investing demands significant patience and tolerance for short-term pain.
- Analytical capacity or willingness to delegate: Either commit time to fundamental analysis using the metrics covered above, or delegate that work to a rules-based value fund.
Value investing is not an all-or-nothing commitment. Many investors hold a core allocation to broad market index funds alongside a tilt toward value, rather than building a pure value portfolio. Morningstar’s Amy Arnott noted in November 2024 that combining value with quality and profitability screens improves outcomes but increases analytical complexity, reinforcing why ETFs are often the more realistic starting point for individual investors.
Berkshire Hathaway held more than $180 billion in cash in 2024 rather than deploy capital at unattractive valuations, illustrating that patience and selectivity are structural features of the value investing approach rather than temporary hesitations.
The practical first step is straightforward: either run a basic screen using the P/E, FCF yield, and debt-to-equity thresholds outlined in this guide, or research one of the value ETFs listed above. Both paths lead to the same destination: an evidence-based approach to equity investing that has earned its track record over decades.
Value investing has earned its reputation, but only for investors who use it correctly
Value investing is a coherent, evidence-backed strategy with a long track record. It is not a relic. But it requires the right tools (the three core metrics and an understanding of their limitations), the right mindset (patience and a quality filter that prevents value trap exposure), and the right vehicle (individual stocks for those with the capacity, value ETFs for those without).
The rotation visible in early 2026, with value outperforming growth by more than 11 percentage points year-to-date, is a reminder that style cycles turn. Investors who abandoned the approach during its recent underperformance may have exited at precisely the wrong time.
Start with the metrics table above or explore one of the listed value ETFs. The first step is achievable regardless of experience level. The strategy rewards those who understand it clearly and apply it with discipline.
This article is for informational purposes only and should not be considered financial advice. Investors should conduct their own research and consult with financial professionals before making investment decisions. Past performance does not guarantee future results.