Bendigo and Adelaide Bank shares sit at an 11.8x price-to-earnings multiple. The broader Australian banking sector averages roughly 18x. If that gap closed, the arithmetic points to a share price closer to $15 than $10. With BEN trading near $10.28 in late May 2026, following a cash earnings decline of 8.4% in FY25, Australian investors face a genuine interpretive challenge: is this a value opportunity the market has overlooked, or is the discount structurally deserved? This analysis applies two independent valuation frameworks, the PE ratio comparison and the Dividend Discount Model (DDM), to BEN’s reported financials, walks through how franking credits alter the DDM output, and explains what the range of results actually tells investors about the risk embedded in each assumption.
Why BEN trades at a discount before you run any model
Before applying any valuation formula, the discount itself needs explaining. Regional banks including BEN have carried a persistent PE discount to the big four for years, and the reasons are structural rather than cyclical. Four factors drive the gap:
- Lower return on equity (ROE): Smaller scale and higher cost-to-income ratios compress profitability relative to CBA, NAB, ANZ, and Westpac
- Earnings concentration: Greater exposure to specific customer segments and geographies implies higher perceived risk
- Limited diversification: Minimal contribution from wealth management, institutional banking, or capital markets activities
- Funding cost disadvantage: Higher wholesale funding reliance and reduced access to cheap retail deposit bases
The majors command higher multiples because their earnings quality is broader. BEN lacks the revenue streams that inflate those multiples.
BEN’s NIM and ROE profile sits in an instructive position relative to the sector: a reported NIM of 1.90% above the major bank average of 1.78% coexists with a cash ROE of 7.9% that trails the sector average of 9.35%, a combination that helps explain why capital adequacy metrics look sound while earnings efficiency remains under pressure.
What the FY25 earnings decline signals about forward assumptions
BEN’s FY25 cash earnings after tax came in at $514.6 million, down 8.4% year-on-year. That decline is not a one-off data point. It directly shapes the forward earnings-per-share estimate that any PE model requires.
A still-healthy Common Equity Tier 1 (CET1) ratio of 11.00% at 30 June 2025 signals capital adequacy, meaning BEN is not in distress. Yet declining profitability and a strong capital position can coexist; the first reflects margin and competitive pressure, the second reflects regulatory compliance. Investors who conflate capital strength with earnings momentum risk overestimating the EPS trajectory that drives both models below.
When big ASX news breaks, our subscribers know first
What BEN’s PE ratio says about its share price
The PE ratio divides a company’s share price by its earnings per share. Its inverse application asks a different question: if a company earned a given EPS and deserved a given multiple, what should the share price be?
BEN’s FY24 earnings per share came in at $0.87. At a share price of approximately $10.28, the implied PE multiple is 11.8x. The Australian banking sector average sits near 18x.
Applying the sector average to BEN’s EPS produces a sector-adjusted valuation of $15.52 per share (18 x $0.87).
| Input | BEN Value | Sector Benchmark | Implied Valuation |
|---|---|---|---|
| Earnings per share | $0.87 | $0.87 | — |
| PE multiple | 11.8x | 18x | — |
| Sector-adjusted price | $10.28 | — | $15.52 |
The gap between $10.28 and $15.52 looks compelling at first glance. It implies more than 50% upside.
Whether the sector average multiple is the correct benchmark for a bank with declining earnings and structural constraints is the question the PE model cannot answer on its own. The $15.52 figure assumes BEN deserves the same multiple as the sector. The structural factors outlined above give strong reasons to doubt that premise.
PE ratio limitations for bank stocks become especially visible when NIM trajectories are diverging across the sector: a uniform 18x multiple applied to banks with very different margin outlooks and regulatory exposures produces valuations that look comparable on screen but embed materially different earnings risk.
How the Dividend Discount Model works and why it suits bank shares
The DDM is a present-value framework. It takes a company’s expected future dividends, assumes they grow at a steady rate, and discounts them back at a required rate of return to arrive at a fair value today. The logic is straightforward: a share is worth the sum of all future cash it will pay the holder, adjusted for the time value of money.
Three steps define the calculation:
- Establish the dividend baseline: Determine the current annual dividend per share from the most recent full-year results
- Apply growth and risk rate assumptions: Select a long-term dividend growth rate and a required rate of return (the discount rate reflecting risk)
- Discount to present value: Divide the projected next-year dividend by the difference between the required return and the growth rate
Banks are particularly well-suited to DDM analysis because they distribute a high and predictable share of earnings. BEN paid a total of 63 cents per share in FY25: an interim dividend of 30 cents (fully franked) and a final dividend of 33 cents (fully franked). The dividend stream is the most direct link between fundamental value and shareholder return for a bank like BEN.
Franking credits and their effect on BEN’s effective dividend yield
Franking credits are an Australian-specific complication that can materially change the DDM output. When a company pays a fully franked dividend, eligible Australian shareholders receive a tax offset equal to the corporate tax already paid on that dividend. This effectively grosses up the cash dividend.
For BEN, the $0.63 cash dividend grosses up to approximately $0.93 per share once franking credits are included. This higher figure feeds into the DDM’s numerator, producing a meaningfully different valuation.
The franking credit calculation follows a standard 30/70 formula: a fully franked cash dividend is multiplied by 30 and divided by 70, so BEN’s $0.63 cash dividend yields a $0.27 credit, producing the $0.90 grossed-up figure that enters the DDM numerator for eligible Australian investors.
The relevance of this adjustment varies by investor type. Superannuation funds in the accumulation or pension phase benefit most, as they can claim the full credit or receive a refund. Foreign investors cannot claim Australian franking credits, making the grossed-up figure irrelevant to their return calculation.
The DDM sensitivity range and what each scenario assumes
A single DDM output is not a valuation. The model’s answer changes substantially depending on two inputs: the assumed growth rate and the required rate of return (risk rate). Varying these across plausible ranges produces a map of outcomes rather than a point estimate.
| Risk Rate | 2% Growth | 3% Growth | 4% Growth |
|---|---|---|---|
| 6% | $15.75 | $21.00 | $32.50 |
| 8% | $10.50 | $13.32 | $15.75 |
| 11% | $7.22 | $7.88 | $9.00 |
The full range spans from $7.22 (at an 11% risk rate and 2% growth) to $32.50 (at 6% risk and 4% growth). Three anchor estimates deserve attention:
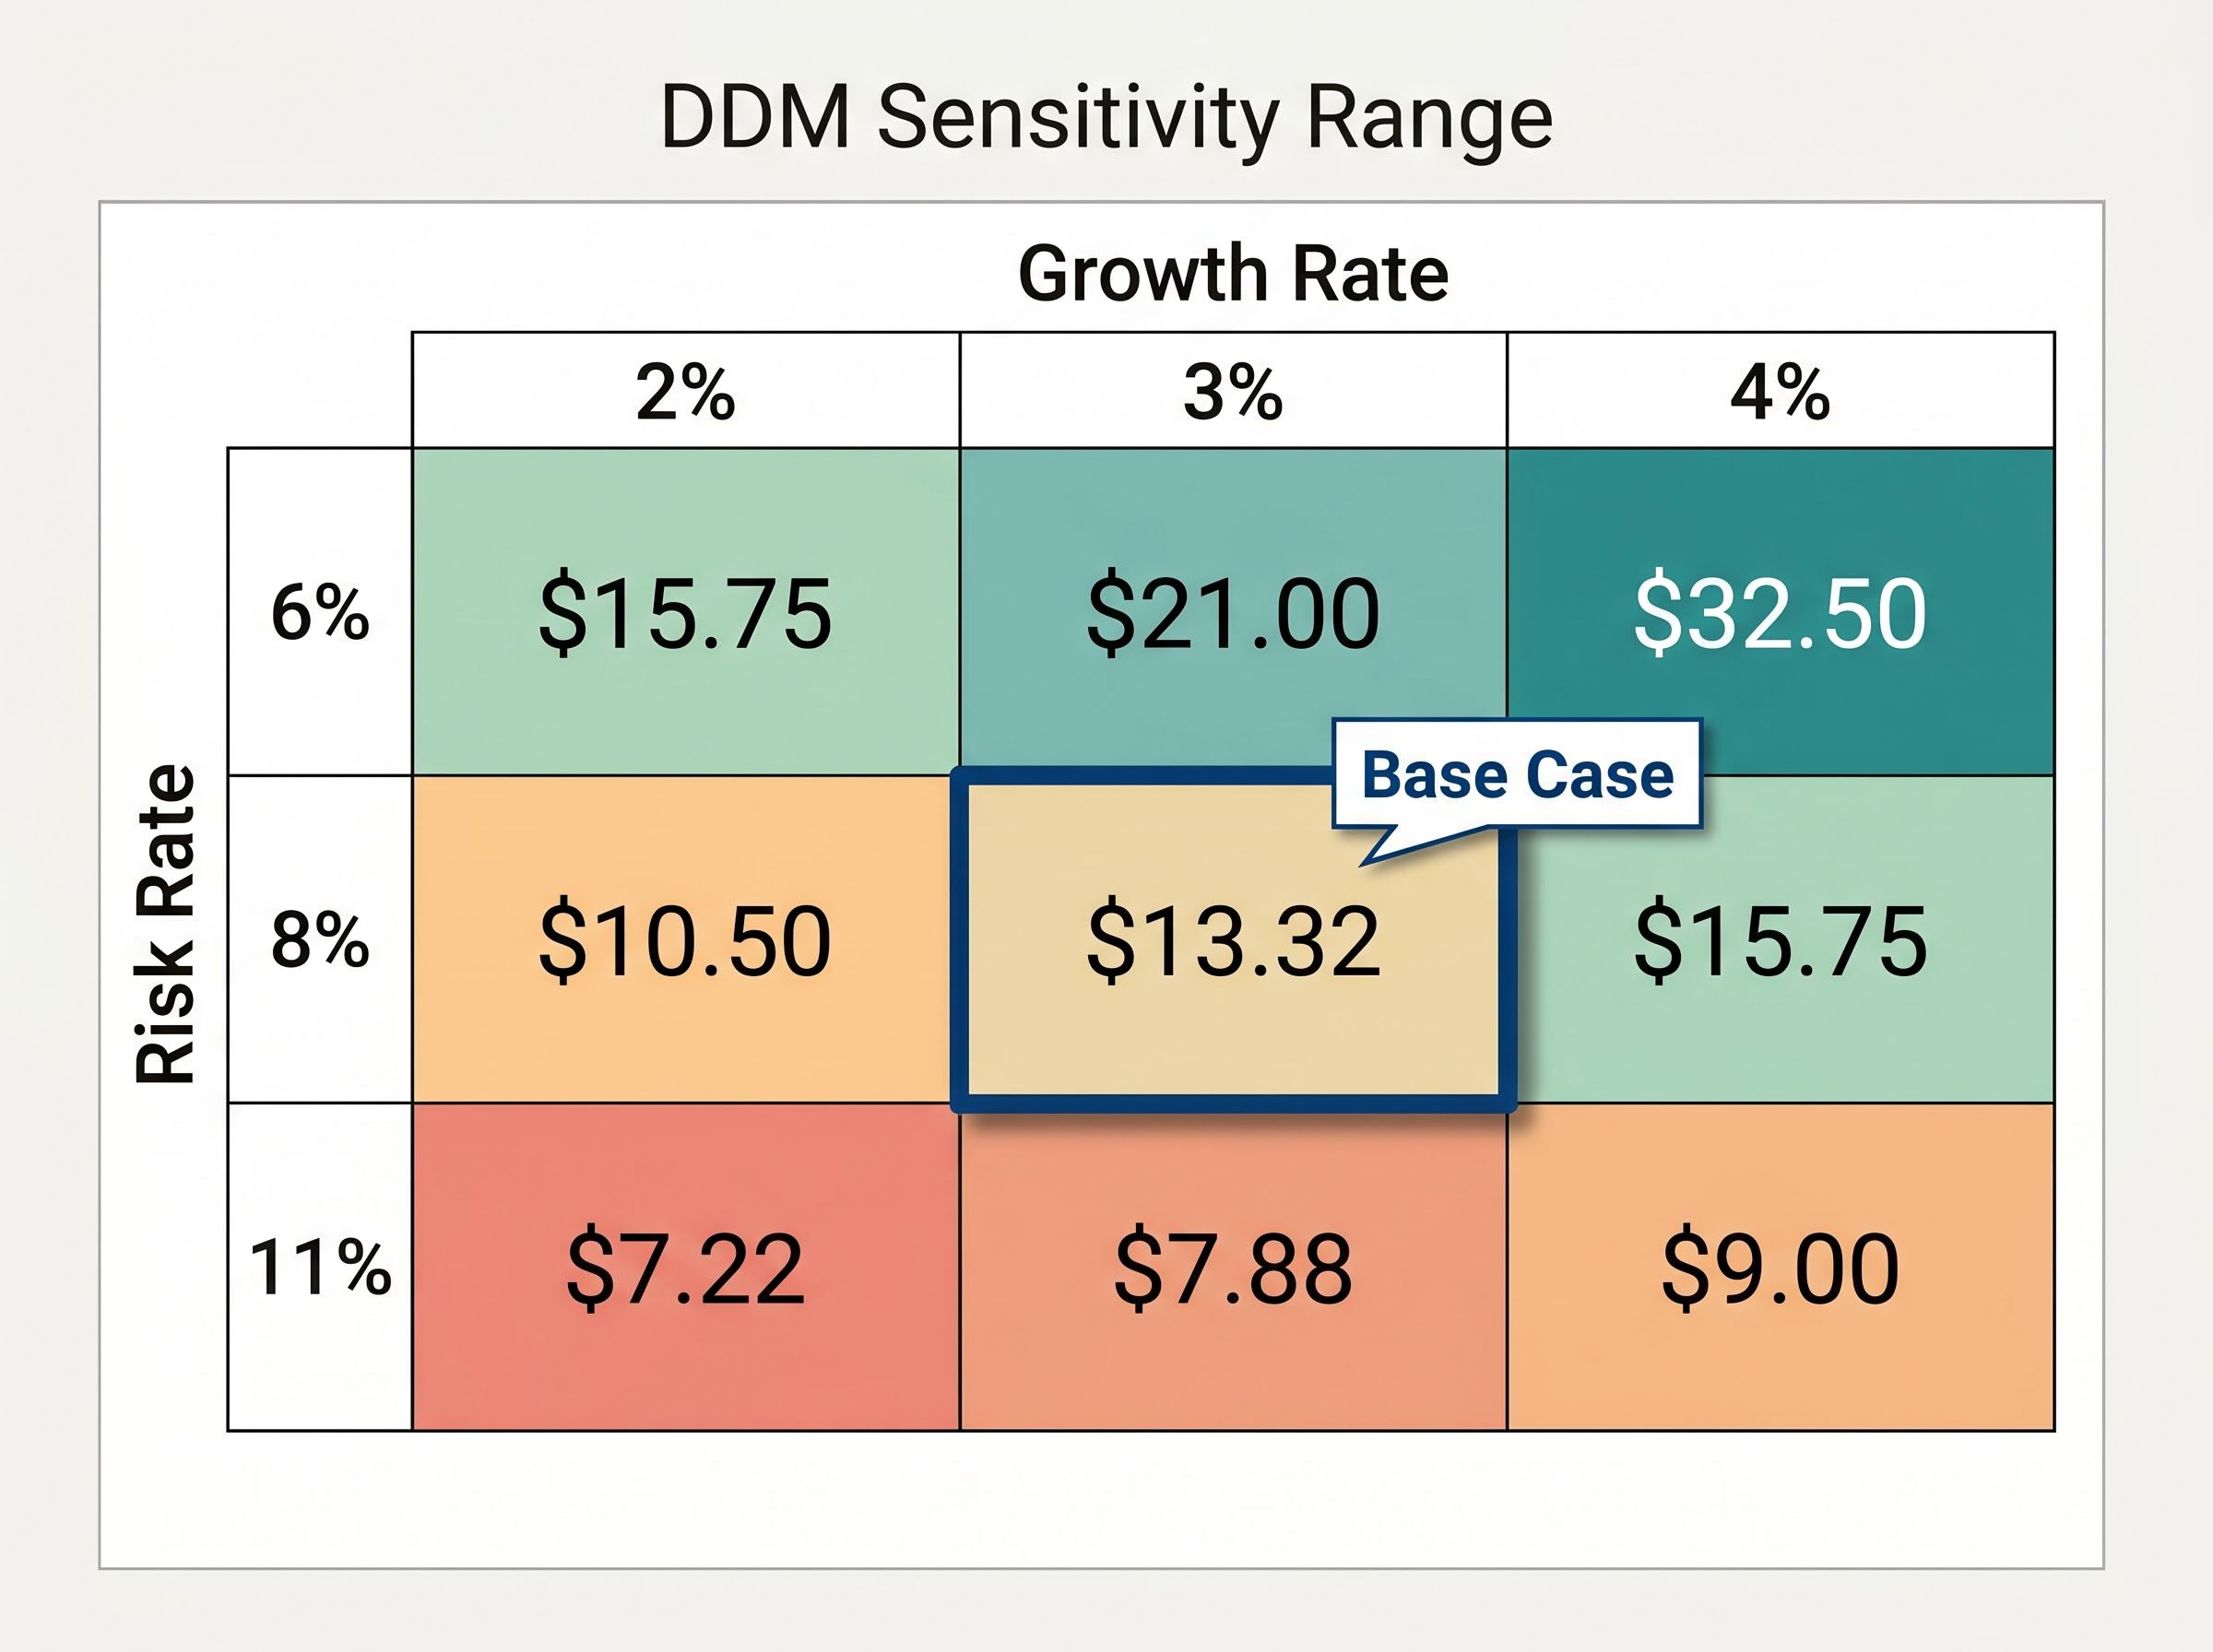
- $13.32 base case: The averaged estimate blending moderate growth and risk assumptions
- $13.75 forecast-dividend variant: Uses a projected $0.65 dividend rather than the trailing $0.63
- $19.64 franking-credit-adjusted case: Uses the grossed-up $0.93 dividend, most relevant to Australian superannuation investors
The averaged base case of $13.32 sits roughly 30% above the current $10.28 share price. That gap is meaningful, but it is not wide enough to treat as a margin of safety without additional conviction in the growth assumptions underpinning the model.
Each number in the table corresponds to a specific set of beliefs about BEN’s future. Investors who believe earnings stabilise and dividends grow at 3% in a moderate risk environment arrive at the $13.32 range. Those who expect margin compression and rising credit costs land closer to the bottom of the table. The model does not choose between these views; it maps where each one leads.
What analyst consensus and qualitative signals add to the picture
The May 2026 analyst consensus for BEN ranges from $9.75 to $11.90, with an average target of $10.82. That average sits well below both the PE-implied $15.52 and the DDM base case of $13.32.
The gap between the model outputs and analyst targets is itself informative. Morningstar rates BEN at three stars (fair value), broadly equivalent to a hold rating, based on a discounted cash-flow approach anchored on through-the-cycle return on equity. Institutional analysts may be embedding the structural discount factors directly into their models, producing targets that reflect BEN’s actual competitive position rather than a hypothetical sector-average valuation.
Qualitative factors no model fully captures
Three risk overlays sit beyond the reach of any purely quantitative framework:
- Credit quality trajectory: Mortgage arrears have risen modestly from trough levels. The direction matters more than the current level; a continued rise would pressure provisioning and reduce distributable earnings.
- Funding mix: BEN’s reliance on wholesale funding relative to cheaper retail deposits compresses margins when wholesale rates rise. This structural feature limits NIM expansion even in a higher-rate environment.
- Loan growth trajectory: Industry data for 2024-2025 points to low-to-mid single-digit housing credit growth. For BEN, growth that is too slow signals stagnation; growth that is too fast signals risk appetite that may not be rewarded.
The Financial Accountability Regime (FAR), which commenced for authorised deposit-taking institutions on 15 March 2024, reinforces a conservative management posture across the banking sector. For BEN, this regulatory backdrop tends to cap aggressive growth and leverage strategies, which in turn constrains the dividend growth assumptions that drive DDM valuations higher.
Investors who want to move beyond the model outputs and into the qualitative layer will find our comprehensive walkthrough of stress-testing a bank valuation covers credit quality trajectories, arrears thresholds, NIM assumptions, and capital adequacy checks against APRA benchmarks, with a worked example that applies the full framework to a live ASX bank result.
APRA’s Financial Accountability Regime guidance for ADIs sets out the accountability obligations and governance standards that replaced the Banking Executive Accountability Regime from 15 March 2024, embedding a compliance posture across the sector that limits the kind of aggressive growth strategies which would otherwise support faster dividend growth assumptions in DDM models.
What the models collectively reveal about BEN’s risk-reward profile
Both frameworks point in the same direction. The PE comparison suggests $15.52. The DDM base case suggests $13.32. The franking-adjusted DDM reaches $19.64. All sit above the current price of $10.28.
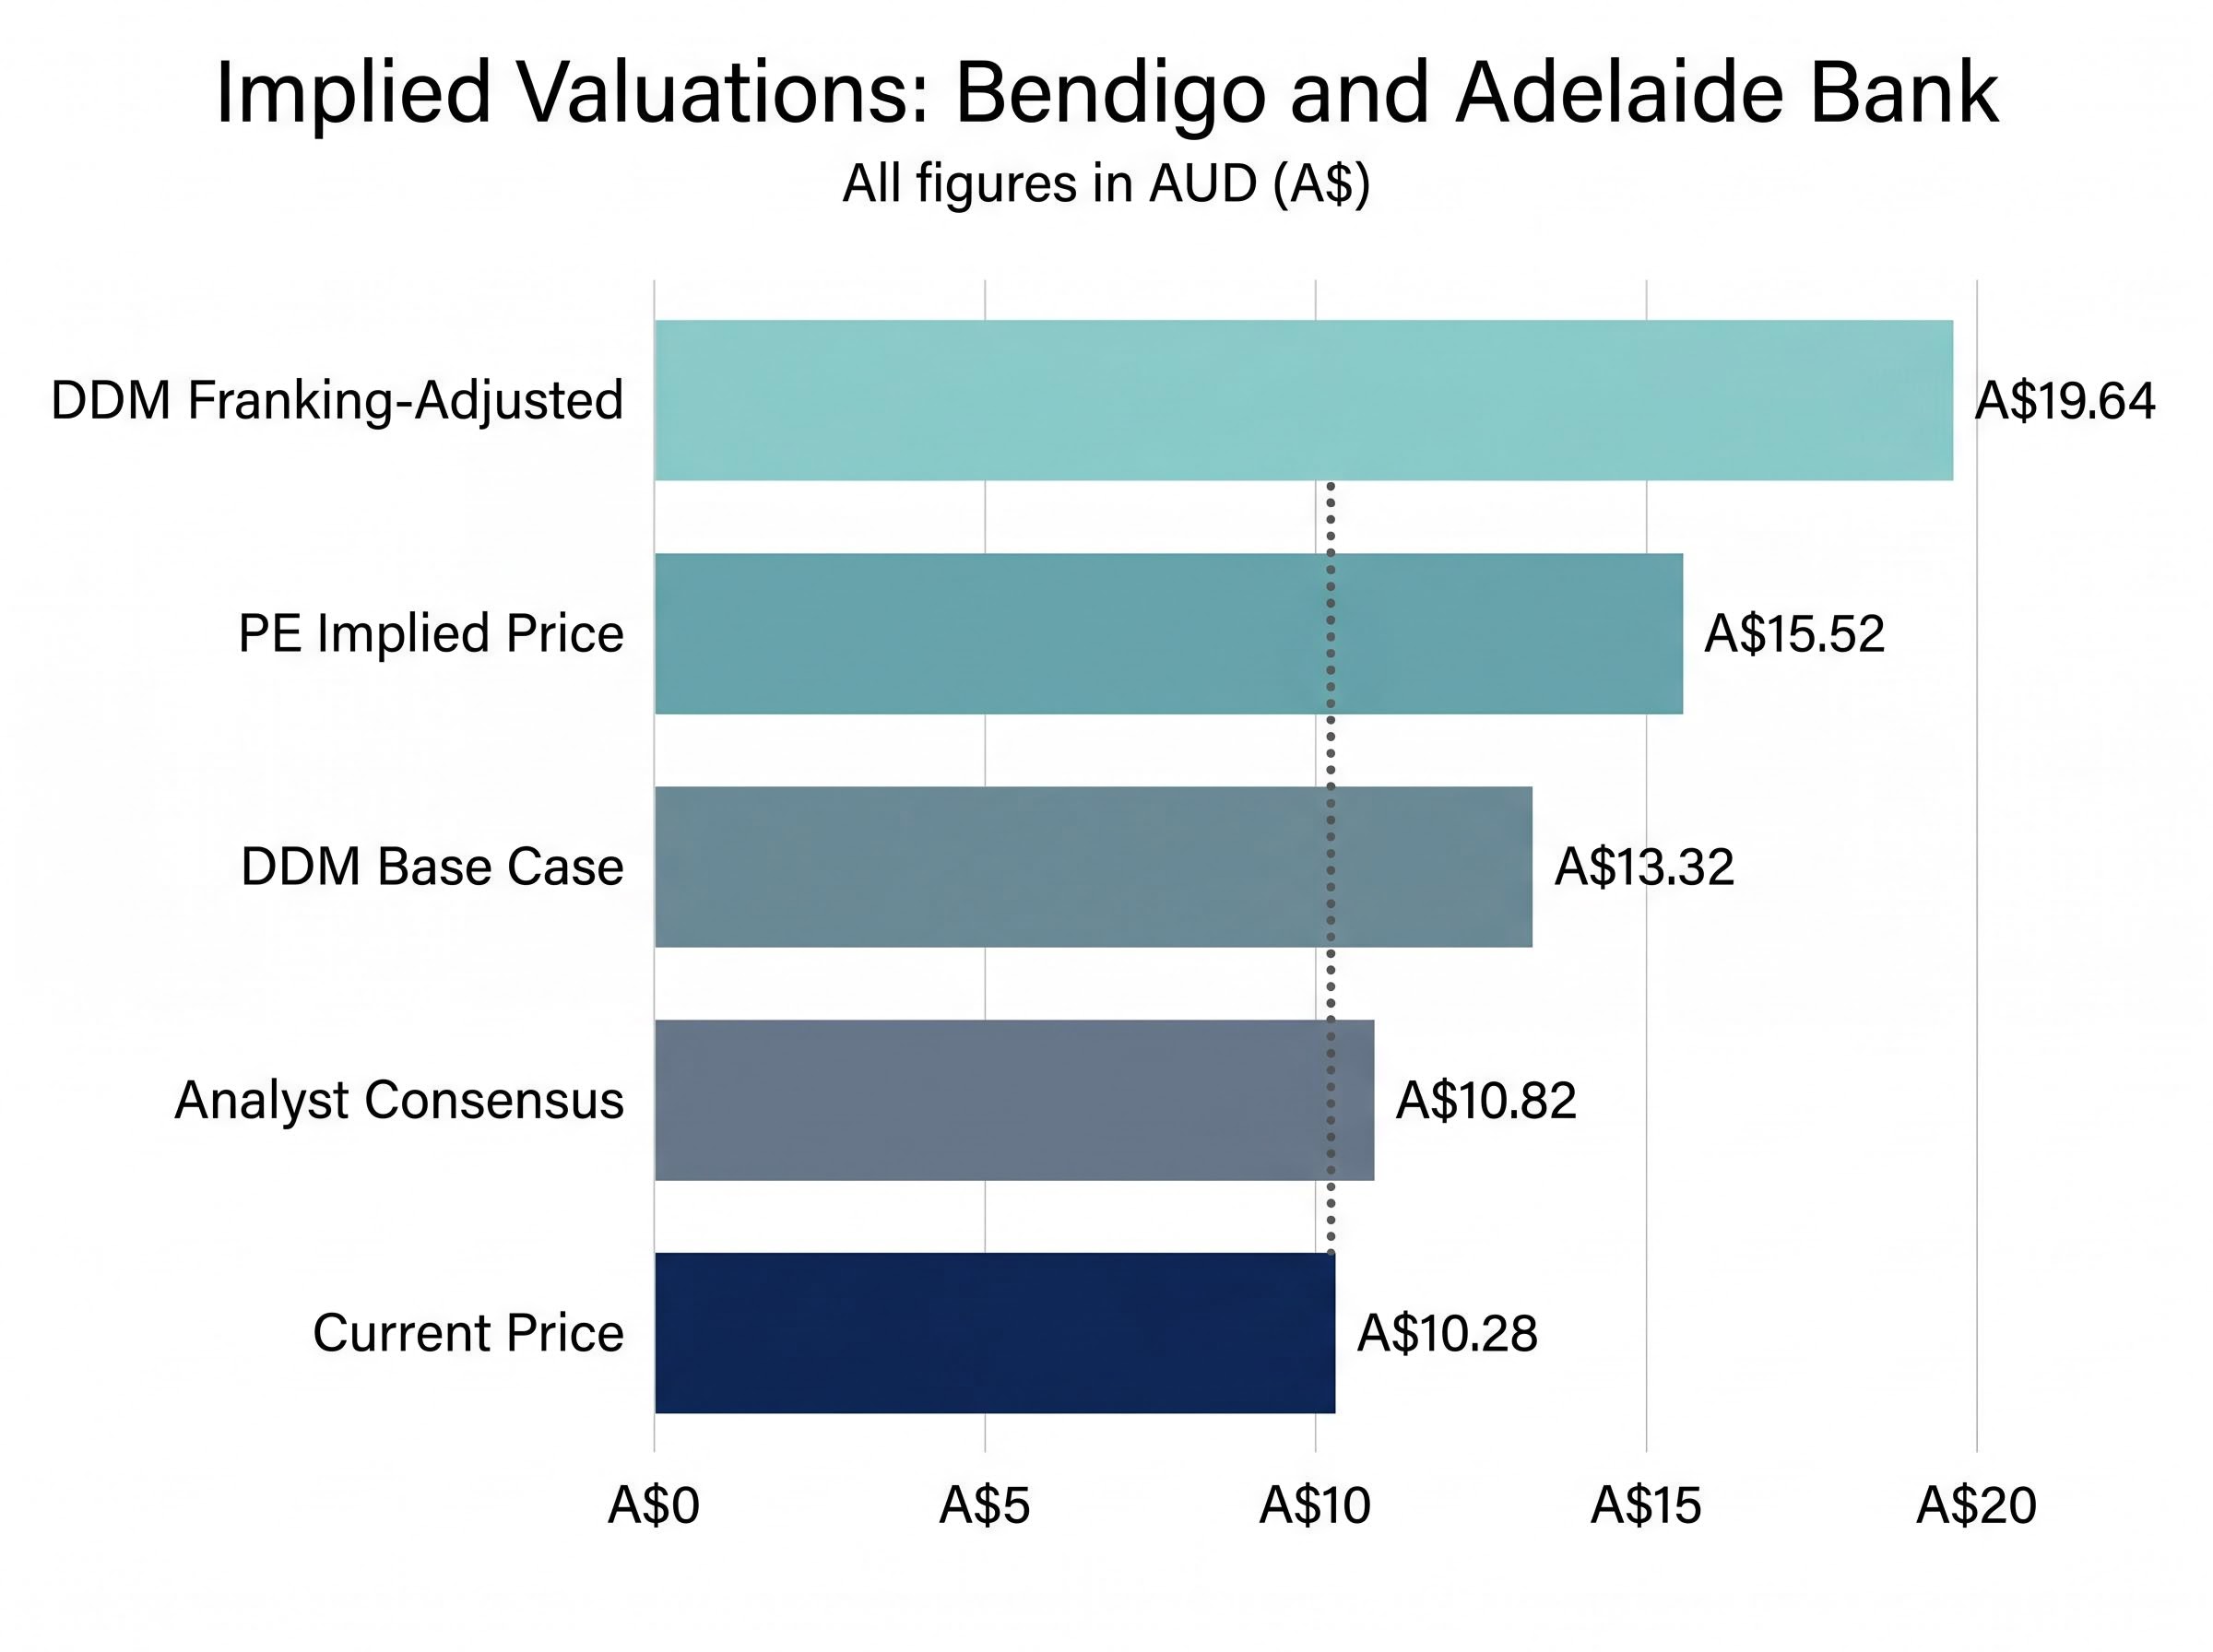
| Valuation Method | Implied Price | Key Assumption | Confidence Qualifier |
|---|---|---|---|
| PE ratio | $15.52 | Sector PE of 18x | Assumes BEN deserves sector multiple |
| DDM base case | $13.32 | Blended growth and risk rates | Relies on dividend stability |
| DDM franking-adjusted | $19.64 | Gross dividend of $0.93 | Most relevant to super funds |
| Analyst consensus | $10.82 | Embedded structural discount | Market-informed view |
The investment case is conditional. If BEN stabilises earnings and sustains its dividend through the credit cycle, the gap between $10.28 and the $13-$15 range has a reasonable fundamental basis. If earnings deterioration continues, the models converge toward current prices or below.
Both the PE ratio and the DDM point above current prices. Neither accounts for the risk that earnings continue to decline. The analyst consensus of $10.82 suggests the market is already pricing in structural headwinds that the models, by design, treat as adjustable inputs.
The analyst consensus average of $10.82 serves as a sober final reference. It sits just 5% above the current share price, implying the market assigns a far smaller premium to BEN than either model’s central estimate. That does not make the models wrong. It means the market is pricing in the structural constraints at a level the models leave to the user’s discretion.
Valuation models are a starting point, not a verdict
Both the PE ratio comparison and the DDM are tools for structuring the question, not answering it definitively. The range of outputs, from $7.22 at the pessimistic end to $19.64 at the franking-adjusted end, reflects real uncertainty about BEN’s earnings trajectory, dividend sustainability, and competitive position.
The quantitative work must be accompanied by qualitative scrutiny. Examining the half-year results for net interest margin trends, checking BEN’s provisioning methodology against rising arrears, and understanding the funding mix are the steps that separate an informed view from a model-dependent one.
The valuation gap between $10.28 and the model range is wide enough to warrant serious analysis. It is not so wide as to eliminate the need for it.
This article is for informational purposes only and should not be considered financial advice. Investors should conduct their own research and consult with financial professionals before making investment decisions. Past performance does not guarantee future results. Financial projections are subject to market conditions and various risk factors.