Two survey readings released this week upend a persistent recession narrative. The US economy is not merely avoiding contraction; it is accelerating across both its factory floors and service counters simultaneously, at a moment when the rest of the developed world is moving in the opposite direction. The S&P Global May 2026 flash Purchasing Managers Index (PMI) data show US manufacturing at 55.3 and services at 50.9, both above the critical 50 expansion threshold. These readings arrive against a backdrop that includes a 33% recession probability from the April 2026 Wall Street Journal economist survey, a Q1 GDP rebound to 2.0% annualised, and services sectors in outright contraction across the UK (47.9) and the Eurozone (46.4). What follows explains what the numbers mean, why the global divergence matters for assessing US economic health, how confirmed macro data either supports or complicates the expansion signal, and which upcoming releases investors should watch.
US manufacturing and services both signal expansion in May
The headline numbers from S&P Global’s May 2026 flash release tell two stories of expansion, one considerably louder than the other.
- Manufacturing PMI: 55.3 (S&P Global May 2026 flash)
- Services PMI: 50.9 (S&P Global May 2026 flash)
- Q4 2025 GDP: 0.5% annualised (the recent low-water mark)
- Q1 2026 GDP: 2.0% annualised (BEA advance estimate)
55.3 in manufacturing represents a pace of expansion well above the neutral threshold, signalling that new orders, output, and supplier activity are all moving decisively in the growth direction.
The manufacturing reading commands attention. At 55.3, it sits meaningfully above the 50 line that separates expansion from contraction, suggesting factory-sector momentum that aligns with the broader GDP rebound from 0.5% in Q4 2025 to 2.0% in Q1 2026.
The S&P Global May 2026 flash PMI release includes commentary from the firm’s Chief Business Economist noting broad-based gains across new orders and output components, providing the sub-index detail that underlies both the 55.3 manufacturing and 50.9 services composite figures.
Services at 50.9 tells a more cautious story. It is expansion, but only just. A margin of less than one point above the threshold means any softening in the next monthly reading could push the sector back into contraction territory. For an economy where services account for the majority of output, that narrow buffer matters.
When big ASX news breaks, our subscribers know first
What PMI readings above 50 actually tell us, and why 55.3 is notable
The PMI is a monthly survey of purchasing managers across a given sector. It measures the direction of change in business conditions, not the absolute level of economic activity. Any reading above 50 indicates that conditions are improving relative to the prior month; any reading below 50 indicates deterioration.
How to read a PMI number
The 50 mark is the dividing line. Above it, the sector is expanding. Below it, the sector is contracting. The further a reading sits from 50 in either direction, the stronger the signal.
The index combines responses across five business conditions:
- New orders
- Output
- Employment
- Supplier delivery times
- Inventories
These components are weighted into a single composite figure. Flash estimates, such as the May 2026 readings, are preliminary and based on roughly 85-90% of total survey responses. They are subject to revision when the final data is published.
PMI market pricing mechanics explain why the May 2026 readings are likely to move individual equities and sector ETFs less through their absolute level than through the gap between the actual print and where consensus was positioned before the release.
A reading of 55.3 does not simply mean manufacturing is growing. It means purchasing managers are reporting conditions improving at a pace well above neutral, with broad-based gains across the survey’s components. By contrast, 50.9 in services confirms directional improvement but at a rate that leaves very little margin before the signal turns negative.
While the US expands, Europe and the UK are heading in the opposite direction
The starkest contrast sits in services. The Eurozone’s May 2026 flash services PMI printed at 46.4, firmly in contraction, while the US registered 50.9 in the same sector during the same survey window. That is not a narrow gap; it is the difference between an economy whose largest sector is shrinking and one whose largest sector is, however modestly, still growing.
The UK confirms the pattern is not isolated to the continent. Its services PMI came in at 47.9, also below the 50 threshold, marking a second major developed economy where the services sector is losing ground.
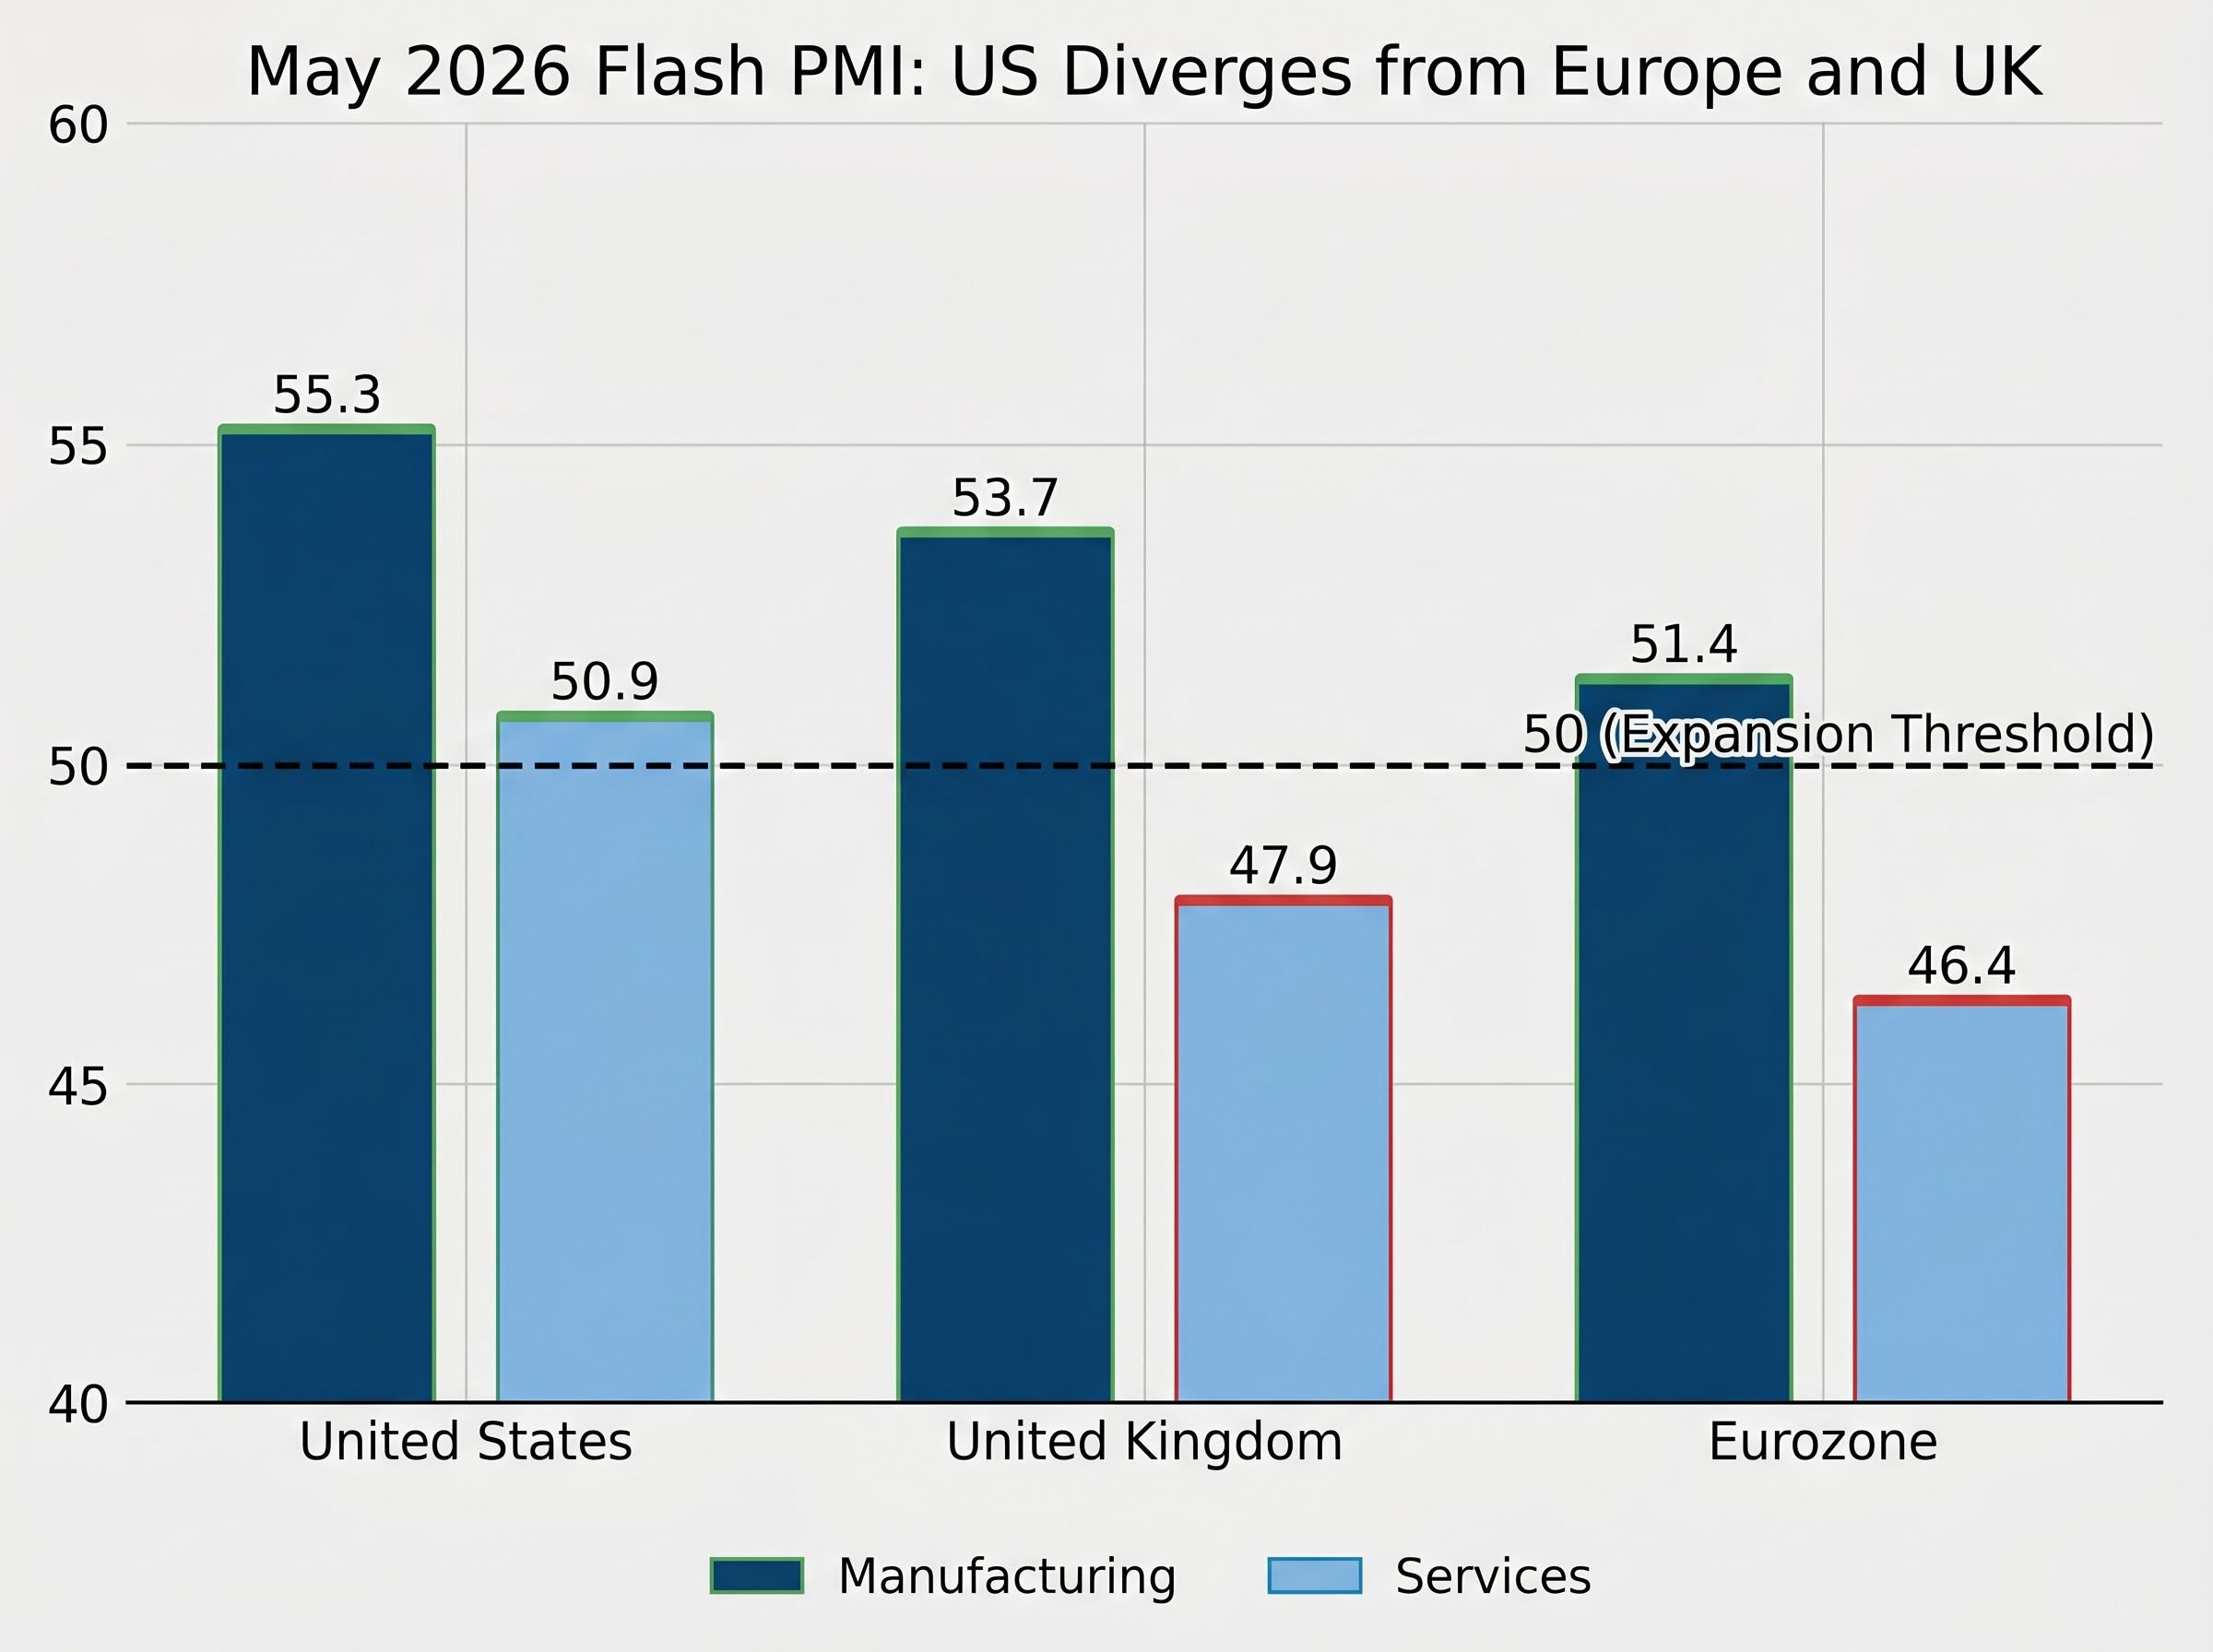
| Economy | Manufacturing PMI | Services PMI | Sector status |
|---|---|---|---|
| United States | 55.3 | 50.9 | Both expanding |
| United Kingdom | 53.7 | 47.9 | Manufacturing expanding; services contracting |
| Eurozone | 51.4 | 46.4 | Manufacturing expanding; services contracting |
Manufacturing tells a less dramatic but still relevant story. UK manufacturing at 53.7 and Eurozone manufacturing at 51.4 both sit in expansion territory, yet their services sectors are dragging on overall economic momentum. The US is the only economy among the three where both sectors are expanding simultaneously, a divergence that carries direct implications for currency movements, equity allocation, and bond positioning for investors with international exposure.
The global economic split visible in May 2026 PMI readings has been building across a longer runway: UK Q1 2026 GDP grew 0.6% quarter-on-quarter while the Eurozone managed just 0.1%, a gap that was already established in hard output data before the latest survey readings arrived to confirm it.
The macro backdrop: what confirmed data says about US economic health
Survey-based signals gain weight when hard data moves in the same direction. In Q1 2026, it did.
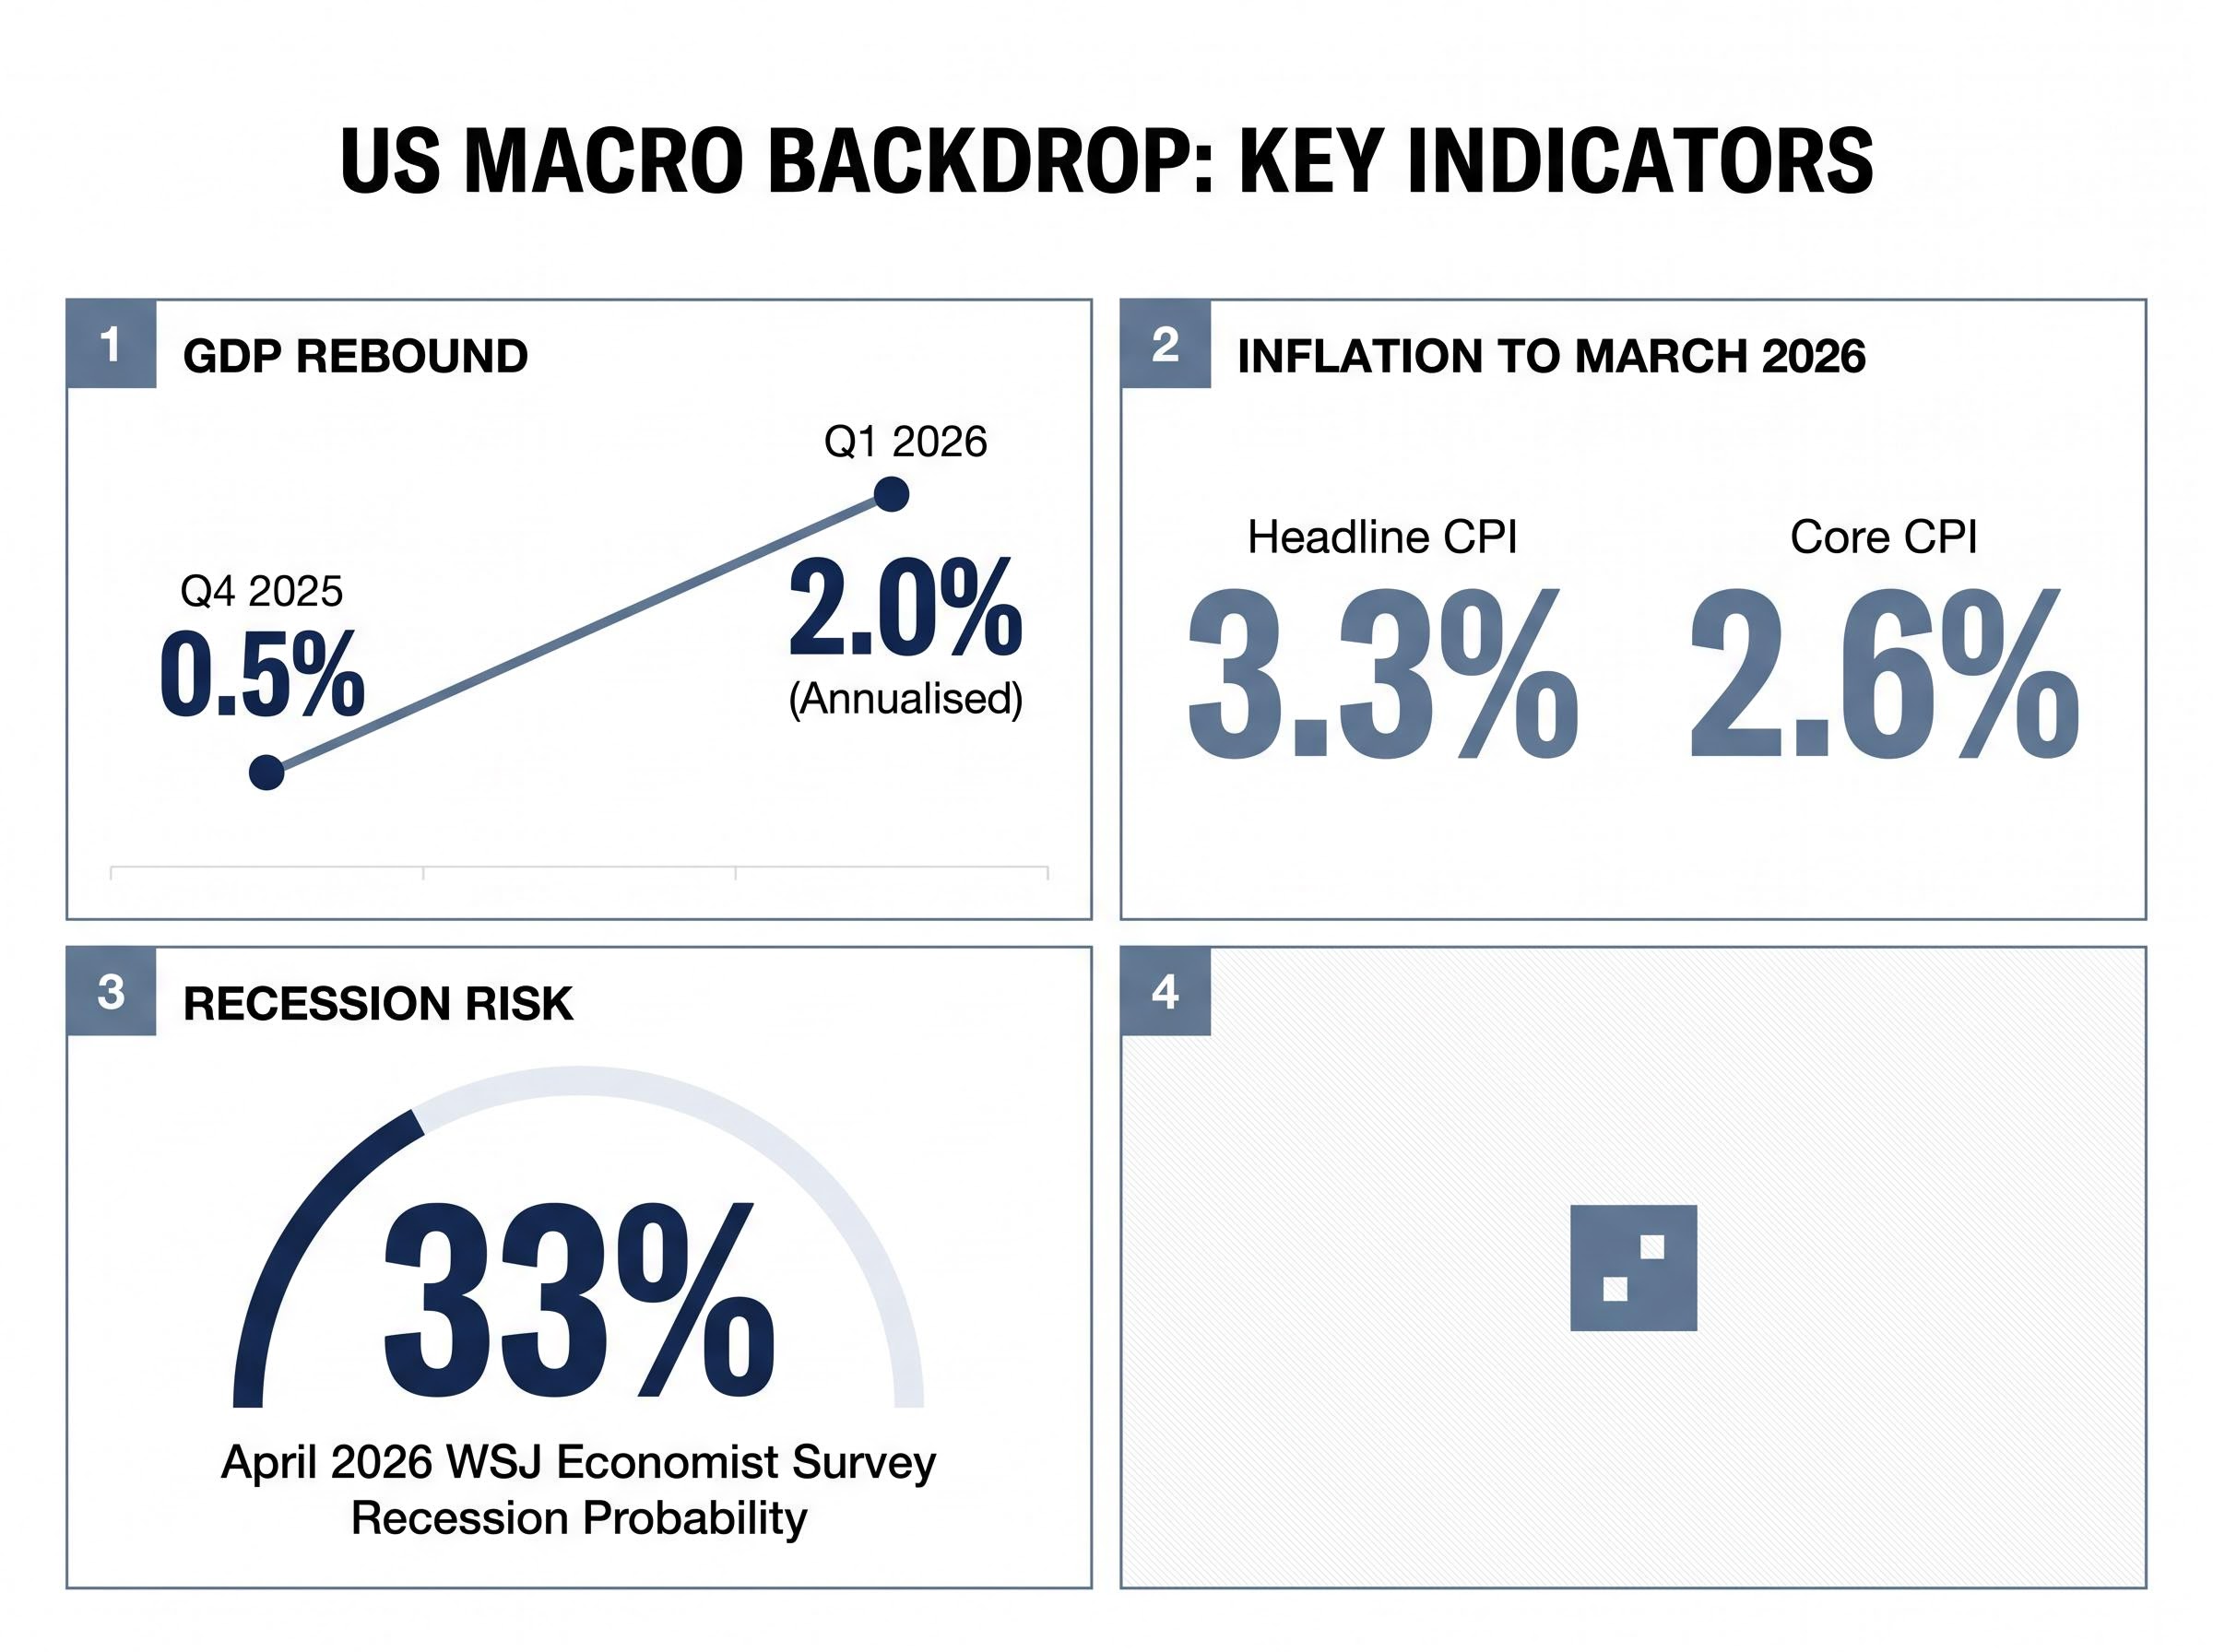
- Q1 2026 real GDP: grew at 2.0% annualised, rebounding sharply from 0.5% in Q4 2025
- Business fixed investment: accelerated, driven particularly by AI-related capital expenditure
- Average hourly earnings growth: 3.5% in the year to March 2026
- Unemployment: at or near full employment levels
AI-related capital expenditure was the primary engine behind business fixed investment accelerating at 10.4% annualised in Q1 2026, with information processing equipment alone growing 43.4% as hyperscaler infrastructure spending flowed directly into the national accounts.
The US Treasury’s Q2 2026 economic policy statement to the Treasury Borrowing Advisory Committee (TBAC) described the economy as “resilient” with a “favourable” outlook, attributing the Q1 pickup to faster business investment, recovery from the prior federal government shutdown, and a less negative inventory contribution.
Treasury assessment: The US economy was characterised as “resilient” with a “favourable” outlook in the Department of the Treasury’s Q2 2026 TBAC statement.
Where inflation and recession risk fit in
The complicating signals sit in the price data. Headline CPI reached 3.3% in the 12 months to March 2026, elevated by energy price shocks linked to the Iran conflict. Core CPI, which strips out food and energy, came in at 2.6% over the same period, a gap that illustrates the extent to which geopolitical energy disruption, rather than broad-based price pressure, is driving the headline figure.
The Treasury has noted that increased US domestic oil production provides a buffer against energy price volatility, but the 3.3% headline reading remains a live concern for monetary policy and consumer purchasing power.
The April 2026 WSJ economist survey placed the average 12-month recession probability at 33%. That figure is relatively low by historical crisis standards, yet elevated compared to the pre-2025 baseline, reflecting residual uncertainty even as the hard data tilts constructive.
The next major ASX story will hit our subscribers first
What the upcoming data pipeline will either confirm or complicate
The PMI readings are a forward-looking signal, not a verdict. Three upcoming releases will determine whether the expansion story holds up against harder evidence.
- Q1 2026 GDP revision: The BEA advance estimate of 2.0% annualised is subject to revision as more complete source data becomes available. An upward revision would reinforce the rebound narrative; a downward revision would reopen questions about underlying momentum.
- April 2026 durable goods orders: Published by the Census Bureau, this release provides a direct read on business investment spending. Given that AI-related capital expenditure was a primary driver of Q1 GDP growth, durable goods data will test whether the investment surge visible in GDP is translating into sustained order flow. A strong print would corroborate the 55.3 manufacturing PMI; a weak one would suggest the survey may be running ahead of actual spending.
- China May PMI: Scheduled for release the following week, China’s manufacturing survey adds an international demand-side variable. For US export-facing manufacturers, Chinese factory activity directly affects order pipelines and forward production planning.
Investors acting on the PMI expansion signal alone are working with an incomplete picture. These three releases collectively provide the confirmation layer, or the complication, that the current data lacks.
Investors wanting to understand the structural factors keeping recession probability contained despite the energy price shock will find our deep-dive into global recession risk buffers, which walks through BCA Research’s seven-factor framework, explains why current GDP figures do not yet reflect the full Hormuz disruption, and identifies June 2026 as the point where the buffers begin to expire.
US economic exceptionalism is back on the table, with caveats
The convergence of dual-sector PMI expansion, a GDP rebound from 0.5% to 2.0%, and labour market strength at or near full employment makes a credible collective case for US economic resilience in May 2026. Set against services-sector contraction in the UK (47.9) and the Eurozone (46.4), the outperformance is not statistical noise; it is a measurable structural divergence.
Three factors prevent the picture from closing on unqualified optimism. Services at 50.9 leaves almost no cushion before the narrative shifts from dual expansion to a manufacturing-only story. Headline inflation at 3.3% remains a constraint on both consumer spending power and monetary policy flexibility. And the April durable goods data, not yet published, will reveal whether business investment intentions captured in surveys are converting into actual capital deployment.
The dual expansion signal is meaningful, but services at 50.9 leaves little room for deterioration before the narrative changes.
The data as it stands supports a more constructive view of US economic momentum than the 33% recession probability alone would suggest. Whether that view survives the next two weeks of releases will depend on the GDP revision, durable goods orders, and whether the narrow services expansion holds its ground.
This article is for informational purposes only and should not be considered financial advice. Investors should conduct their own research and consult with financial professionals before making investment decisions. Past performance does not guarantee future results. Financial projections are subject to market conditions and various risk factors.