Bank of Queensland trades at $6.26. Broker consensus clusters around $6.35. A straightforward dividend discount model, using the forward dividend estimate, produces a fair value north of $7. So is the stock cheap, or is the model flattering a bank that earns half the sector return on equity?
BOQ sits at an unusual intersection: a fully franked dividend yield that looks attractive on the surface, a turnaround strategy still in progress, and a return on equity of 4.7% against a sector average of roughly 9.35%. For retail investors applying a DDM (dividend discount model, a formula that estimates a stock’s fair value based on its expected future dividend payments) to screen for value, those inputs produce a wide and potentially misleading range of outputs unless the methodology is applied with care.
What follows is a live DDM analysis of BOQ. It explains why franking credits materially lift the calculated fair value, walks through the full scenario range, and shows what the numbers actually mean for investors trying to decide whether $6.26 is a genuine discount or a value trap dressed up in yield.
What BOQ actually looks like as a business before you model it
BOQ operates as a regional bank with approximately 200 branches, many run under an owner-manager model. Its loan book is overwhelmingly mortgage-weighted, with lending income accounting for roughly 93% of total revenue. The bank lacks the diversified fee income streams and scale advantages that underpin major bank profitability.
That structural position shows up in the numbers. BOQ’s net interest margin (NIM) of 1.56% sits below the ASX major bank peer average of 1.78%, and the gap has widened as the bank has ceded share in some east-coast mortgage markets rather than compete on aggressive pricing.
The metrics that matter before modelling begins
- NIM: 1.56% (versus 1.78% major bank peer average)
- ROE: 4.7% (versus 9.35% sector average)
- CET1 ratio: 10.7%, below the sector average, limiting dividend headroom without earnings improvement
- Revenue composition: approximately 93% lending income
- Culture score (Seek data): 2.6 out of 5 versus a sector benchmark of 3.1 out of 5, a longer-term signal on talent retention rather than a short-term valuation driver
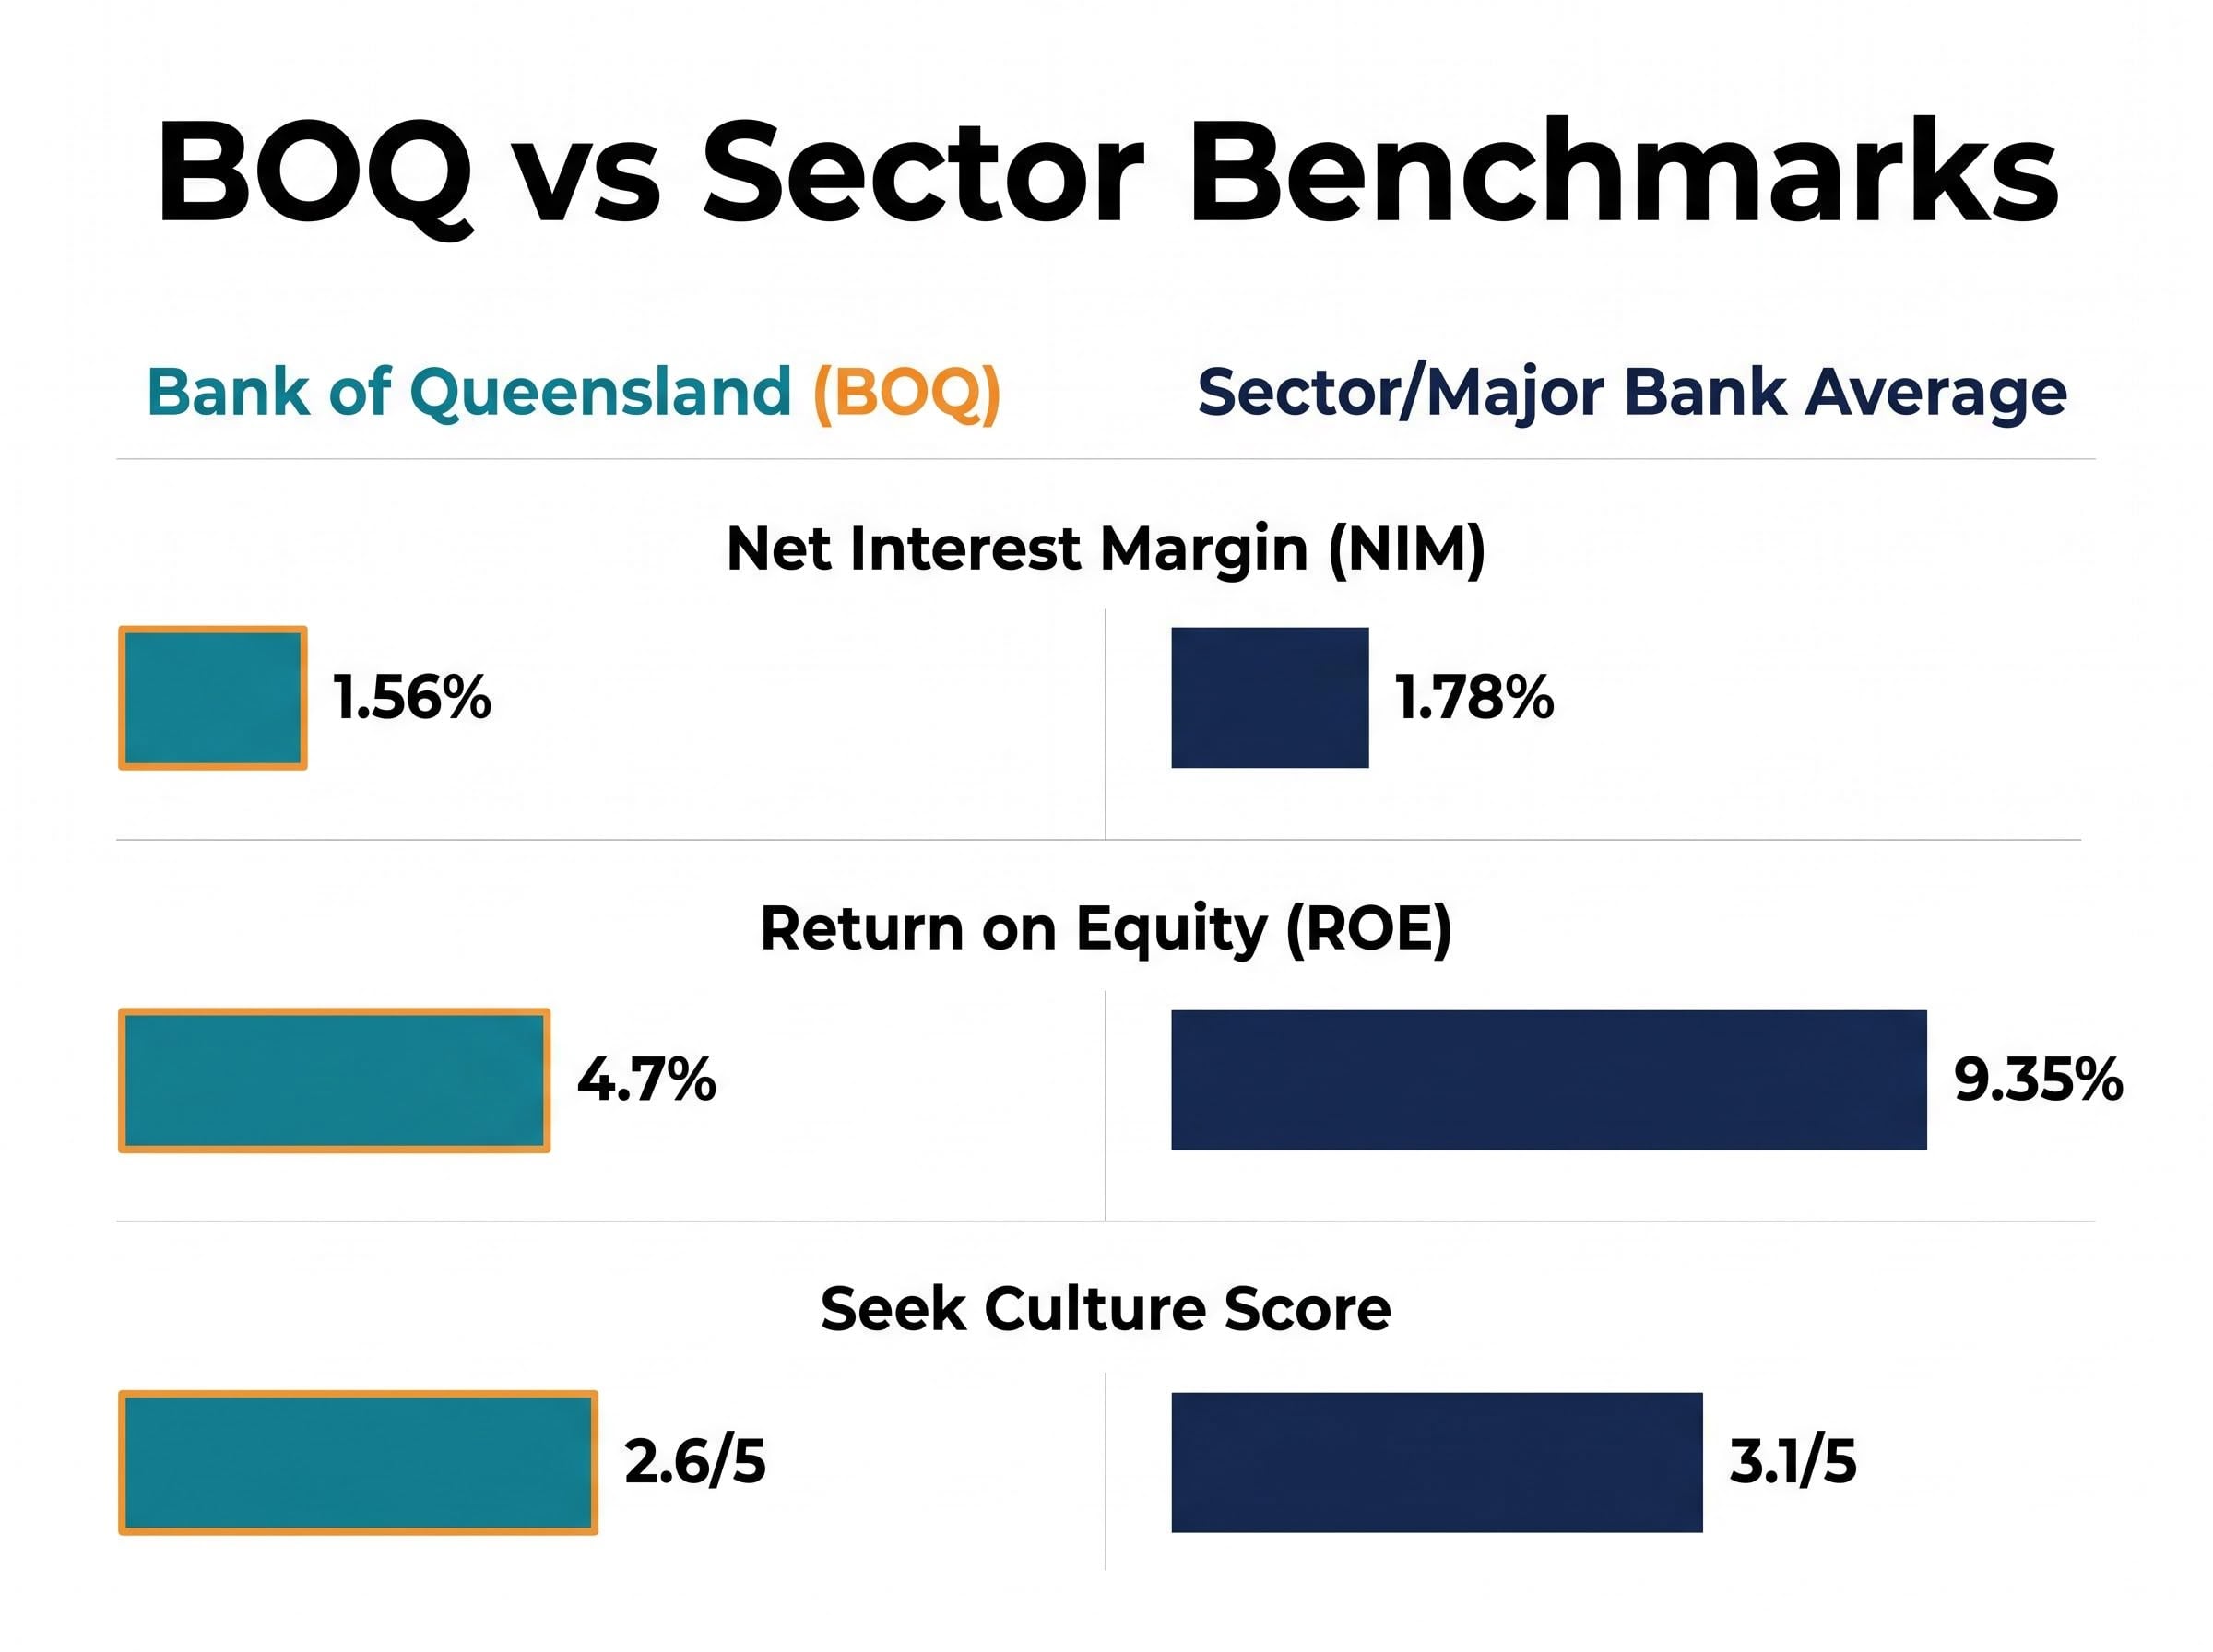
The ROE figure is the single most important context item. At 4.7%, BOQ earns roughly half what its peers generate on equity. Any DDM output built on this earnings base requires scrutiny, because a model that assumes perpetual dividend growth from a depressed ROE implicitly assumes the gap closes.
The three core ASX bank valuation metrics, net interest margin, return on equity, and CET1 capital adequacy, work together diagnostically: NIM reveals whether the bank is extracting adequate spread from its lending book, ROE reveals whether it is generating adequate returns on the equity backing that book, and CET1 reveals whether the capital base can support both dividend payments and regulatory requirements simultaneously.
When big ASX news breaks, our subscribers know first
Why DDM is the right tool for bank stocks, and where it can mislead
Banks make natural DDM candidates. They pay predictable, regulated dividends. Their earnings are relatively stable compared with cyclical industrials or early-stage technology companies. And their capital structures mean dividend sustainability is a function of regulatory capital adequacy rather than discretionary capex decisions. For a stock like BOQ, where the fully franked yield is a core part of the investment proposition, DDM provides a direct way to stress-test whether the price compensates for the income stream.
The method has a specific limitation, though, and BOQ falls squarely into it. When a bank’s ROE sits below its cost of equity, a DDM can overstate fair value. The model assumes the dividend can grow perpetually from a base that may not be sustainably funded by current earnings. BOQ’s 4.7% ROE sits well below the cost-of-equity range that professionals apply to regional banks: Macquarie uses approximately 10%, while Roger Montgomery of Montgomery Investment Management cites a 9-11% range, with the upper end reserved for regionals with unresolved competitive disadvantages.
Angus Gluskie of Whitefield Limited has emphasised the distinction between sustainable and current dividends for regional banks, recommending that investors stress-test payout ratios against capital requirements rather than model from headline yield alone.
Professional investors often complement DDM with residual income or excess returns frameworks for banks in this situation. For retail investors using DDM, the practical adjustment is a multi-stage model with conservative near-term growth and discount rates at or above 10%.
Building the BOQ DDM: inputs, franking adjustment, and the forward dividend
The Gordon growth model formula is straightforward: fair value equals the annual dividend divided by the difference between the discount rate (cost of equity) and the expected dividend growth rate. The analytical weight falls entirely on which numbers go in.
Three dividend inputs are worth modelling. The first is the FY25 actual dividend of 34 cents per share, fully franked. The second is the forward FY26 estimate of 35 cents per share, which sits at the midpoint of the broker consensus range of 34-36 cents. The third is the grossed-up forward dividend, adjusted for franking credits.
| Dividend Input | Value (cps) | Description |
|---|---|---|
| FY25 actual | 34 | Most recently paid full-year dividend, fully franked |
| Forward estimate (FY26) | 35 | Broker consensus midpoint (range 34-36 cps), fully franked |
| Grossed-up forward | ~50 | Forward dividend adjusted for franking credits at 30% corporate tax rate |
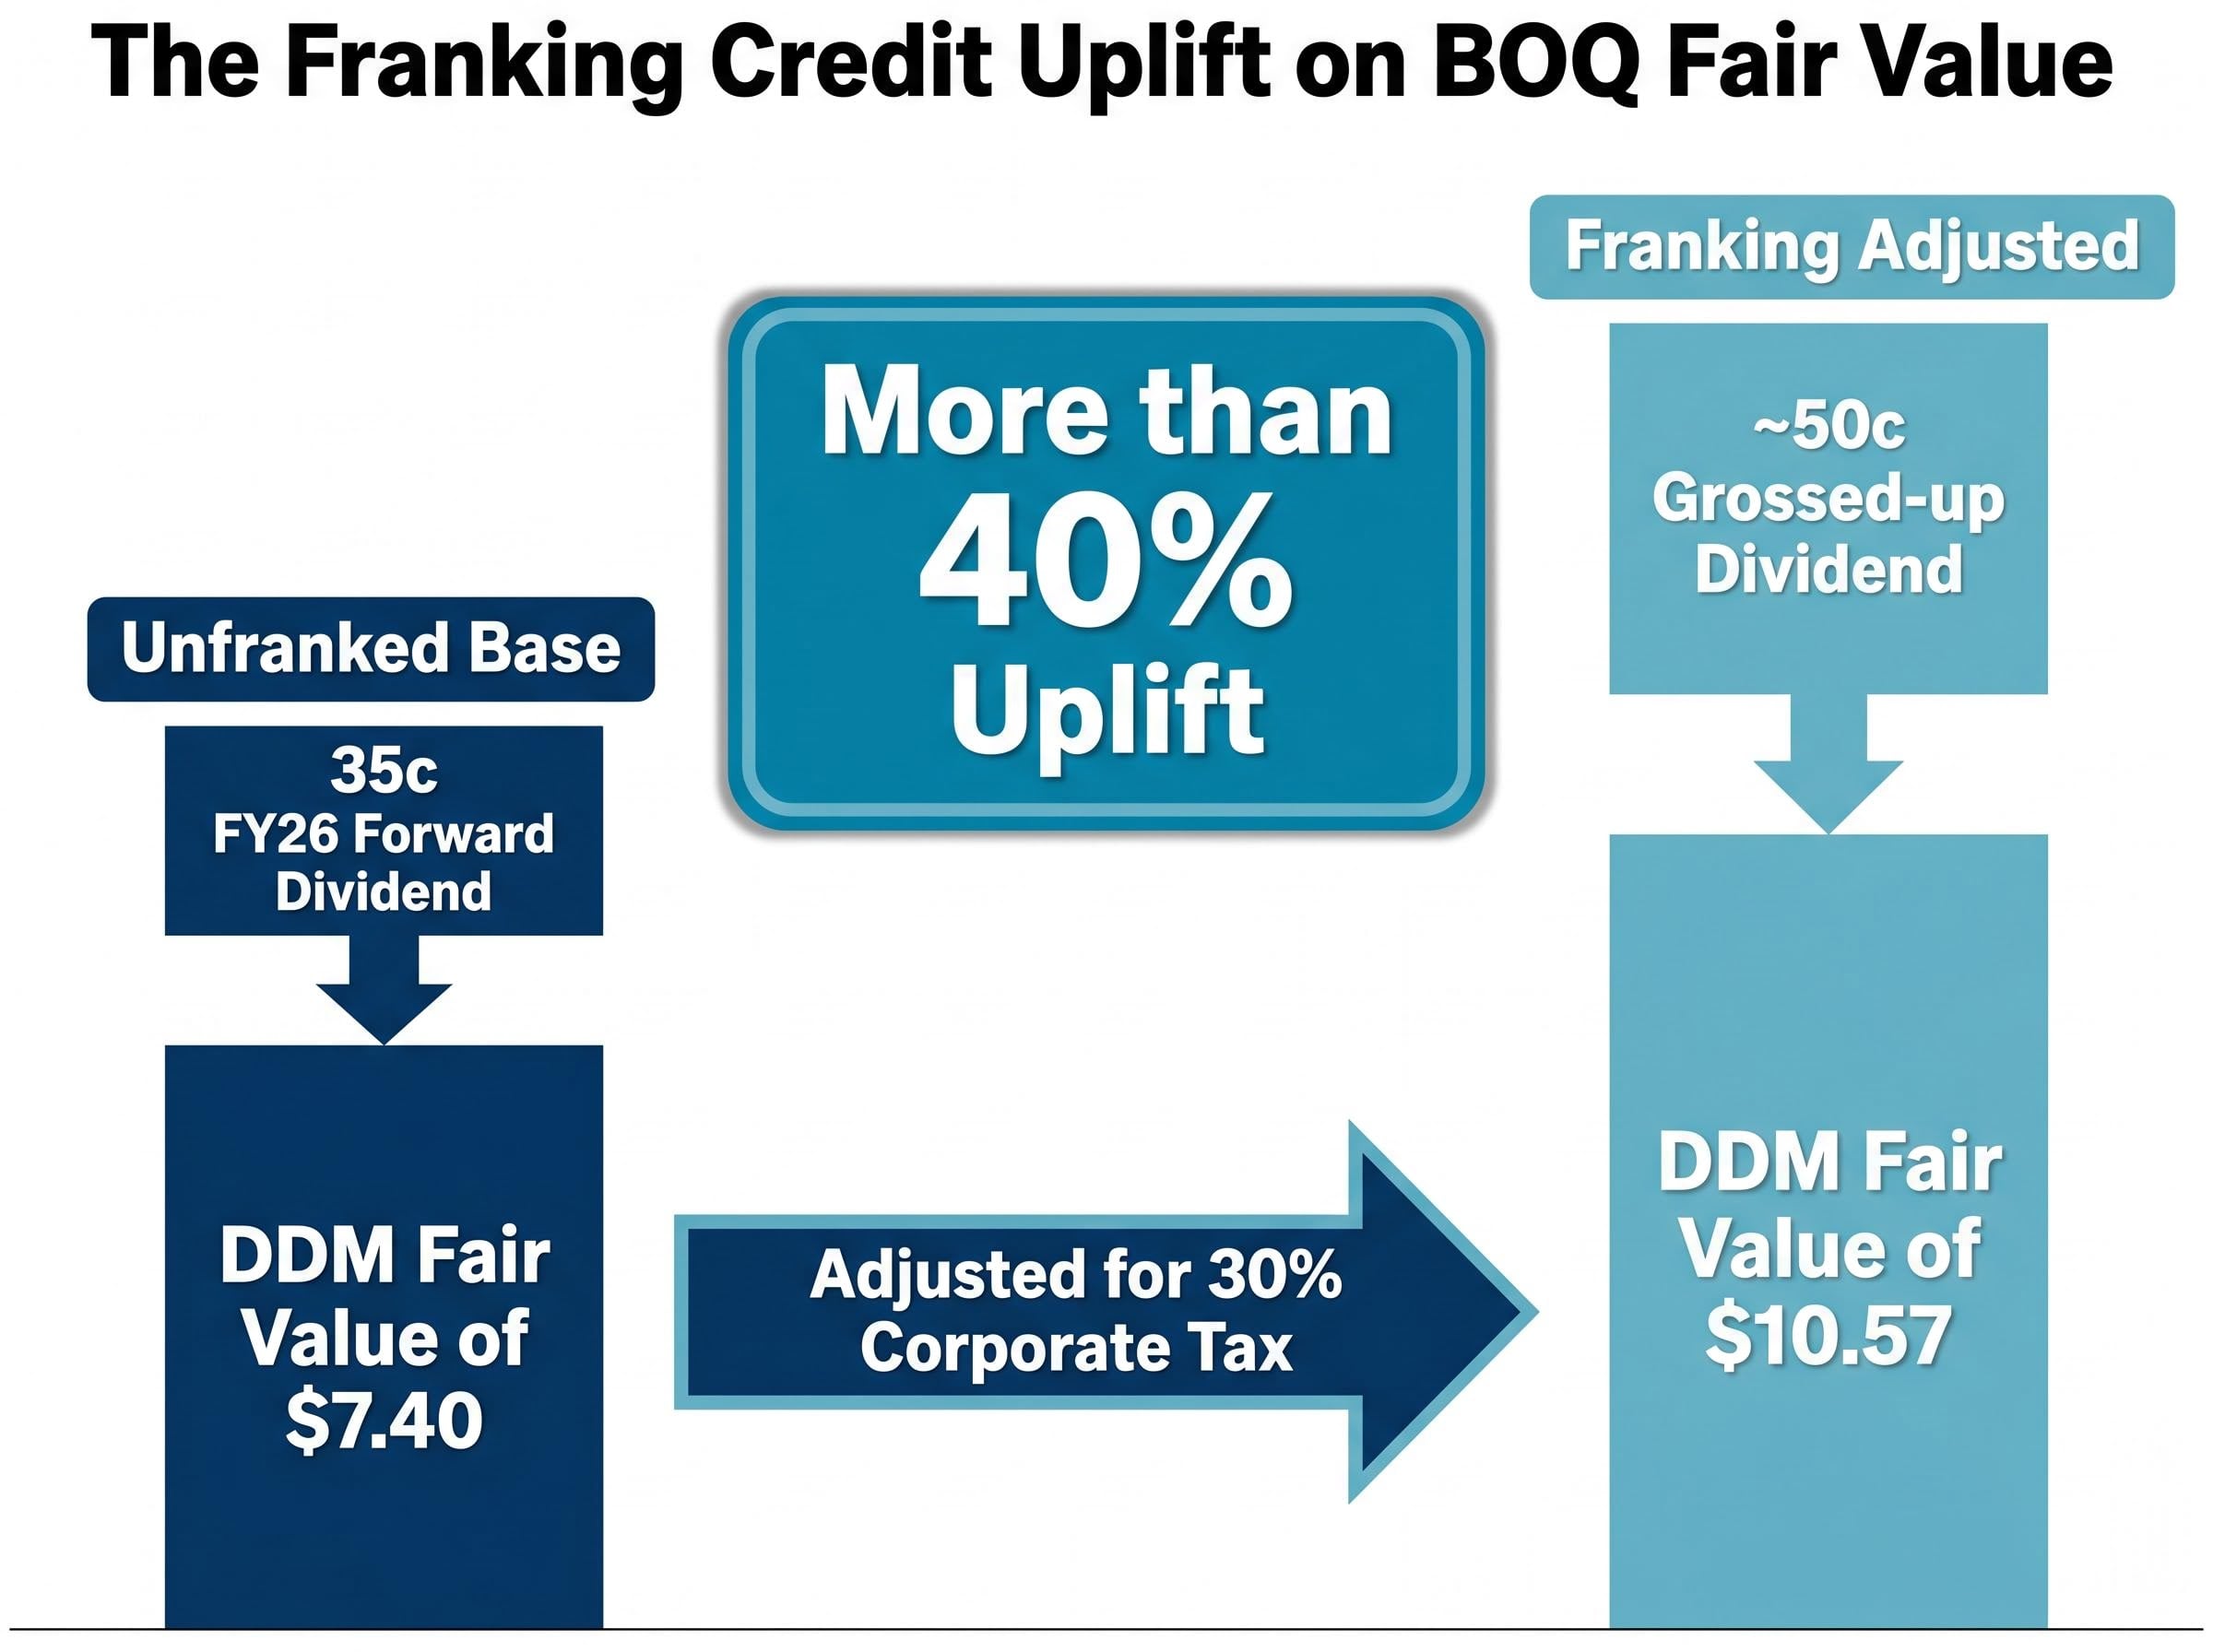
Using the FY25 actual of 34 cents, the DDM produces an estimated average fair value of approximately $7.19. Using the forward estimate of 35 cents, that figure rises to approximately $7.40. Both figures sit well above the current share price of $6.26.
How franking credits change the fair value equation for Australian investors
The third input is where the numbers shift materially. Australian resident investors receive a franking credit equal to the corporate tax already paid on dividend income, effectively converting the cash dividend into a pre-tax return. For a fully franked dividend, the grossing-up calculation divides the cash dividend by one minus the corporate tax rate: 35 cents divided by 0.70 equals approximately 50 cents per share.
The grossing-up calculation at the heart of this adjustment, dividing the cash dividend by one minus the corporate tax rate to arrive at the pre-tax equivalent, is straightforward in principle but carries nuances around the 45-day holding period rule and SMSF pension-phase refund eligibility that affect which investors can claim the full benefit.
Plugging that grossed-up figure into the DDM produces an estimated average fair value of approximately $10.57, more than 40% above the non-franked output. The uplift is real for investors who can fully utilise the credits, particularly superannuation funds in accumulation phase and individuals with sufficient tax liability. It is not, however, a general market fair value; it represents a ceiling applicable to a specific investor subset.
The full scenario range: what different risk and growth assumptions produce
The single-point estimates above use averaged assumptions. A scenario grid across a range of discount rates and growth rates reveals how wide the output distribution actually is, and that width is itself the analytical finding.
The table below uses the forward dividend of 35 cents per share across five discount rates and three growth rate assumptions.
| Growth Rate | 6% Discount | 8% Discount | 9% Discount | 10% Discount | 11% Discount |
|---|---|---|---|---|---|
| 2% | $8.75 | $5.83 | $5.00 | $4.38 | $3.89 |
| 3% | $11.67 | $7.00 | $5.83 | $5.00 | $4.38 |
| 4% | $17.50 | $8.75 | $7.00 | $5.83 | $5.00 |
The cells that matter sit in the right half of the grid. Discount rates below 9% are inconsistent with what professional analysts apply to regional banks in 2026. Macquarie uses approximately 10%; Morgan Stanley applies 9-9.5% to the majors and higher for regionals; Roger Montgomery’s cited range runs 9-11%.
At a 10% discount rate with 3% growth, the DDM output is $5.00. At 9% with 3% growth, it rises to $5.83. BOQ’s current price of $6.26 implies the market is pricing something close to a 9.6% discount rate with 2% growth, or a modestly lower discount rate with slightly higher growth expectations. Either way, the current price sits within the professional-consensus zone of the grid, not below it.
Broker price targets reinforce this reading. Macquarie targets $6.25, Morgan Stanley $6.40, UBS $6.30, and Ord Minnett approximately $6.45. All carry Neutral or Hold ratings. The simple average of approximately $6.35 clusters just above the current price.
Execution risk, ROE recovery, and what could make the model wrong
Every cell in the scenario grid assumes the dividend is sustainable and can grow at the specified rate indefinitely. That assumption carries real business risk that the formula cannot capture.
BOQ’s “One BOQ” simplification strategy and the ongoing ME Bank integration form the operational backdrop to the dividend sustainability question. The ME Bank deal has been described by analysts as having taken longer and cost more than initially anticipated. A portfolio manager at Yarra Capital Management has noted that execution risk “remains high” on the simplification programme. Morgan Stanley’s base case projects BOQ’s ROE will remain “well below 8%” through FY27.
The ROE gap is the core issue. At 4.7% against a cost of equity in the 9-11% range, BOQ is currently earning less than investors require for bearing the risk. A DDM that assumes steady dividend growth implicitly assumes this gap closes. The CET1 ratio of 10.7%, below the sector average, limits the bank’s capacity to increase dividends without underlying earnings improvement.
What a successful turnaround would need to look like
- ROE trajectory toward the 7-8% range by FY28 as cost-to-income improves
- NIM stabilisation or modest recovery as ME Bank integration noise clears
- Capital position improvement creating headroom for dividend growth without diluting returns
What would make the dividend assumptions too optimistic
- Credit quality deterioration in a slowing economy, forcing higher provisioning
- Cost-out programme falling further behind schedule, sustaining an elevated cost-to-income ratio
- Further mortgage market share loss compressing an already-thin NIM
Management has committed to a “sustainable dividend” but has not provided specific FY26 numeric guidance. The forward dividend estimates are entirely broker-driven, and the broker consensus range of 34-36 cents assumes no material deterioration in credit quality or payout capacity.
The DDM scenario grid captures dividend sustainability risk in the growth rate assumption but cannot interrogate the underlying drivers: provisioning and loan book quality, NIM sensitivity to deposit competition, and the pace of cost-out execution are the variables that will ultimately determine whether BOQ’s dividend trajectory matches the conservative or the optimistic growth scenario.
A fair price for uncertainty: what the DDM says and what it cannot
At broker-consistent discount rates of 9-11% and conservative growth rates of 2-3%, the DDM output converges toward a range broadly consistent with broker consensus targets of $6.20-$6.70. The market appears to be pricing BOQ roughly in line with fundamentals rather than at a deep discount.
The franking-adjusted estimate of approximately $10.57 represents an upper bound relevant to investors who can fully utilise the credits. It is not a general fair value.
For investors tracking whether the turnaround thesis is gaining traction, four metrics deserve monitoring:
- ROE trajectory: movement toward 7-8% would justify a lower discount rate assumption
- Cost-to-income direction: the primary lever for earnings recovery
- NIM stability: any further compression would pressure both earnings and dividend capacity
- CET1 trend: improvement would signal growing dividend headroom
BOQ at $6.26 is not obviously mispriced on a DDM basis at realistic discount rates. The case for material upside depends entirely on execution of a turnaround that has, so far, run behind expectations.
This article is for informational purposes only and should not be considered financial advice. Investors should conduct their own research and consult with financial professionals before making investment decisions.
BOQ’s valuation story is still being written, one assumption at a time
The DDM is a powerful framing tool for BOQ, but the output range from $6.26-equivalent to $10.57 is not ambiguity in the model. It is an accurate reflection of genuine uncertainty about the bank’s earnings recovery trajectory.
The franking-adjusted figure is not the “true” fair value but a ceiling applicable to investors who can fully utilise the credits. Most investors should anchor to the non-franking-adjusted range as the relevant reference point.
The variable to watch is not the dividend itself but whether BOQ’s ROE trajectory over the next two years justifies the growth assumptions embedded in whichever DDM scenario looks most attractive at current prices. Until that trajectory becomes clearer, the model’s wide output range is the most honest answer the analysis can give.
For investors wanting to apply the same five-metric framework to other ASX regional banks or to build a repeatable due diligence process beyond the DDM, our dedicated guide to regional bank stock analysis walks through ROE, NIM, CET1, workplace culture score, and DDM valuation using BOQ as the live case study, with each metric benchmarked against relevant sector averages.
Past performance does not guarantee future results. Financial projections are subject to market conditions and various risk factors. This article is for educational and informational purposes and does not constitute personal financial advice.