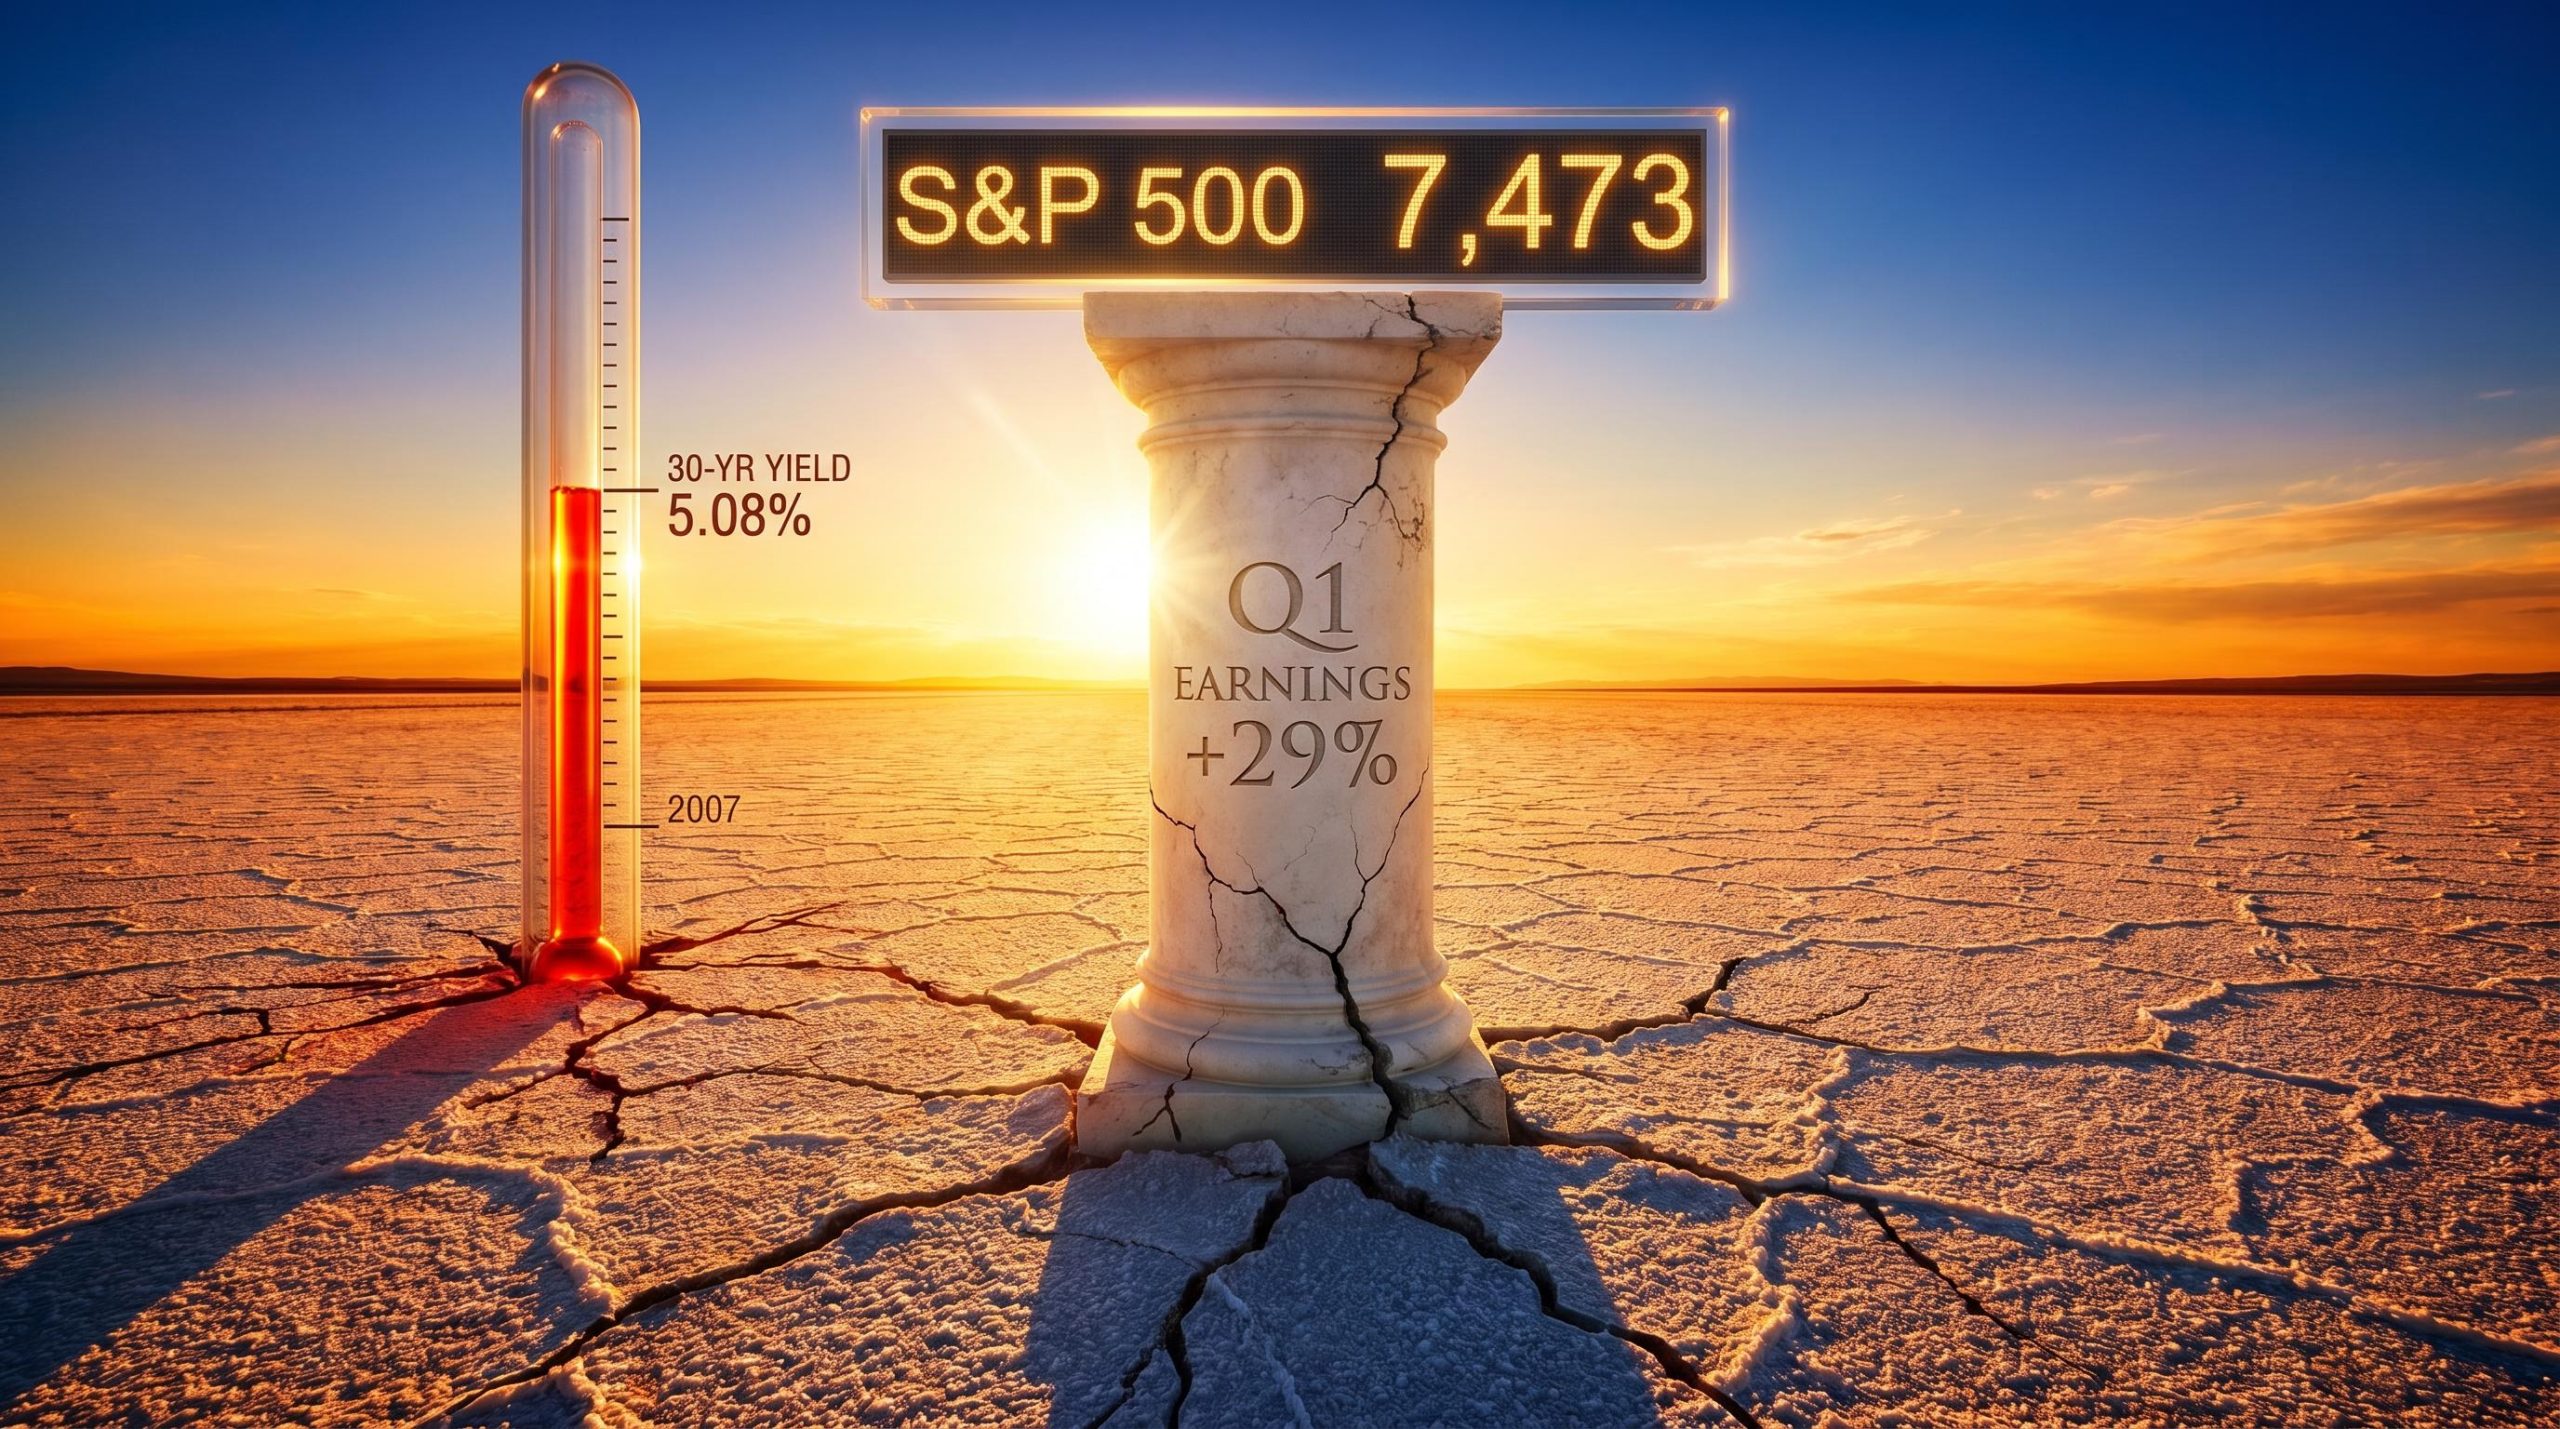
The S&P 500 has logged eight consecutive weeks of gains and sits near 7,473, but the tailwind that carried it there is running out of runway.
Q1 2026 earnings season delivered approximately 29% year-over-year profit growth across S&P 500 companies, according to LSEG IBES data, giving investors reason to look past rising bond yields and re-ignited inflation concerns. With more than 90% of index members having now reported, that buffer is dissolving. The 30-year Treasury yield has touched its highest level since 2007, and futures markets price better-than-even odds of a Federal Reserve rate hike by December.
What follows maps the specific forces that could expose stretched equity valuations once the earnings shield drops: the yield-valuation compression dynamic, the Fed’s shifting posture, the historical post-earnings return pattern, and the narrow AI concentration that underpins current index levels. For investors weighing whether to add or trim exposure, the question is no longer whether earnings were strong. It is whether the macro environment can justify prices on its own.
Eight straight winning weeks built on a foundation that is now cracking
The surface-level story looks comfortable. The S&P 500 closed at 7,473.47 on 22 May 2026, up more than 9% year-to-date, with eight consecutive weeks of gains pushing it near record territory.
What carried it there was a single, time-limited force. Q1 earnings season produced 29% year-over-year profit growth, and that stream of company-level beats gave investors permission to treat elevated yields and geopolitical noise as secondary concerns. Each reporting week offered fresh micro catalysts, stock-specific reactions that absorbed macro anxiety into individual price moves rather than index-wide selling.
That insulator is now fading. With over 90% of S&P 500 constituents having reported, the weekly calendar shifts from earnings calls back to economic data releases, Fed commentary, and yield movements.
David Joy, Chief Market Strategist at Ameriprise Financial, said: “As earnings season winds down, returns will increasingly be driven by the path of interest rates and inflation rather than micro stories.”
The scoreboard still reads bullish. The supports beneath it tell a different story.
When big ASX news breaks, our subscribers know first
What history says happens when earnings season stops protecting the market
Earnings season functions as a volatility dampener. When hundreds of companies report in rapid succession, markets have stock-specific catalysts to react to each day, and that granularity absorbs shocks that might otherwise register at the index level. Once reporting winds down, macro data regains primacy, and the character of weekly returns changes.
Three major research houses have documented this pattern:
- LPL Financial examined S&P 500 returns after earnings seasons back to 1990 and found that in the four weeks following the reporting window, average returns were slightly positive but below the long-term average, with volatility tending to pick up as macro data regained focus.
- JPMorgan found that the S&P 500 has “on average underperformed in the month after peak earnings-reporting weeks compared with the prior month,” particularly when yields are rising.
- BofA Global Research strategist Savita Subramanian noted that “post-earnings season, the market’s hit rate of positive weeks falls and dispersion rises,” with macro catalysts explaining a larger share of weekly moves.
None of this constitutes a sell signal on its own. The pattern describes a shift in what drives returns, not a guaranteed direction. What makes it more consequential this cycle is the macro backdrop waiting on the other side: yields at multi-year highs, a Fed reconsidering hikes, and valuations that leave little room for disappointment.
How rising yields compress equity valuations and why this cycle is different
When long-term Treasury yields rise, the present value of future corporate earnings falls. This is the mechanical heart of equity valuation: the higher the risk-free rate an investor can earn by holding government bonds, the less they should be willing to pay for uncertain future profits from stocks. The result is compression in price-to-earnings multiples.
Discount-rate compression is the mechanical reason a 30-year yield at 5.08% poses a structural threat even to companies whose earnings have not deteriorated: as the risk-free rate rises, the present value of future cash flows shrinks and P/E multiples contract, a process that operates independently of whether corporate profits are growing or falling.
Federal Reserve research on discount rates and equity valuation ratios established that rising long-term interest rates compress the multiples investors assign to future earnings, the same mechanism now operating as the 30-year Treasury approaches levels unseen since 2007.
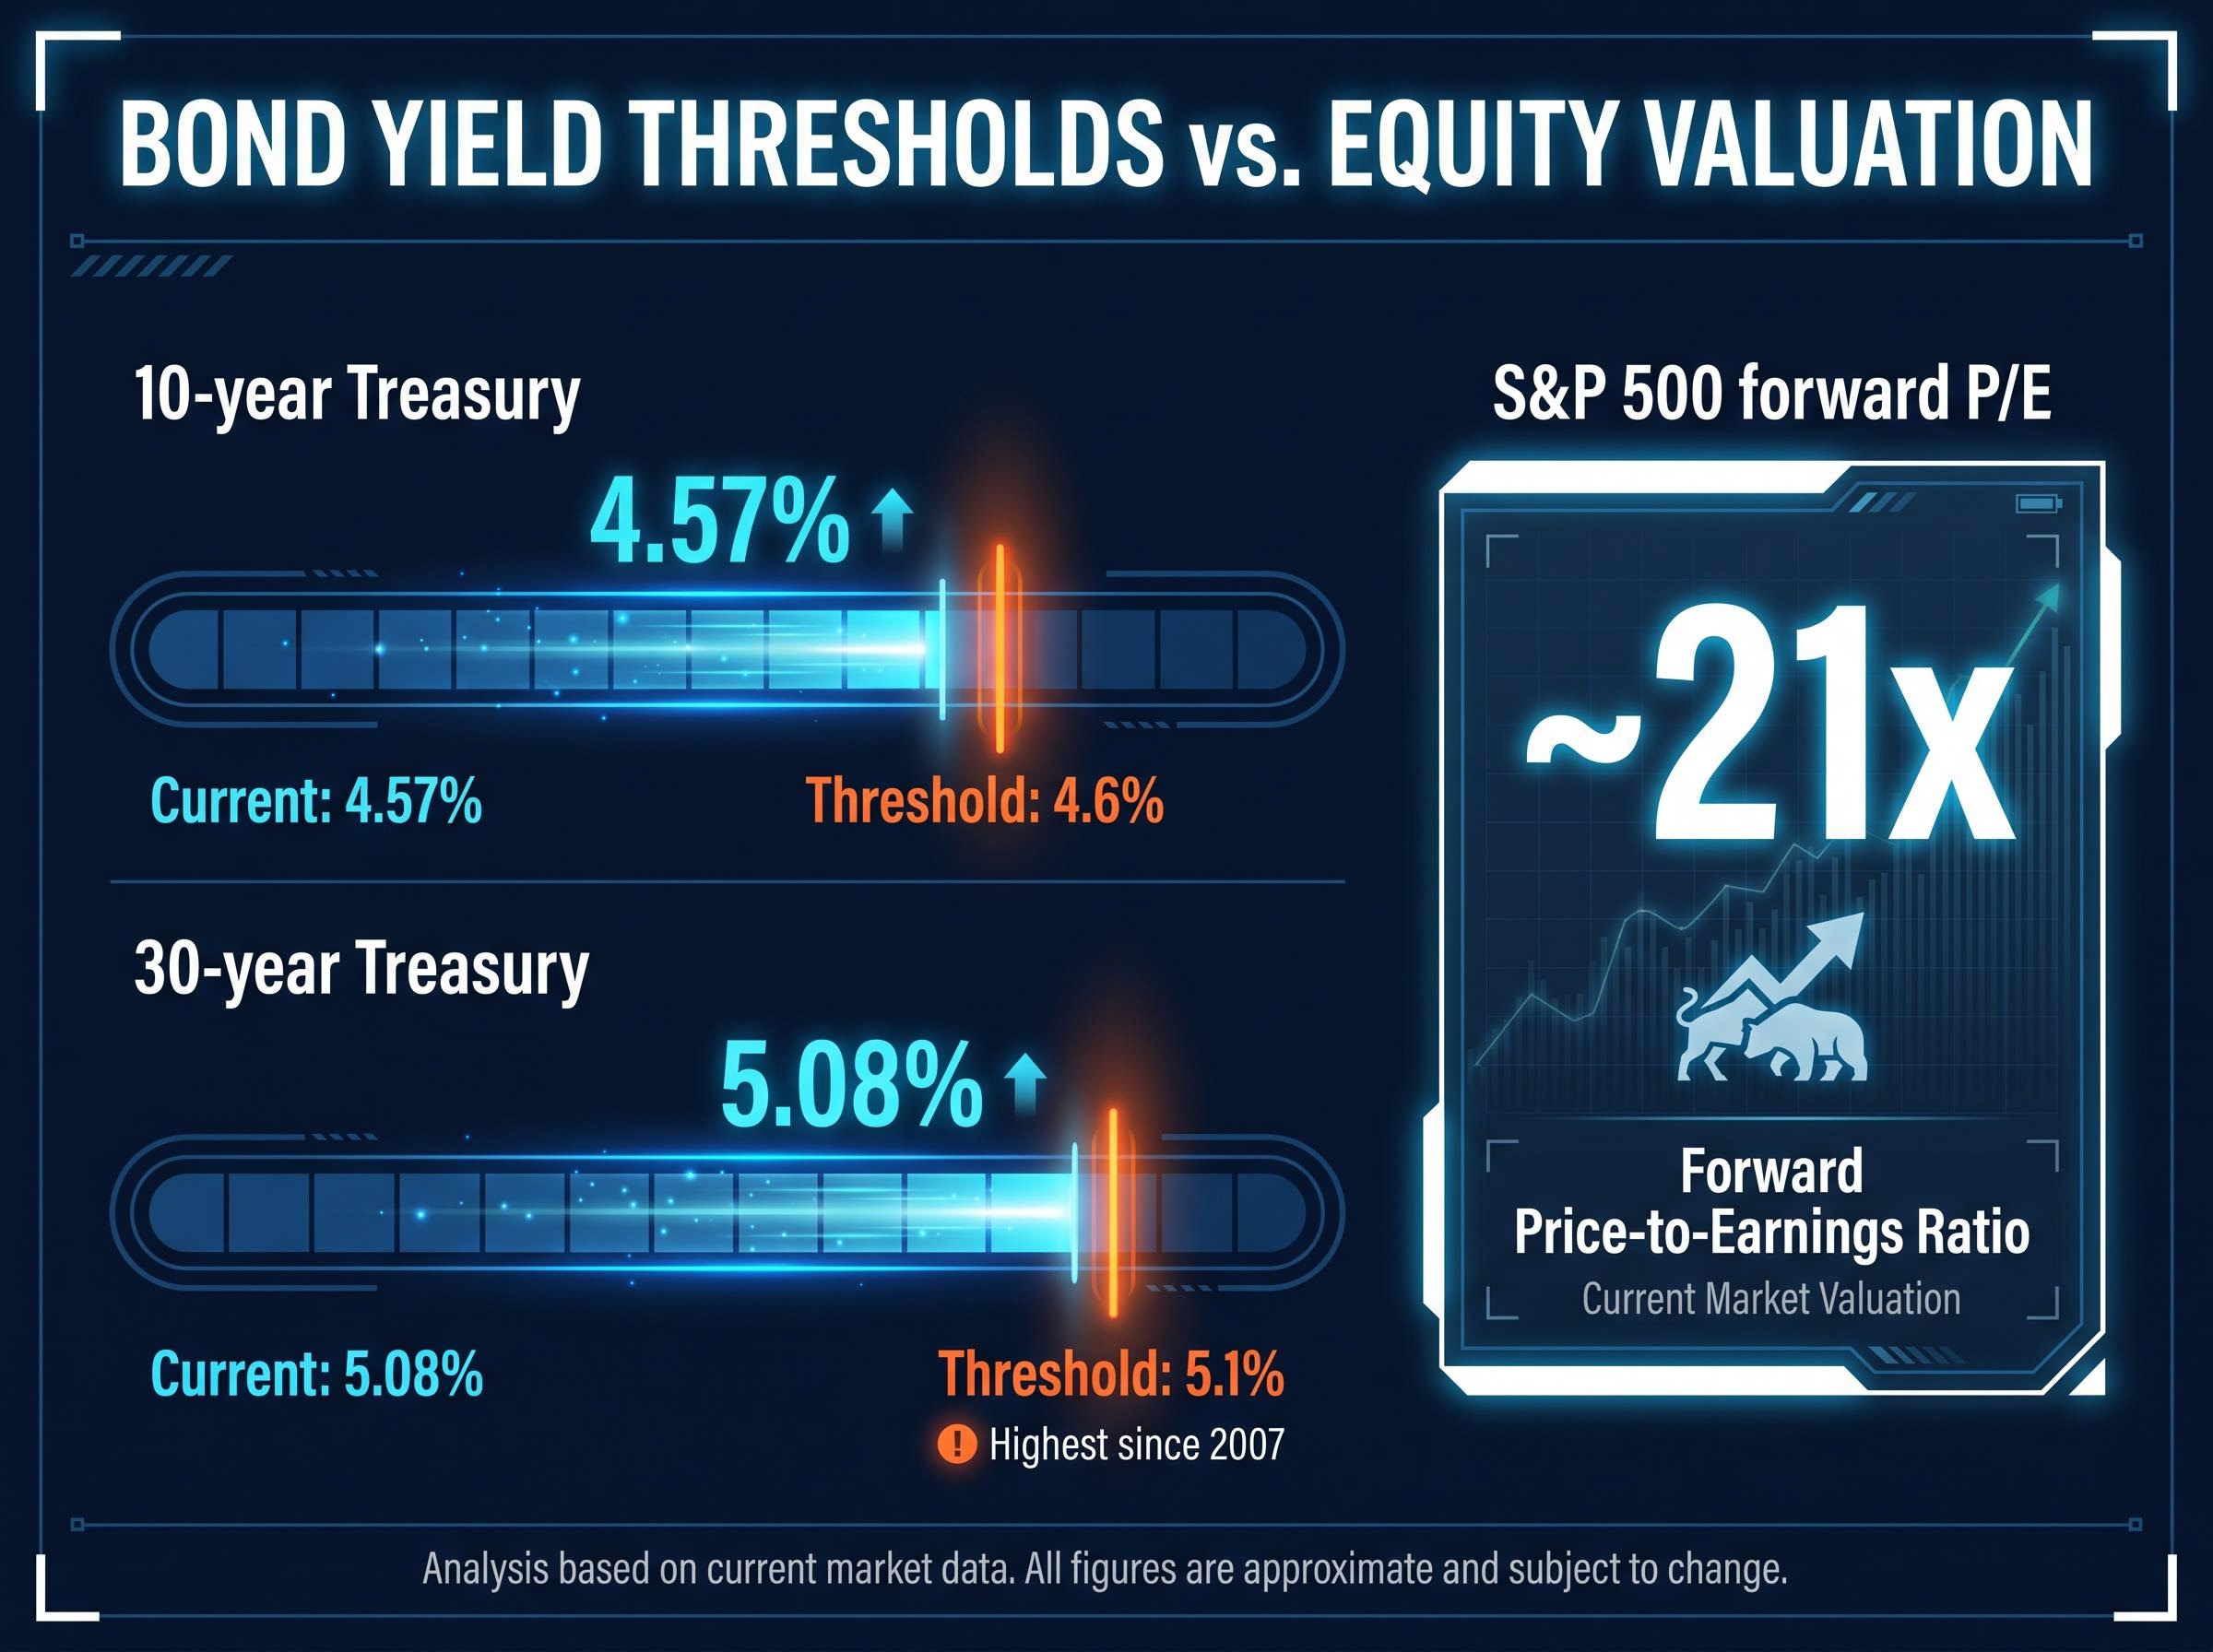
The current numbers put that mechanism under a spotlight. As of the 23 May 2026 close, the 10-year U.S. Treasury yielded 4.57% and the 30-year yielded 5.08%, its highest level since 2007. Meanwhile, the S&P 500 trades at approximately 21 times forward earnings.
| Instrument | Current Level | Key Threshold | Strategist Assessment |
|---|---|---|---|
| 10-year Treasury | 4.57% | 4.6% | Near the upper bound of what supports current equity multiples |
| 30-year Treasury | 5.08% | 5.1% | Highest since 2007; repricing term premium and inflation expectations |
| S&P 500 forward P/E | ~21x | Historical fair value lower when 10-year exceeds 4.5% | Stretching the upper end of sustainable range at current yields |
Sameer Samana, Senior Global Market Strategist at Wells Fargo Investment Institute, said: “We do not believe earnings growth can indefinitely offset the drag from a 10-year above 4.5% and a 30-year near 5%.”
Structural inflation versus geopolitical risk premium
Whether these yield levels persist depends on their composition. A Goldman Sachs client note, summarised by the Wall Street Journal, estimated that roughly two-thirds of the recent rise in long-term yields reflects higher real rates and term premium tied to persistent inflation and larger fiscal deficits. The remaining third appears to be a geopolitical premium linked to elevated energy prices.
The distinction matters. A geopolitical premium could reverse on a ceasefire or de-escalation. Structural inflation and term premium repricing cannot. Ian Lyngen, Head of U.S. Rates Strategy at BMO Capital Markets, reinforced this, noting that “data, not Middle East headlines alone, are driving the back-up in yields.”
The Fed’s posture has shifted and the market has only partially priced it
At the start of 2026, futures markets priced rate cuts. That expectation has now inverted. Three signals in the span of a single week made the shift explicit:
The FOMC April 28-29 minutes, published by the Federal Reserve on 20 May 2026, document the specific language used by committee members when flagging willingness to raise rates, providing the primary source record of how materially the Fed’s internal discussion had shifted from the cut expectations that opened the year.
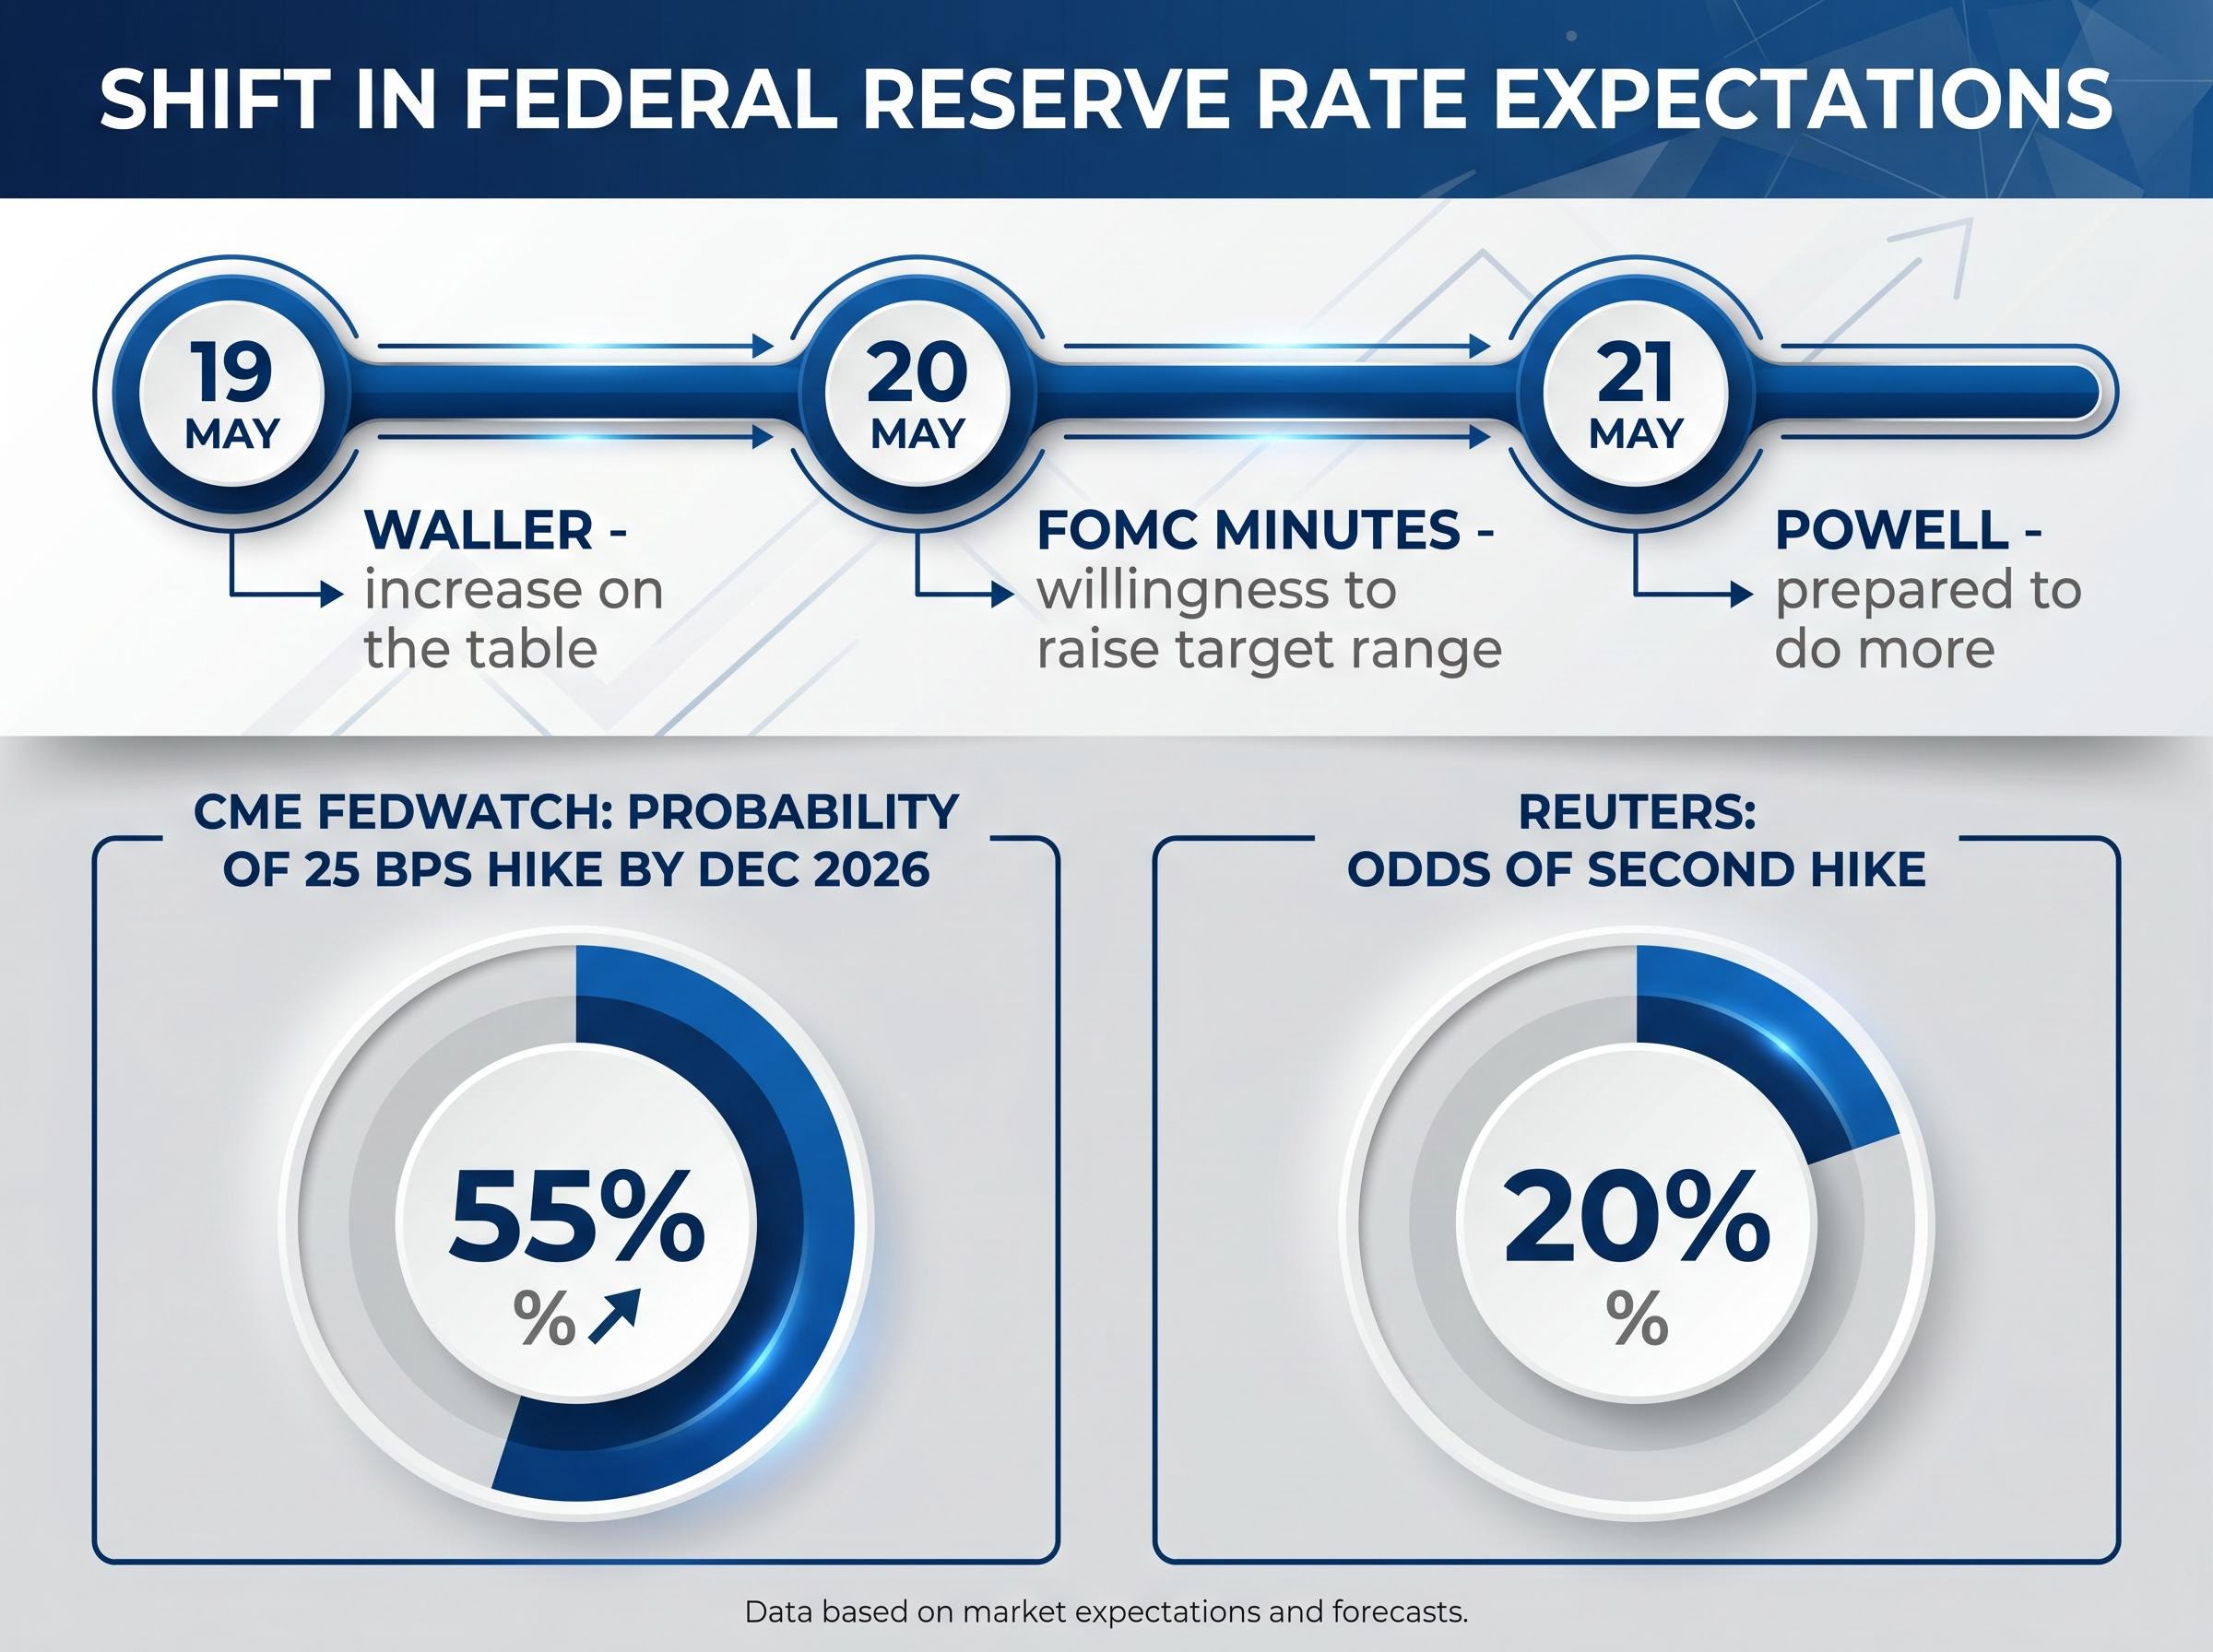
- FOMC April 28-29 minutes (published 20 May): “Several participants mentioned a willingness to raise the target range for the federal funds rate later this year should inflation fail to show signs of resuming a downward trajectory.”
- Fed Chair Jerome Powell at the Peterson Institute (21 May): The baseline remains gradual disinflation, but “recent data have not given us greater confidence” and the Fed is “prepared to do more if needed.”
- Governor Christopher Waller (19 May): “A rate increase in late 2026 would be on the table” if inflation data fail to improve, though “not my base case today.”
The FOMC minutes stated: “Several participants mentioned a willingness to raise the target range for the federal funds rate later this year should inflation fail to show signs of resuming a downward trajectory.”
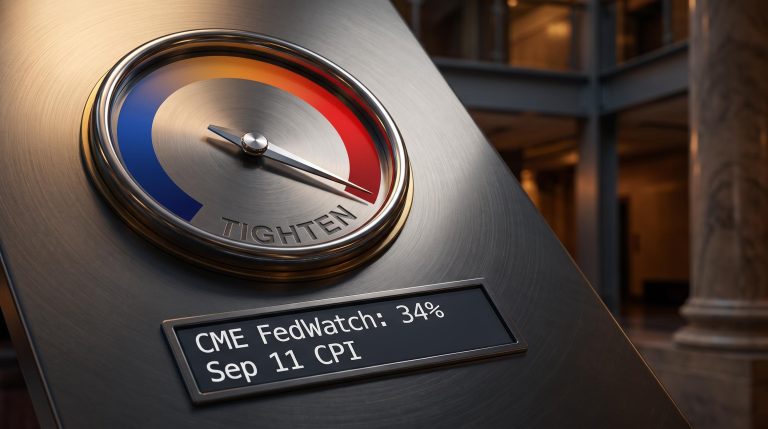
CME FedWatch data as reported by MarketWatch showed approximately a 55% probability of at least one 25 basis point hike by the December 2026 FOMC meeting. Reuters framed the same data as one hike now fully priced, with a second at roughly 20% odds.
The April Personal Consumption Expenditures (PCE) price index, the Fed’s preferred inflation gauge, is the next binary catalyst. A hot reading could accelerate hike pricing further. A Fed that was expected to cut and is now expected to hike represents a fundamentally different discount-rate environment for equities. Investors who have not recalibrated return assumptions since January are working with an outdated model.
For investors wanting to trace exactly how quickly the policy environment shifted, our full explainer on the Fed outlook reversal documents the ten-week sequence from 50-75 basis points of expected cuts to a 65-70% probability of a December hike, including the specific April Core PCE forecasts from Goldman Sachs and Bank of America that now place actual inflation nearly 80 basis points above the Fed’s own year-end projection.
AI is propping up the index, but the rally beneath the surface is thinner than it looks
Nvidia’s Q2 FY2027 revenue guidance came in above prior consensus ranges, reinforcing confidence in AI infrastructure spending. The headline response was bullish. But the analyst debate beneath it reveals two very different markets trading under the same index level.
Michael Wilson, Chief U.S. Equity Strategist at Morgan Stanley, framed it directly: “The AI leaders can justify premium multiples, but the median stock is fully valued if not rich for this point in the cycle.”
Three analysts captured the escalating caution on AI spending durability:
- Mark Mahaney (Evercore ISI): “Enterprise and government deployments will need to broaden to sustain current growth rates into 2027-2028,” with “pockets of over-exuberance in smaller AI beneficiaries.”
- Stacy Rasgon (Bernstein): “At some point, customers’ budgets are finite.”
- Wells Fargo Investment Institute: “AI earnings strength is impressive but narrow, and index-level valuations now embed a lot of that optimism just as bond yields reset higher.”
| Firm | Strategist | Stance on Current Valuations | Key Risk Cited |
|---|---|---|---|
| Goldman Sachs | David Kostin | Raised S&P 500 year-end target | Higher-for-longer rates and elevated energy prices |
| Wells Fargo | Sameer Samana | Cautious; did not raise target | Narrow AI earnings base; macro headwinds |
| BofA | Savita Subramanian | Neutral-to-cautious tactical shift | Crowded positioning; AI has pulled forward returns |
| Deutsche Bank | Equity strategy team | Nudged target higher | Further 50-75 bps yield rise would challenge multiples |
| Morgan Stanley | Michael Wilson | Median stock fully valued or rich | Higher real yields compress market-wide P/Es |
For investors deciding whether to add to or trim equity exposure, understanding which part of the market is driving gains is as important as knowing the index level itself. The headline number reflects AI leadership. The median stock tells a more cautious story.
Index concentration has reached a level with no modern historical precedent: five companies now control roughly 30% of total U.S. equity market capitalisation, and passive S&P 500 holders carry that exposure by default, which means a sentiment shift on even one or two AI mega-caps would transmit directly into broad-market index returns regardless of how the median constituent performs.
What investors should be watching in the weeks ahead to gauge whether the rally holds
The earnings buffer has faded. The macro data calendar now becomes the primary return driver. Four signposts deserve attention in the coming weeks, ranked by near-term impact:
- April PCE price index: Due in the week following Memorial Day, this is the most immediate binary catalyst. A hot print reopens hike pricing aggressively; a soft print relieves pressure on both yields and equity multiples.
- Yield thresholds: A sustained move above 4.6% on the 10-year and 5.1% on the 30-year would accelerate valuation compression and could force further target revisions downward.
- Revised Q1 GDP estimate and consumer confidence update: Both due in the same shortened trading week, these will signal whether a rate-hike scenario coincides with slowing growth, the most challenging macro combination for equities.
- Retail earnings (Costco, Best Buy, Dollar Tree): Reporting in the week following 22 May, these results offer a read on whether elevated fuel costs are already compressing consumer discretionary spending, a leading indicator of Q2 2026 earnings risk.
Anthony Saglimbene of Ameriprise said the PCE data will “reflect pass-through effects from months of elevated oil prices and supply disruptions into broader consumer prices.”
Investors do not need to predict the outcome. Knowing which data releases carry the most signalling power allows for disciplined, evidence-based positioning adjustments rather than reactive decisions.
The sector rotation implications of this macro configuration are becoming clearer: the institutional consensus across Goldman Sachs, Bank of America, BlackRock, and JPMorgan favours energy, financials, and free-cash-flow value names while flagging long-duration growth stocks and rate-sensitive sectors as most exposed, a positioning shift that matters for investors deciding not just whether to stay in equities but where within them.
The earnings buffer is gone; now the macro has to do the heavy lifting
Three compounding pressures now converge. The S&P 500 trades at approximately 21 times forward earnings with no fresh earnings catalyst in the near term. The Fed has shifted from cut expectations to hike possibilities, with 55% odds of a December move. The 30-year Treasury yield sits at 5.08%, its highest level since 2007.
No single factor guarantees a correction. But their coincidence removes the margin for error that characterised the first quarter. The post-earnings seasonal pattern identified by LPL Financial and JPMorgan provides context: when the micro buffer fades and macro data regains primacy, markets historically become choppier, and the current macro backdrop is more hostile than average.
Michael Wilson of Morgan Stanley noted that “higher real yields historically compress market-wide P/Es.” Wells Fargo Investment Institute was more direct: “Risk-reward from current levels looks less compelling.”
Wells Fargo Investment Institute: “Risk-reward from current levels looks less compelling.”
The question for the weeks ahead is no longer whether the rally can continue on earnings momentum, because that momentum has been spent. The question is whether the macro environment can justify current prices on its own merits. The April PCE release, yield behaviour around the thresholds identified above, and the next wave of consumer-facing earnings will provide the evidence.
This article is for informational purposes only and should not be considered financial advice. Investors should conduct their own research and consult with financial professionals before making investment decisions. Past performance does not guarantee future results. Financial projections are subject to market conditions and various risk factors.