After 17 years of investing $500 a month into an S&P 500 index fund, something shifts. The market starts adding more to the portfolio each year than the investor does. The person writing the cheques becomes, in structural terms, a passenger.
Most personal finance content focuses on what to invest in or when to start. Very few pieces trace the precise mathematical moment when compound growth takes over from human effort, making the wealth-building process structurally self-sustaining. That moment has a year number, a dollar figure, and a ratio. It can be mapped in advance.
What follows is a year-by-year breakdown of how a $500 monthly S&P 500 index investment progresses across 25 years, when the portfolio crosses from investor-driven to market-driven, what behavioral traps prevent most people from reaching that crossover, and how to structure the contributions to give the mathematics the best chance of working.
Why the first decade feels like nothing is happening
At the end of year one, an investor contributing $500 a month has deposited $6,000. The market has added approximately $221. The account balance sits at roughly $6,221. That $221 is not a rounding error; it is compound interest operating on a small base. It looks like nothing because, relative to the effort, it is almost nothing.
The temptation to quit starts here.
- Year 1: $6,000 contributed, ~$221 market return, balance ~$6,221
- Year 2: $12,000 contributed, cumulative market return ~$900, balance ~$12,900
- Year 5: $30,000 contributed, cumulative market gains ~$5,800, balance ~$35,800
- Year 10: $60,000 contributed, balance ~$86,542, single-year market gain exceeds $6,000
At the end of year 10, the market contributes more than $6,000 in a single year for the first time, matching what the investor deposits annually. This is the first structural threshold.
The frustration of the early years is not evidence that the strategy is failing. It is the mathematical reality of compounding operating on a base that has not yet reached critical mass. Every dollar deposited in years one through five is doing work the investor will not see for a decade.
What is actually happening inside the numbers
Compounding requires a meaningful base to produce visible acceleration, and that base takes time to accumulate through consistent contributions. The return percentage does not change from year to year; the long-run S&P 500 nominal annualised average sits at approximately 10%, with the trailing 10-year average cited in May 2025 reporting closer to 12.2%.
What changes is the dollar amount that percentage generates. 10% of $6,221 is $622. 10% of $86,542 is $8,654. The rate is constant. The output is not. That gap between percentage and dollar output is why the early years look flat and the later years look explosive.
When big ASX news breaks, our subscribers know first
How compound interest actually works (and why most explanations miss the point)
Compound interest, in its simplest form, is money growing on top of previously grown money. Each year’s returns become part of the base on which the following year’s returns are calculated. The result is not a straight line upward but a curve that bends more steeply over time.
The distinction from simple interest matters. Simple interest would pay a fixed dollar amount on the original contributions alone. Under simple interest at 10%, $60,000 in contributions would generate $6,000 per year, every year, regardless of how much the account had grown. Compound interest pays 10% on the entire balance, contributions plus all prior growth, meaning the return itself earns a return.
By year 12, this mechanism pushes the account past $100,000 for the first time. The balance reaches approximately $111,477, with $72,000 contributed by the investor and nearly $40,000 generated by market growth. The market’s share of the total is accelerating.
By year 12, the market has contributed nearly $40,000 to a portfolio built on $72,000 in deposits. For the first time, compound growth has added a sum that is no longer incidental to the investor’s effort; it is structurally significant.
By year 15, the single-year market gain reaches approximately $10,919, nearly double the $6,000 the investor contributes that year. The portfolio is now growing faster than the investor can feed it. These projections assume the long-run S&P 500 return of approximately 10% as the growth rate.
| Year | Total Contributed | Account Balance |
|---|---|---|
| 1 | $6,000 | ~$6,221 |
| 5 | $30,000 | ~$35,800 |
| 10 | $60,000 | ~$86,542 |
| 12 | $72,000 | ~$111,477 |
| 15 | $90,000 | ~$155,392 |
The acceleration visible in that table is not a feature of higher returns in later years. The return rate is the same throughout. What changes is the size of the base it acts upon.
How to structure $500 a month to reach the crossover
The correct sequence is non-negotiable. Starting monthly contributions while carrying 7%+ interest debt or without an emergency buffer creates fragility that compounds just as reliably as the investment returns do, in the wrong direction.
- Eliminate high-interest debt first. Any debt above approximately 7% annual interest outpaces the long-run expected return of equities. Paying it down is mathematically equivalent to earning that rate, guaranteed.
- Establish a 3-to-6 month emergency fund. Without a financial buffer, the first unexpected expense becomes the reason contributions stop. An emergency fund protects the investment plan from life.
- Begin consistent monthly contributions. Automate them. The goal is to remove the monthly decision from the equation entirely.
A 3% employer 401(k) match provides an immediate 100% return on the matched portion of contributions. Capturing that match is the first priority within step three. According to Vanguard’s How America Saves 2025 report, 85% of employees with access to workplace retirement plans now participate, largely due to auto-enrolment defaults.
Each additional $100 per month in contributions is estimated to add approximately $80,000 to the 25-year total. Approximately 54% of US households own mutual funds or ETFs, according to Investment Company Institute data, but consistent monthly contribution behaviour is significantly less common than general ownership.
Choosing the right account and fund type
Broad-market index funds, whether tracking the total US market or the S&P 500, are the appropriate vehicle for this strategy. The specific ticker matters less than the fund’s expense ratio and diversification. Examples commonly referenced include VTI, VOO, and target-date retirement funds.
Tax-advantaged accounts protect gains from annual taxation, preserving a meaningfully larger share of the final portfolio compared to a taxable account with identical contributions. Account options include:
- Roth IRA (contributions taxed upfront; withdrawals tax-free in retirement)
- Traditional IRA (contributions may be tax-deductible; withdrawals taxed in retirement)
- 401(k) (employer-sponsored; often includes matching contributions)
- HSA (triple tax advantage for qualifying medical expenses)
Selection depends on individual tax circumstances, but the employer match rule is universal: capture it before directing funds elsewhere.
The inflection point: when your portfolio becomes self-sustaining
At the end of year 17, the investor has deposited $102,000. The account balance has reached approximately $190,295. The single-year market gain that year is approximately $13,393, more than double the $6,000 annual contribution.
This is the crossover point.
What makes year 17 structurally significant, rather than merely numerically interesting, is that the market’s annual contribution to the portfolio now exceeds the investor’s annual contribution permanently under the assumed return rate. The portfolio’s growth engine has shifted. Before the crossover, the investor is the primary driver. After it, the market is.
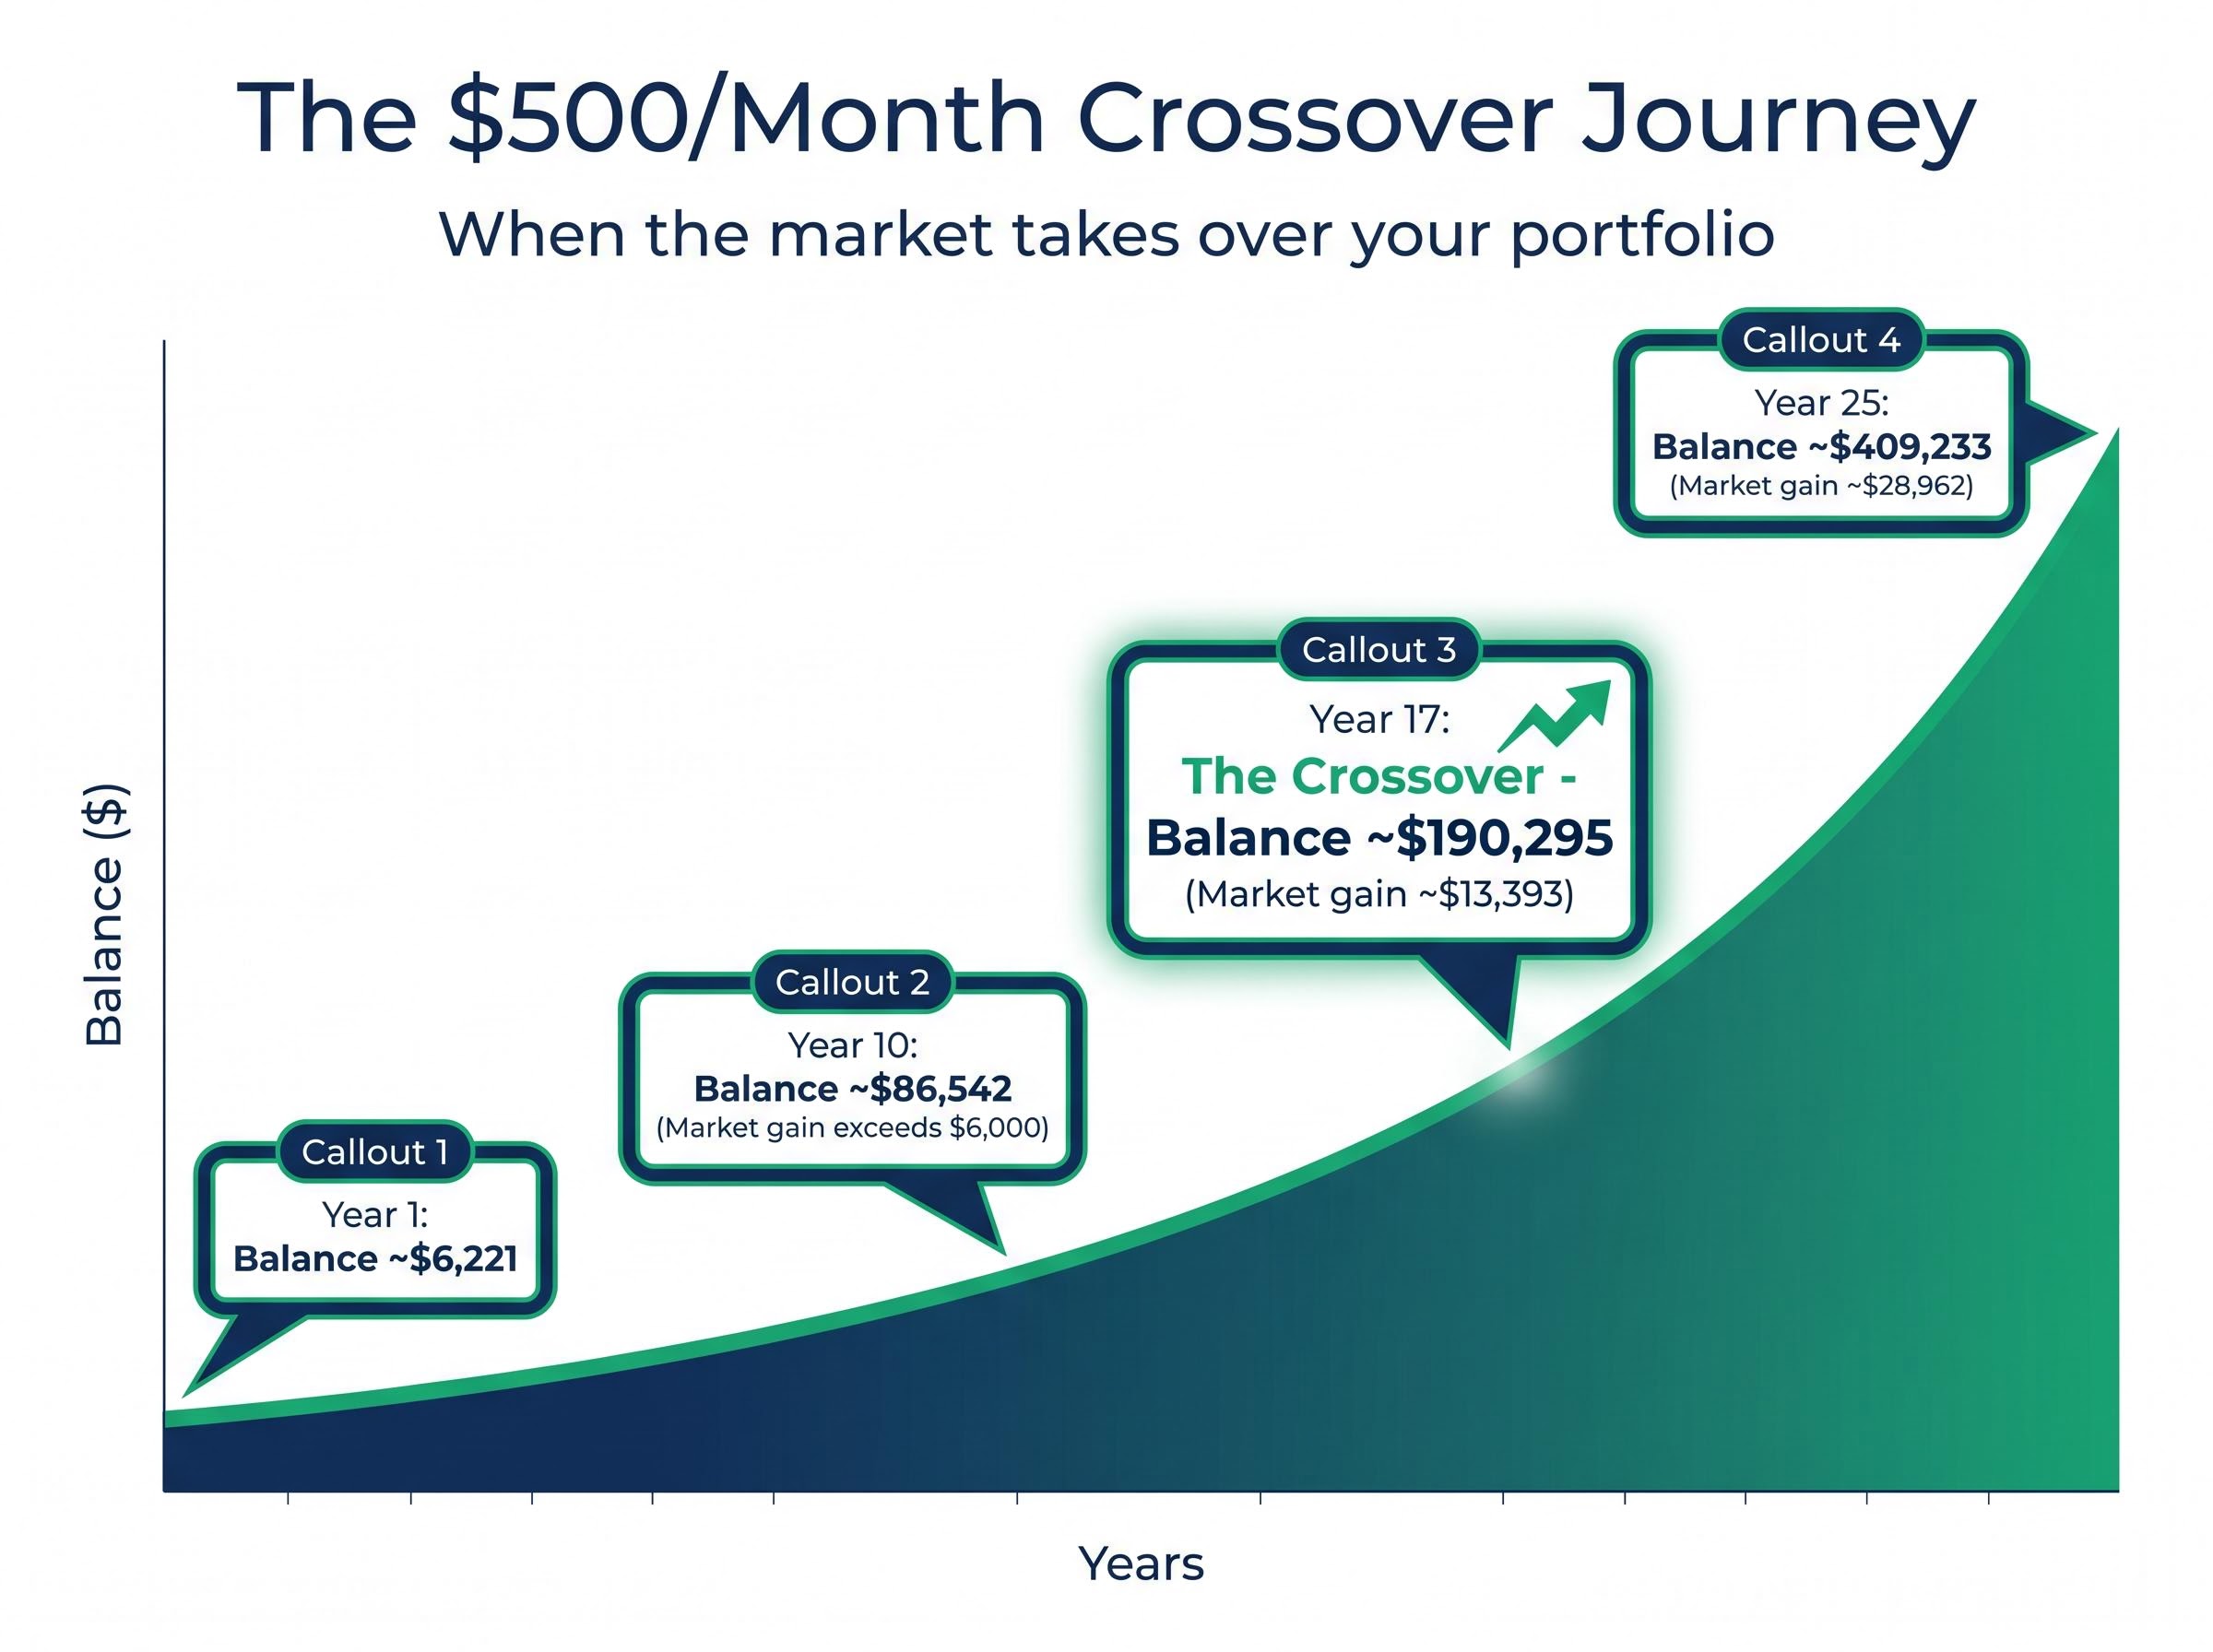
By year 20, the account value reaches approximately $260,463, with a single-year gain of roughly $18,396, approximately three times the annual contribution. By year 25, the investor has deposited $150,000 in total. The account value is approximately $409,233. The single-year market gain is roughly $28,962, nearly five times the annual contribution.
$150,000 from the investor. $259,000 from the market. That is what 25 years of not quitting produces.
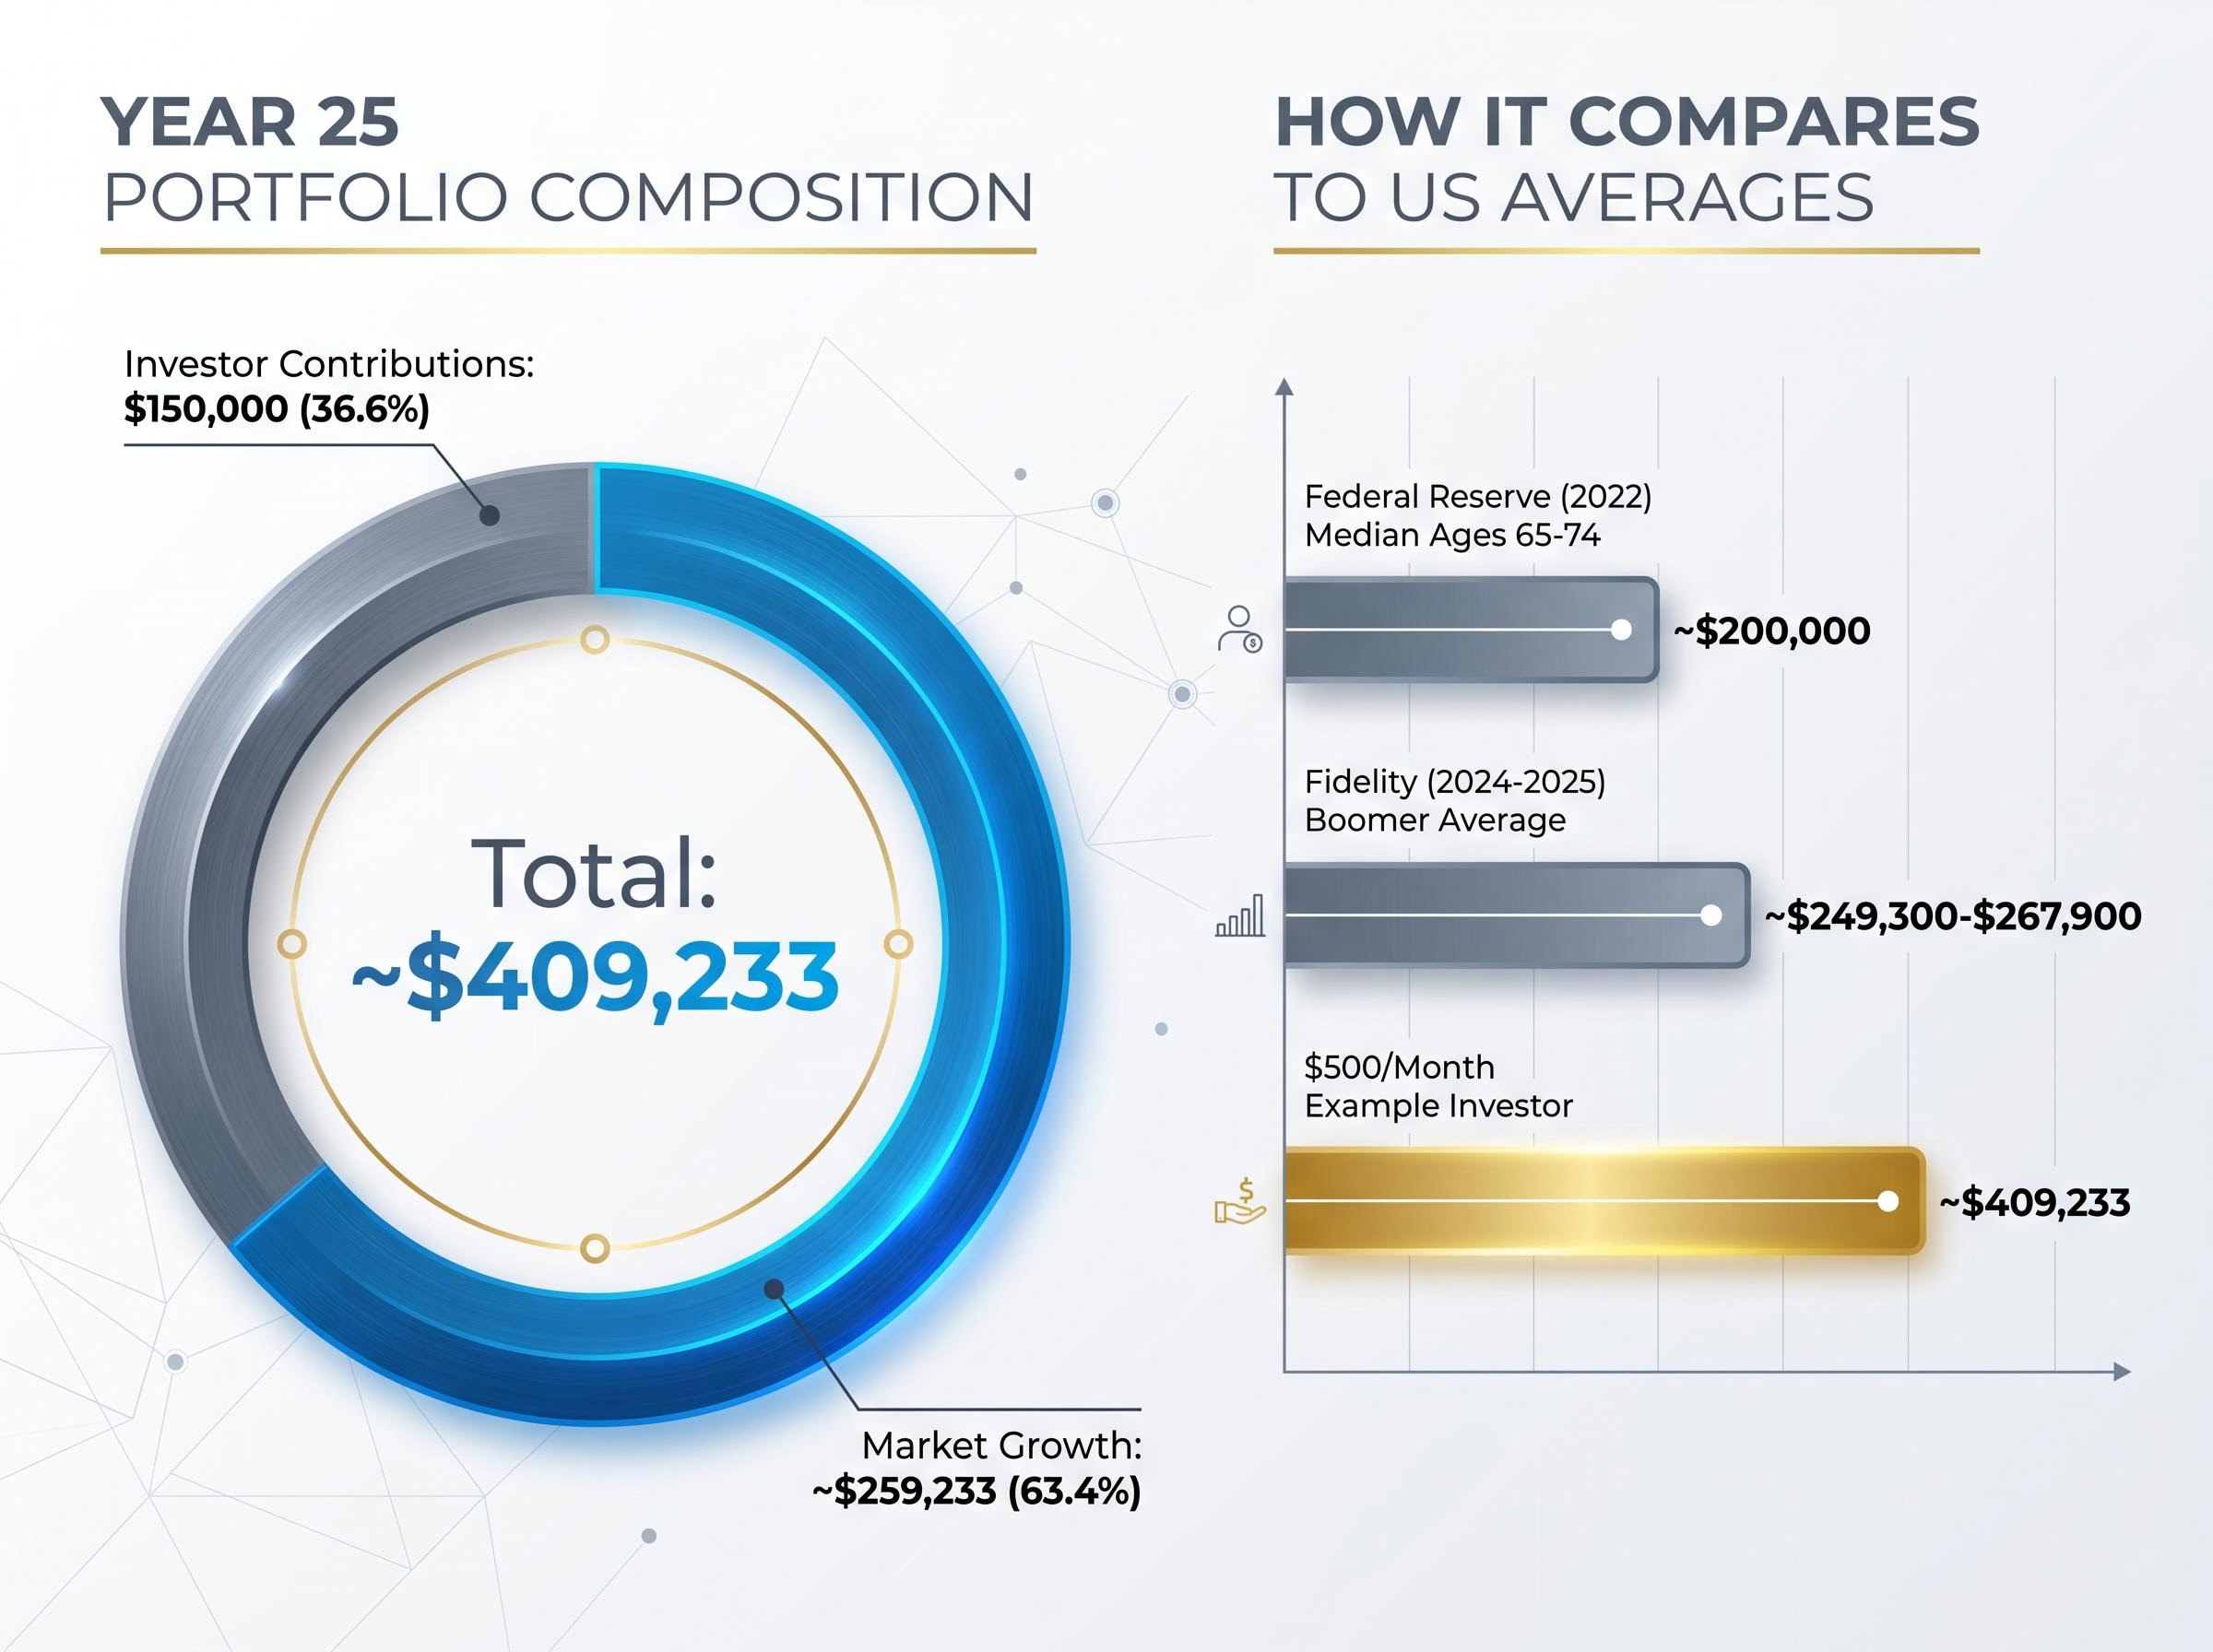
At year 25, the investor’s contributions account for approximately 36.6% of the final portfolio value. The market accounts for approximately 63.4%. Only one in five Americans aged 55 has approximately $447,000 saved for retirement. The example investor reaches approximately $409,233 through $500 monthly contributions alone.
| Year | Annual Contribution ($) | Single-Year Market Gain ($) | Running Account Balance ($) |
|---|---|---|---|
| 10 | $6,000 | ~$6,049 | ~$86,542 |
| 15 | $6,000 | ~$10,919 | ~$155,392 |
| 17 | $6,000 | ~$13,393 | ~$190,295 |
| 20 | $6,000 | ~$18,396 | ~$260,463 |
| 25 | $6,000 | ~$28,962 | ~$409,233 |
What happens if you stop contributing at the crossover
The crossover is a milestone of structural significance, not a permission slip to stop investing. Reaching it means the portfolio is no longer primarily dependent on the investor’s ongoing deposits for growth. The market’s annual contribution exceeds the investor’s, and that gap widens each year.
Continuing contributions beyond year 17 accelerates the final outcome materially. The compounding base is now very large, meaning each additional $6,000 annual deposit earns returns on a six-figure balance rather than a five-figure one.
Why most people never reach the crossover (and the behavioral traps that stop them)
The mathematics of $500 monthly contributions compounding at 10% are straightforward. The reason most investors never benefit from them is behavioral.
The most dangerous window is years two through six. This is when account growth looks negligible relative to the effort, when the first market downturn typically arrives, and when competing financial pressures (a car repair, a rent increase, a wedding) create reasons to pause contributions. Roughly 60% of new investors are estimated to exit the market around year six, forfeiting the bulk of long-term compound gains.
Three primary behavioral threats derail the strategy:
- Early dropout: Stopping contributions during years two through six because visible growth has not materialised
- Panic-selling during downturns: Liquidating holdings after a market decline, locking in losses and exiting before recovery
- Lifestyle inflation absorbing raises: Spending salary increases rather than directing them toward the investment, slowly eroding the final outcome without a single dramatic decision
Investors who maintained $500 monthly contributions through the 2008 financial crisis reportedly surpassed their pre-crash portfolio trajectory within approximately four years.
Inflation, cited at approximately 3% per year, erodes the purchasing power of uninvested cash. High-interest debt above approximately 7% annual interest represents a prerequisite concern: debt at that rate outpaces expected investment returns and should be addressed before committing to regular investing.
What market crashes actually do to a consistent investor’s portfolio
A 30% market decline, for a consistent monthly contributor, results in a 30% increase in shares purchasable with the same fixed contribution. Fixed contributions buy more units when prices are lower, a mechanism known as dollar-cost averaging. Over time, this means market crashes during the accumulation phase tend to benefit long-term contributors by lowering their average cost per share.
The danger is not the crash itself. It is the investor’s response to it.
After 25 years: what $500 a month actually builds
At the end of 25 years, the investor has deposited $150,000. The account value sits at approximately $409,233. The market has contributed approximately $259,233.
The investor accounts for 36.6% of the final value. The market accounts for 63.4%.
$150,000 from you. $259,000 from the market. That is what 25 years of not quitting produces.
Placed against actual US retirement savings data, the result is stark:
- Federal Reserve Survey of Consumer Finances (2022): median retirement savings for Americans aged 65-74 is approximately $200,000
- Fidelity workplace data (2024-2025): average 401(k) balance for Baby Boomers is approximately $249,300-$267,900
- Only one in five Americans aged 55 has approximately $447,000 saved
The example investor, contributing $500 a month and nothing more, reaches approximately $409,233. That outcome exceeds both the Federal Reserve median and the Fidelity average for the generation closest to retirement.
The single most important behavioral requirement is not brilliance, timing, or fund selection. It is starting and not stopping.
This article is for informational purposes only and should not be considered financial advice. Investors should conduct their own research and consult with financial professionals before making investment decisions. Past performance does not guarantee future results. Financial projections are subject to market conditions and various risk factors.
Consistency is the only edge that compounds alongside your money
The strategy’s power is not in the monthly amount. It is in the structural shift that occurs at the crossover point, when market gains permanently exceed contributions and the portfolio becomes self-sustaining in a way that no amount of additional effort can replicate.
The real difficulty is not mathematical. It is behavioral. Seventeen years of consistent contributions, particularly through the psychologically barren stretch of years two through six, is genuinely hard. Markets will fall. Budgets will tighten. The account balance will, at times, look like it is going nowhere.
Every month of continued contributions moves the crossover point closer. The investor’s job is not to predict the market, pick the right fund, or time the entry. It is to stay in long enough for the mathematics to take over.
Calculating a personal crossover timeline based on current contribution amount and existing portfolio value can turn an abstract commitment into a concrete target. Automating contributions removes the monthly decision from the equation entirely, replacing discipline with structure. The compounding does the rest.