10 Approved Rivals, Yet S&P Global’s Moat Keeps Compounding
49 mins ago

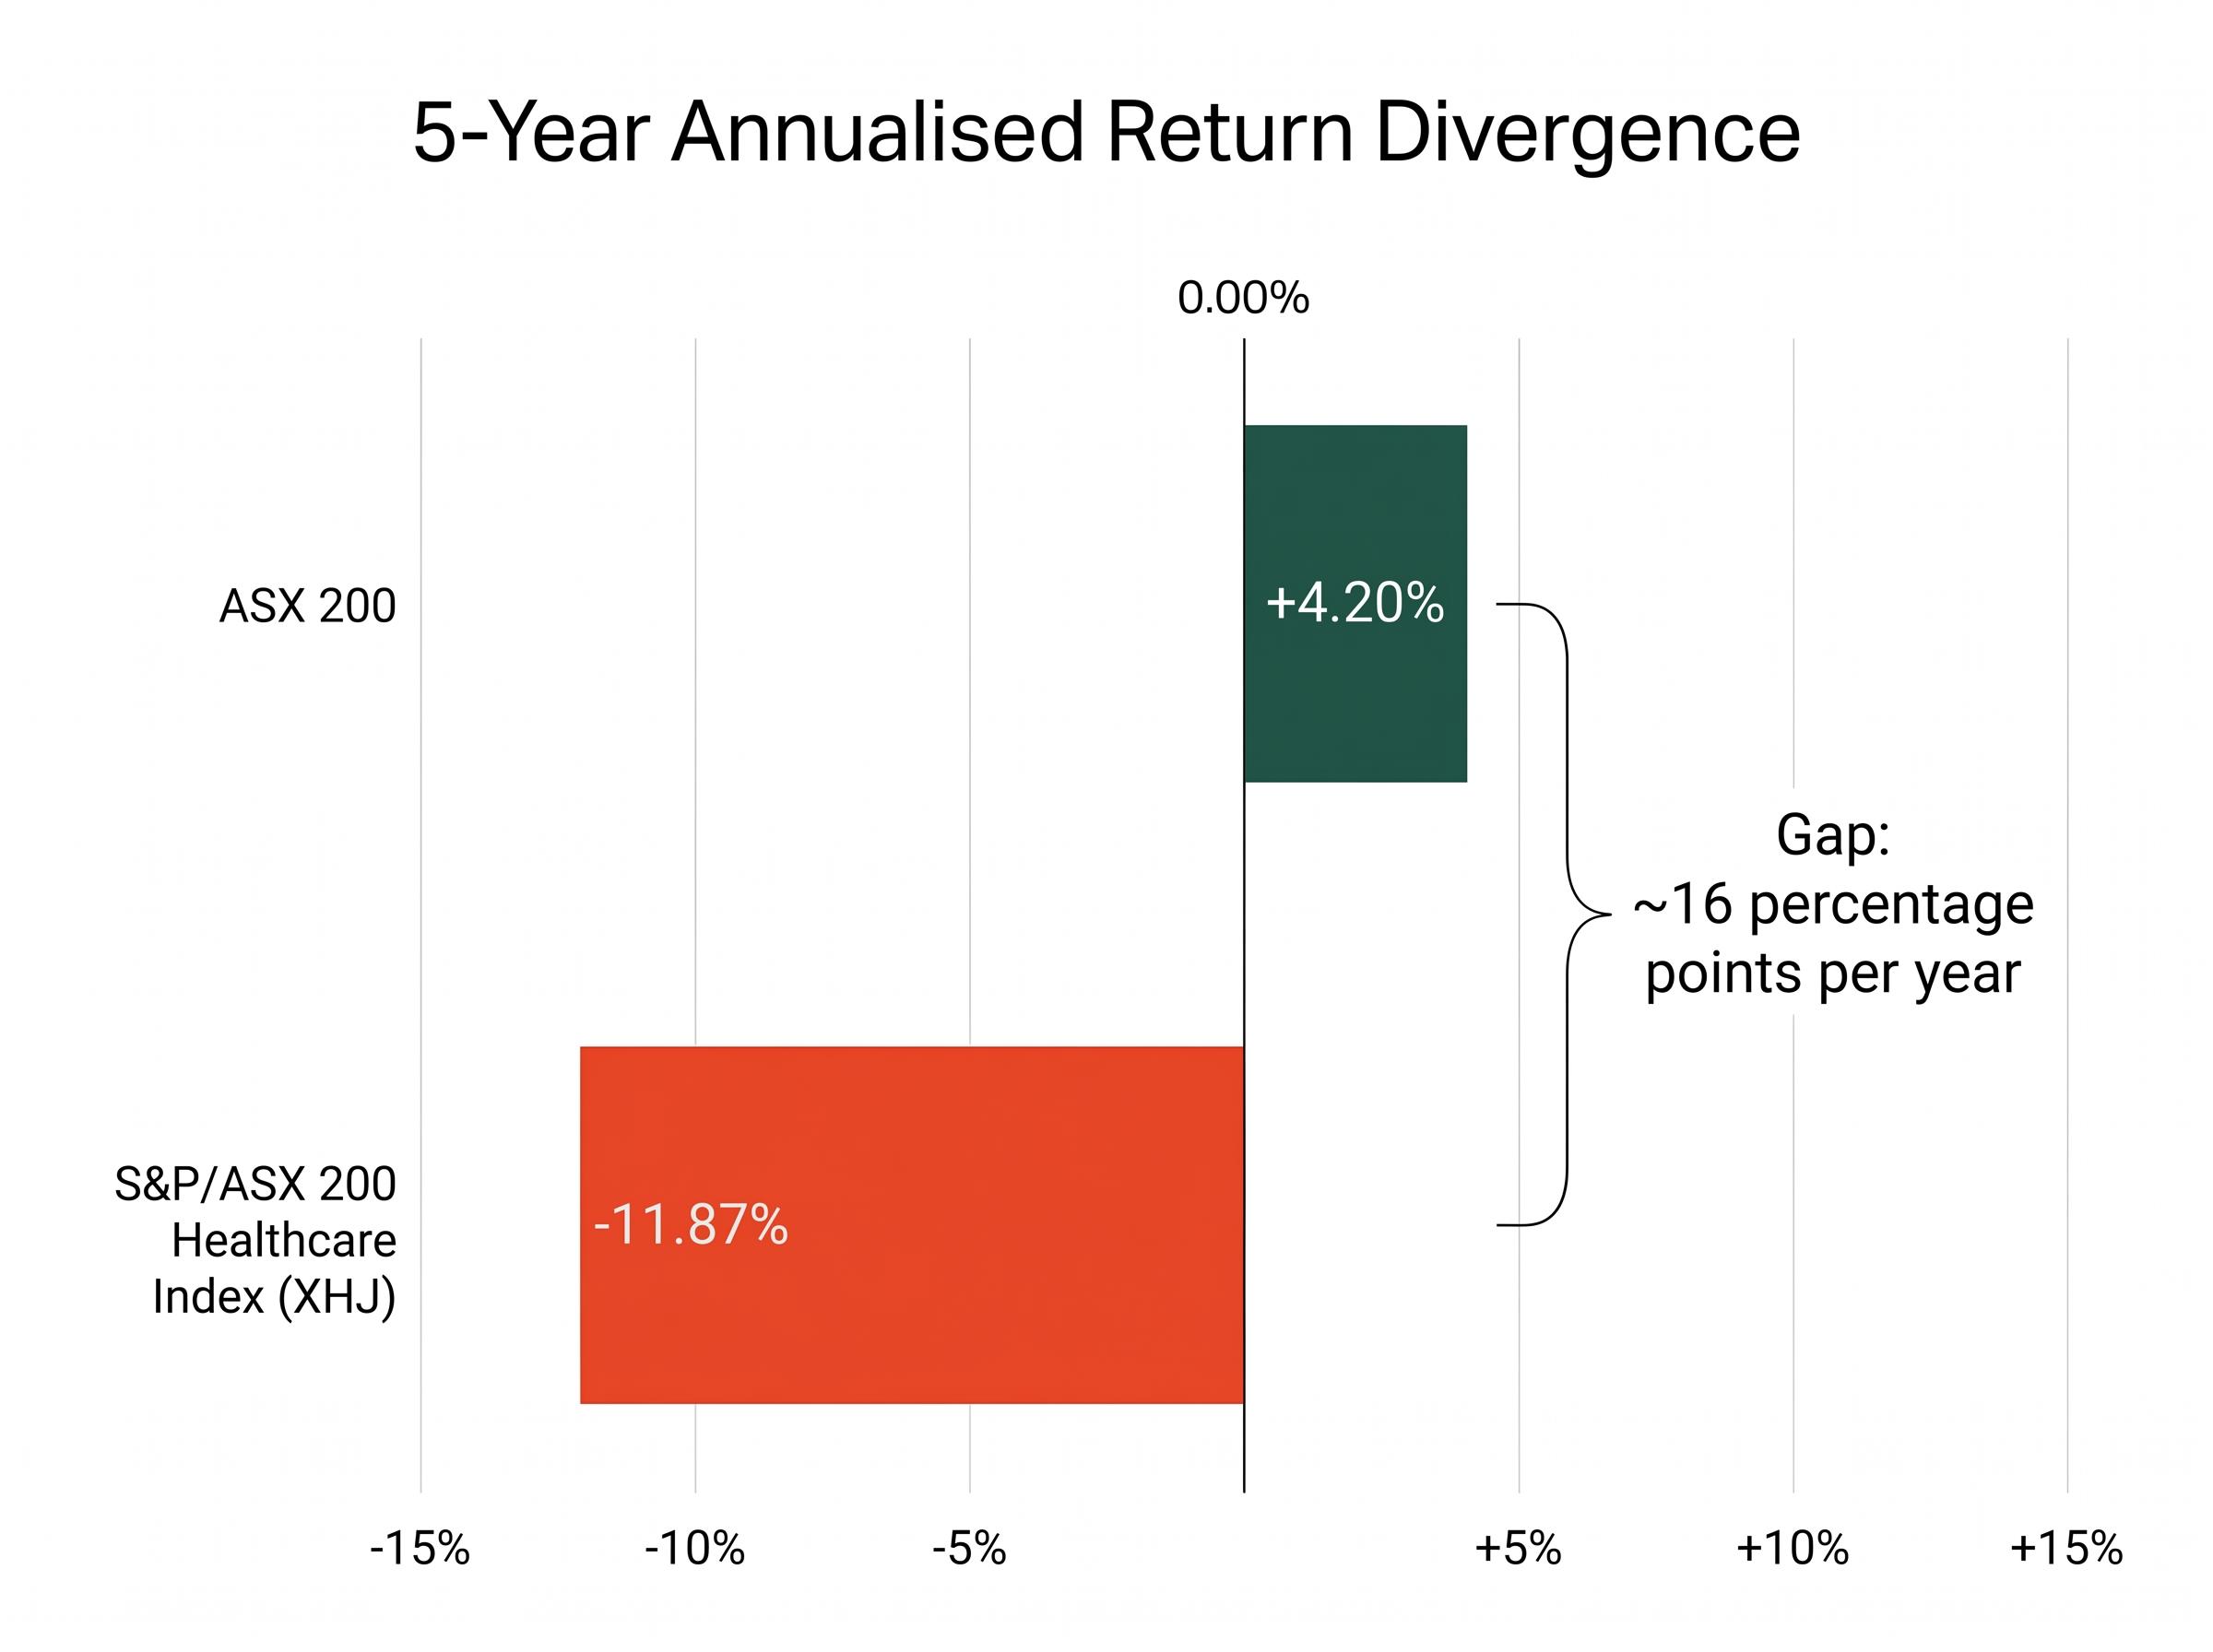
The S&P/ASX 200 Healthcare Index (XHJ) has delivered an annualised return of -11.87% over the past five years. The broader ASX 200, over the same period, compounded at +4.20%. That is not a single bad quarter or a post-pandemic correction; it is a sustained structural divergence of more than 16 percentage points per year, extending through multiple market cycles and macro regimes.
Healthcare was the strongest-performing ASX sector during the Global Financial Crisis. It is now the worst performer over a five-year horizon ending in mid-2026, with XHJ down approximately 45% over the 12 months to May 2026. The sector that Australian investors historically treated as a defensive anchor has instead become a source of significant capital destruction.
What follows is an examination of whether the conditions driving that underperformance are structural and permanent, or whether they have created a forward-looking opportunity in a sector with non-discretionary revenue, projected US spending growth, and an accelerating healthcare technology sub-segment. The analysis closes with a valuation case study and risk framework designed to help investors distinguish genuine opportunity from a falling-knife trap.
The scale of the divergence between ASX healthcare and the broader market is difficult to contextualise without direct comparison across multiple timeframes. The following table presents the confirmed performance data.
| Metric | XHJ | ASX 200 | Gap |
|---|---|---|---|
| Five-year annualised return | -11.87% | +4.20% | ~16 pp/yr |
| 2025 calendar year (total return) | -23.66% | Positive | Worst ASX 200 sector |
| 12-month return to May 2026 | ~-45% | Positive | Significant |
-11.87% annualised vs +4.20% annualised. Over five years, the gap between the healthcare sector and the broader ASX 200 has compounded into one of the widest sector-level performance divergences in the index’s history.
XHJ’s 2025 price return of -24.91% made it the single worst-performing sector within the ASX 200 for that calendar year. As of 21-22 May 2026, the index sat at approximately 22,948, with no confirmed recovery underway.
The question is straightforward: if this sector is structurally defensive, why has it produced this level of sustained loss? Answering that requires understanding what “defensive” actually means in healthcare, and whether that characteristic has been overwhelmed by other forces.
The bond-proxy unwind that accompanied rising interest rates is the most precise mechanism analysts have identified for the compression: healthcare stocks rated like long-duration bonds suffered multiple contraction as discount rates rose, independent of any deterioration in underlying business fundamentals.
The term “defensive sector” is used frequently in portfolio construction, but its meaning in healthcare is unusually specific. Healthcare demand is non-discretionary, meaning patients do not defer surgery, diagnostic imaging, or medication because consumer sentiment deteriorates or interest rates rise. Revenue in this sector is driven by medical need rather than economic choice.
This contrasts directly with cyclical sectors where demand tracks broader economic conditions:
In cyclical sectors such as resources, retail, and consumer discretionary, revenue rises and falls with economic activity. Healthcare revenue, by contrast, tends to persist through downturns because the underlying demand cannot be substituted or deferred.
The most credible available stress-test of this thesis is the Global Financial Crisis. According to Rask Media analysis, the ASX healthcare sector delivered the strongest returns of any sector during that downturn, precisely because demand did not contract when broader economic activity collapsed.
One historical episode does not guarantee future performance, and structural conditions in 2026 differ materially from 2008-2009. However, the GFC evidence demonstrates that the non-discretionary characteristic has been tested under severe conditions and held. The current five-year underperformance, then, is not easily explained by a collapse in fundamental demand; other forces, including valuation compression and sentiment shifts, appear to be the primary drivers.
The defensive thesis explains why healthcare revenue persists through downturns. The growth thesis requires a different set of evidence, and the US healthcare market provides it.
The United States accounts for over 40% of total global healthcare expenditure, making its demand trajectory disproportionately relevant to ASX-listed healthcare companies with US operations or US-denominated revenue. Several prominent ASX healthcare names, including Pro Medicus, generate a material share of their revenue from US hospital systems and health networks.
US$819 billion. That is the projected total US healthcare spend, based on an estimated annual growth rate of approximately 7% between 2022 and 2027. For ASX-listed companies with US exposure, this demand trajectory represents a structural revenue tailwind that operates independently of Australian domestic conditions.
It should be noted that these projections originate from sector research cited by Rask Media, and specific forecasting institutions have not been named in available sources. The figures should be treated as directional rather than independently verified.
The CMS National Health Expenditure projections provide official backing for the US spending growth trajectory, reporting that NHE grew 7.2% to $5.3 trillion in 2024 and is projected to grow at an average of 5.8% annually through 2033, establishing the demand baseline that ASX-listed companies with US revenue exposure are positioned to benefit from.
Three structural factors underpin the projected expansion:
For Australian investors holding ASX healthcare stocks with US revenue exposure, these demand drivers create a revenue growth runway that extends well beyond the current sector sentiment.
Healthcare is not a monolith. Within the broader sector, healthcare IT and software-as-a-service (SaaS) companies, those selling clinical software, imaging platforms, and data analytics tools, operate on a materially different growth curve from traditional hospital operators or pharmaceutical manufacturers.
Sector research cited by Rask Media projects healthcare IT, data, and SaaS revenues to grow at more than 15% per year between 2024 and 2030. That rate is more than double the broader US healthcare spending growth projection of approximately 7%. The specific forecasting institution behind this figure has not been identified in available research, so the projection should be treated as a directional signal rather than a verified institutional forecast.
The mechanism is structural. Healthcare systems globally are undergoing a multi-year digital transformation cycle, replacing legacy paper and film-based workflows with electronic health records, cloud imaging platforms, and AI-assisted diagnostic tools.
Three characteristics of this sub-segment create defensible recurring revenue:
Revenue in this sub-segment is typically recurring under SaaS contracts, meaning growth compounds rather than resets each year. This distinction matters significantly when evaluating ASX healthcare stocks: a diagnostic imaging IT provider operates on a fundamentally different trajectory from a hospital operator, and investors should apply different valuation frameworks accordingly.
SaaS valuation benchmarks like the Rule of 40, which combines revenue growth rate and profit margin into a single score, provide a more precise framework for evaluating healthcare IT names than traditional price-to-earnings multiples, particularly for companies like Pro Medicus that are growing faster than they are generating near-term profit.
Pro Medicus (ASX: PME) provides one of the clearest illustrations of both the opportunity and the discipline required when evaluating beaten-down healthcare IT stocks.
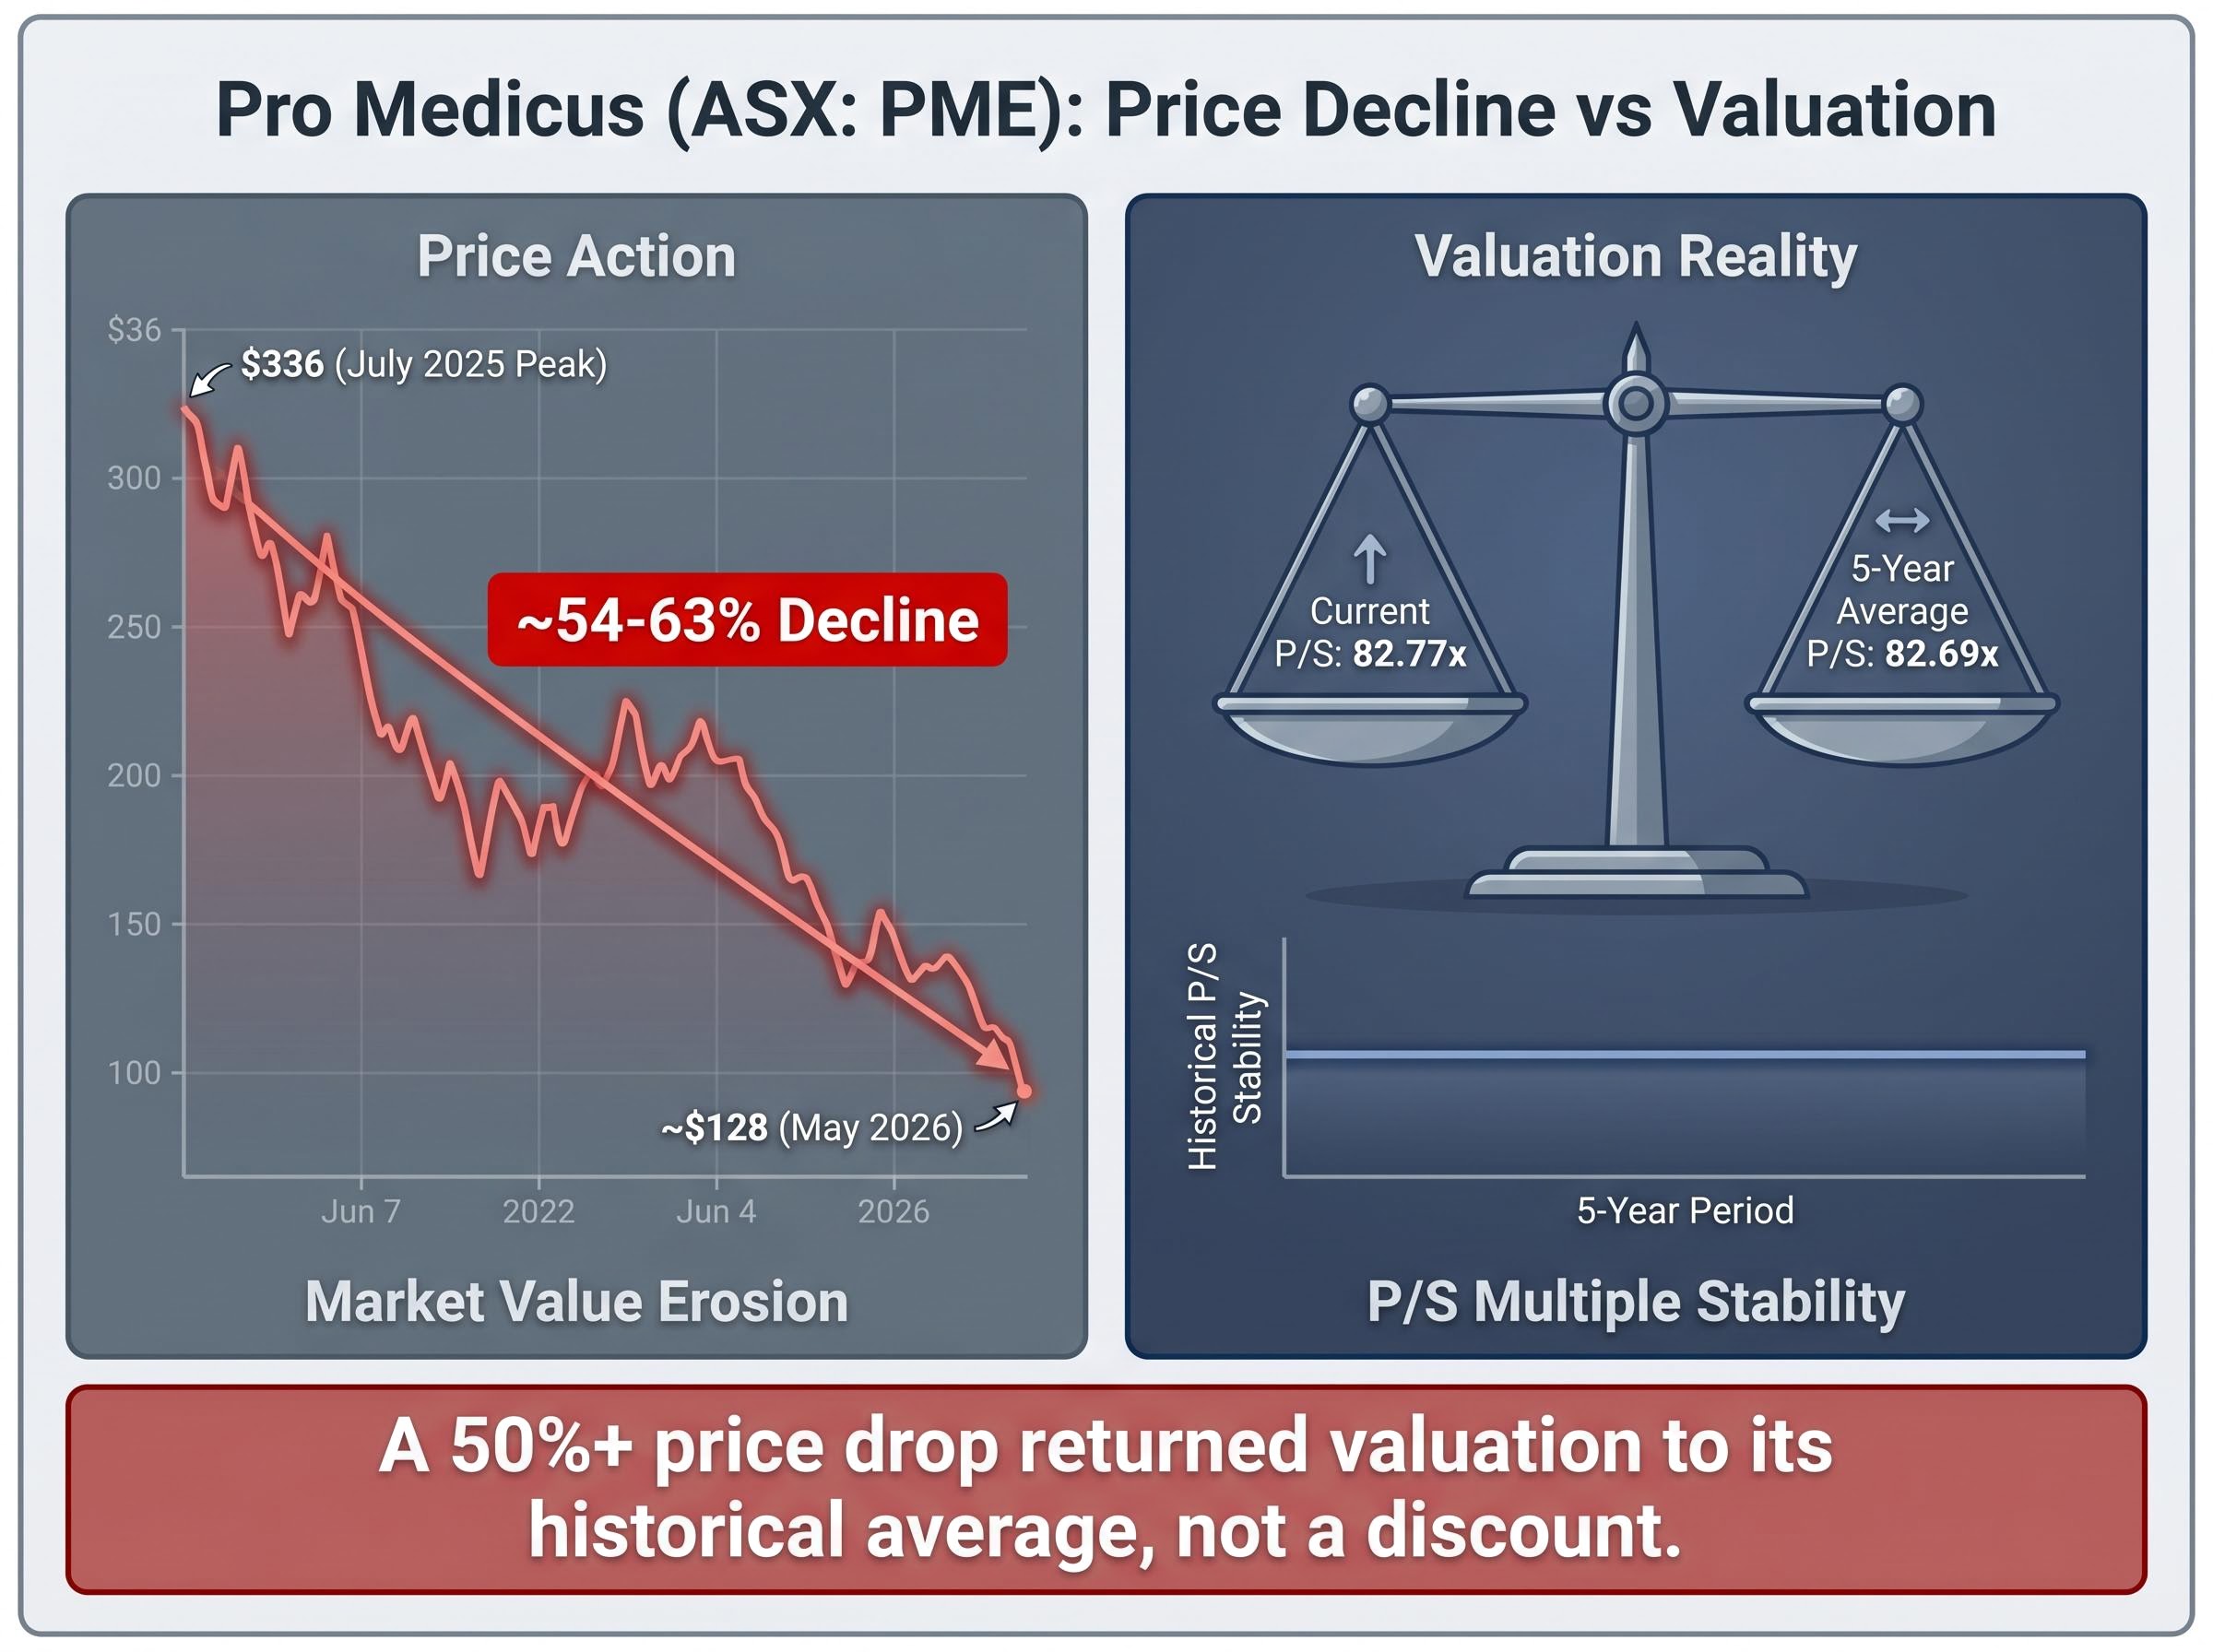
PME reached a peak share price of $336 in July 2025. As of 21-22 May 2026, the stock traded at approximately $127.95-$128.46, representing a decline of approximately 54-63% from peak. The company’s revenue has grown over the preceding three years, and its Visage imaging platform holds contracts with major US hospital systems.
| PME Metric | Value |
|---|---|
| Peak price (July 2025) | $336 |
| Current price (May 2026) | ~$128 |
| Decline from peak | ~54-63% |
| Current price-to-sales ratio | 82.77x |
| Five-year average P/S ratio | 82.69x |
The price decline is dramatic. The valuation picture is more nuanced.
82.77x current price-to-sales vs 82.69x five-year historical average. Despite a decline exceeding 50% from peak, PME’s valuation has returned to its own long-run average rather than falling into discount territory. The price drop largely corrected the premium that built during the run to $336, not the underlying business valuation.
This is not a buy or sell recommendation on PME. It is a methodological point. A large price decline does not automatically create a valuation opportunity. PME’s revenue growth has been real, and its competitive position in healthcare imaging IT remains strong. However, investors relying on “down 54%” as a valuation signal, rather than conducting rigorous discounted cash flow analysis, risk misreading the opportunity entirely.
Valuation compression in healthcare has not fallen uniformly across the sector: Cochlear’s price-to-sales ratio contracted from approximately 9.18x to 2.82x by May 2026, a compression profile that differs materially from Pro Medicus, where the price decline largely returned the stock to its own historical average rather than creating a discount.
One additional structural demand signal deserves mention. A Morgan Stanley survey found that more than 50% of surveyed investors planned to increase their sustainable investment allocations in 2024. Healthcare equities tend to score well under ESG mandates for three reasons:
No verified 2025-2026 source has been located that explicitly names Australian healthcare equities as a beneficiary of ESG capital flows. The ESG argument should be treated as a structural directional point, not a confirmed inflow figure.
Against these tailwinds, investors must weigh material risks:
A sector thesis is only as useful as its accompanying risk framework. Investors who understand both the tailwinds and the active risks are better positioned to set appropriate position sizing and entry criteria.
The analytical arc across this analysis produces a coherent but conditional conclusion. Three structural pillars support long-term interest in ASX healthcare stocks:
The 16-percentage-point annualised performance gap between XHJ and the ASX 200 over five years is large enough to warrant serious investor attention. XHJ’s level of approximately 22,948 in May 2026 represents the bottom of a sustained multi-year drawdown. However, the PME case study reinforces a critical discipline: price decline is not the same as valuation opportunity.
The appropriate investor disposition is to treat the current period as a research window rather than an entry signal. Identify the sub-segment, whether broad healthcare or healthcare IT, that fits the individual risk and return framework. Define the fundamental trigger, whether earnings inflection, valuation reaching a specific discount to historical averages, or sustained recovery in XHJ, that would be required before allocating capital. The structural case is sound. The catalyst has not yet arrived.
Institutional accumulation in global earners like CSL, Cochlear, and ResMed has accelerated precisely during this drawdown period, with funds including AustralianSuper and Hostplus characterising the multi-year de-rating as a valuation reset rather than a structural impairment, a distinction that separates conviction buyers from those waiting for sentiment confirmation.
This article is for informational purposes only and should not be considered financial advice. Investors should conduct their own research and consult with financial professionals before making investment decisions. Past performance does not guarantee future results. Financial projections referenced in this analysis are subject to market conditions and various risk factors.
The S&P/ASX 200 Healthcare Index (XHJ) tracks the performance of healthcare companies listed on the Australian Securities Exchange. Over the five years to mid-2026, it delivered an annualised return of -11.87%, compared to +4.20% for the broader ASX 200, making it the worst-performing ASX 200 sector over that period.
The primary driver identified by analysts is a bond-proxy unwind caused by rising interest rates, which compressed the valuation multiples of long-duration healthcare stocks independently of any deterioration in their underlying business fundamentals. This valuation compression, rather than a collapse in fundamental demand, accounts for much of the sustained underperformance.
The United States accounts for over 40% of global healthcare expenditure, and several ASX-listed companies including Pro Medicus generate material revenue from US hospital systems. With US National Health Expenditure growing 7.2% to $5.3 trillion in 2024 and projected to grow at an average of 5.8% annually through 2033, ASX companies with US revenue exposure benefit from a structural demand tailwind independent of Australian domestic conditions.
Healthcare IT and SaaS companies operate on a faster growth curve than traditional hospital operators or pharmaceutical manufacturers, with sector research projecting revenues in this sub-segment to grow at more than 15% per year between 2024 and 2030. High switching costs, long-duration enterprise contracts, and AI integration expanding per-contract value create defensible recurring revenue streams that compound over time.
Not necessarily, as the Pro Medicus case study illustrates. Despite falling approximately 54-63% from its July 2025 peak of $336 to around $128 in May 2026, PME's current price-to-sales ratio of 82.77x was almost identical to its five-year historical average of 82.69x, meaning the price decline largely corrected the premium built during the run-up rather than creating a discount to fundamental value.