Why the Record-Low Consumer Sentiment Reading May Not Mean Recession
30 mins ago
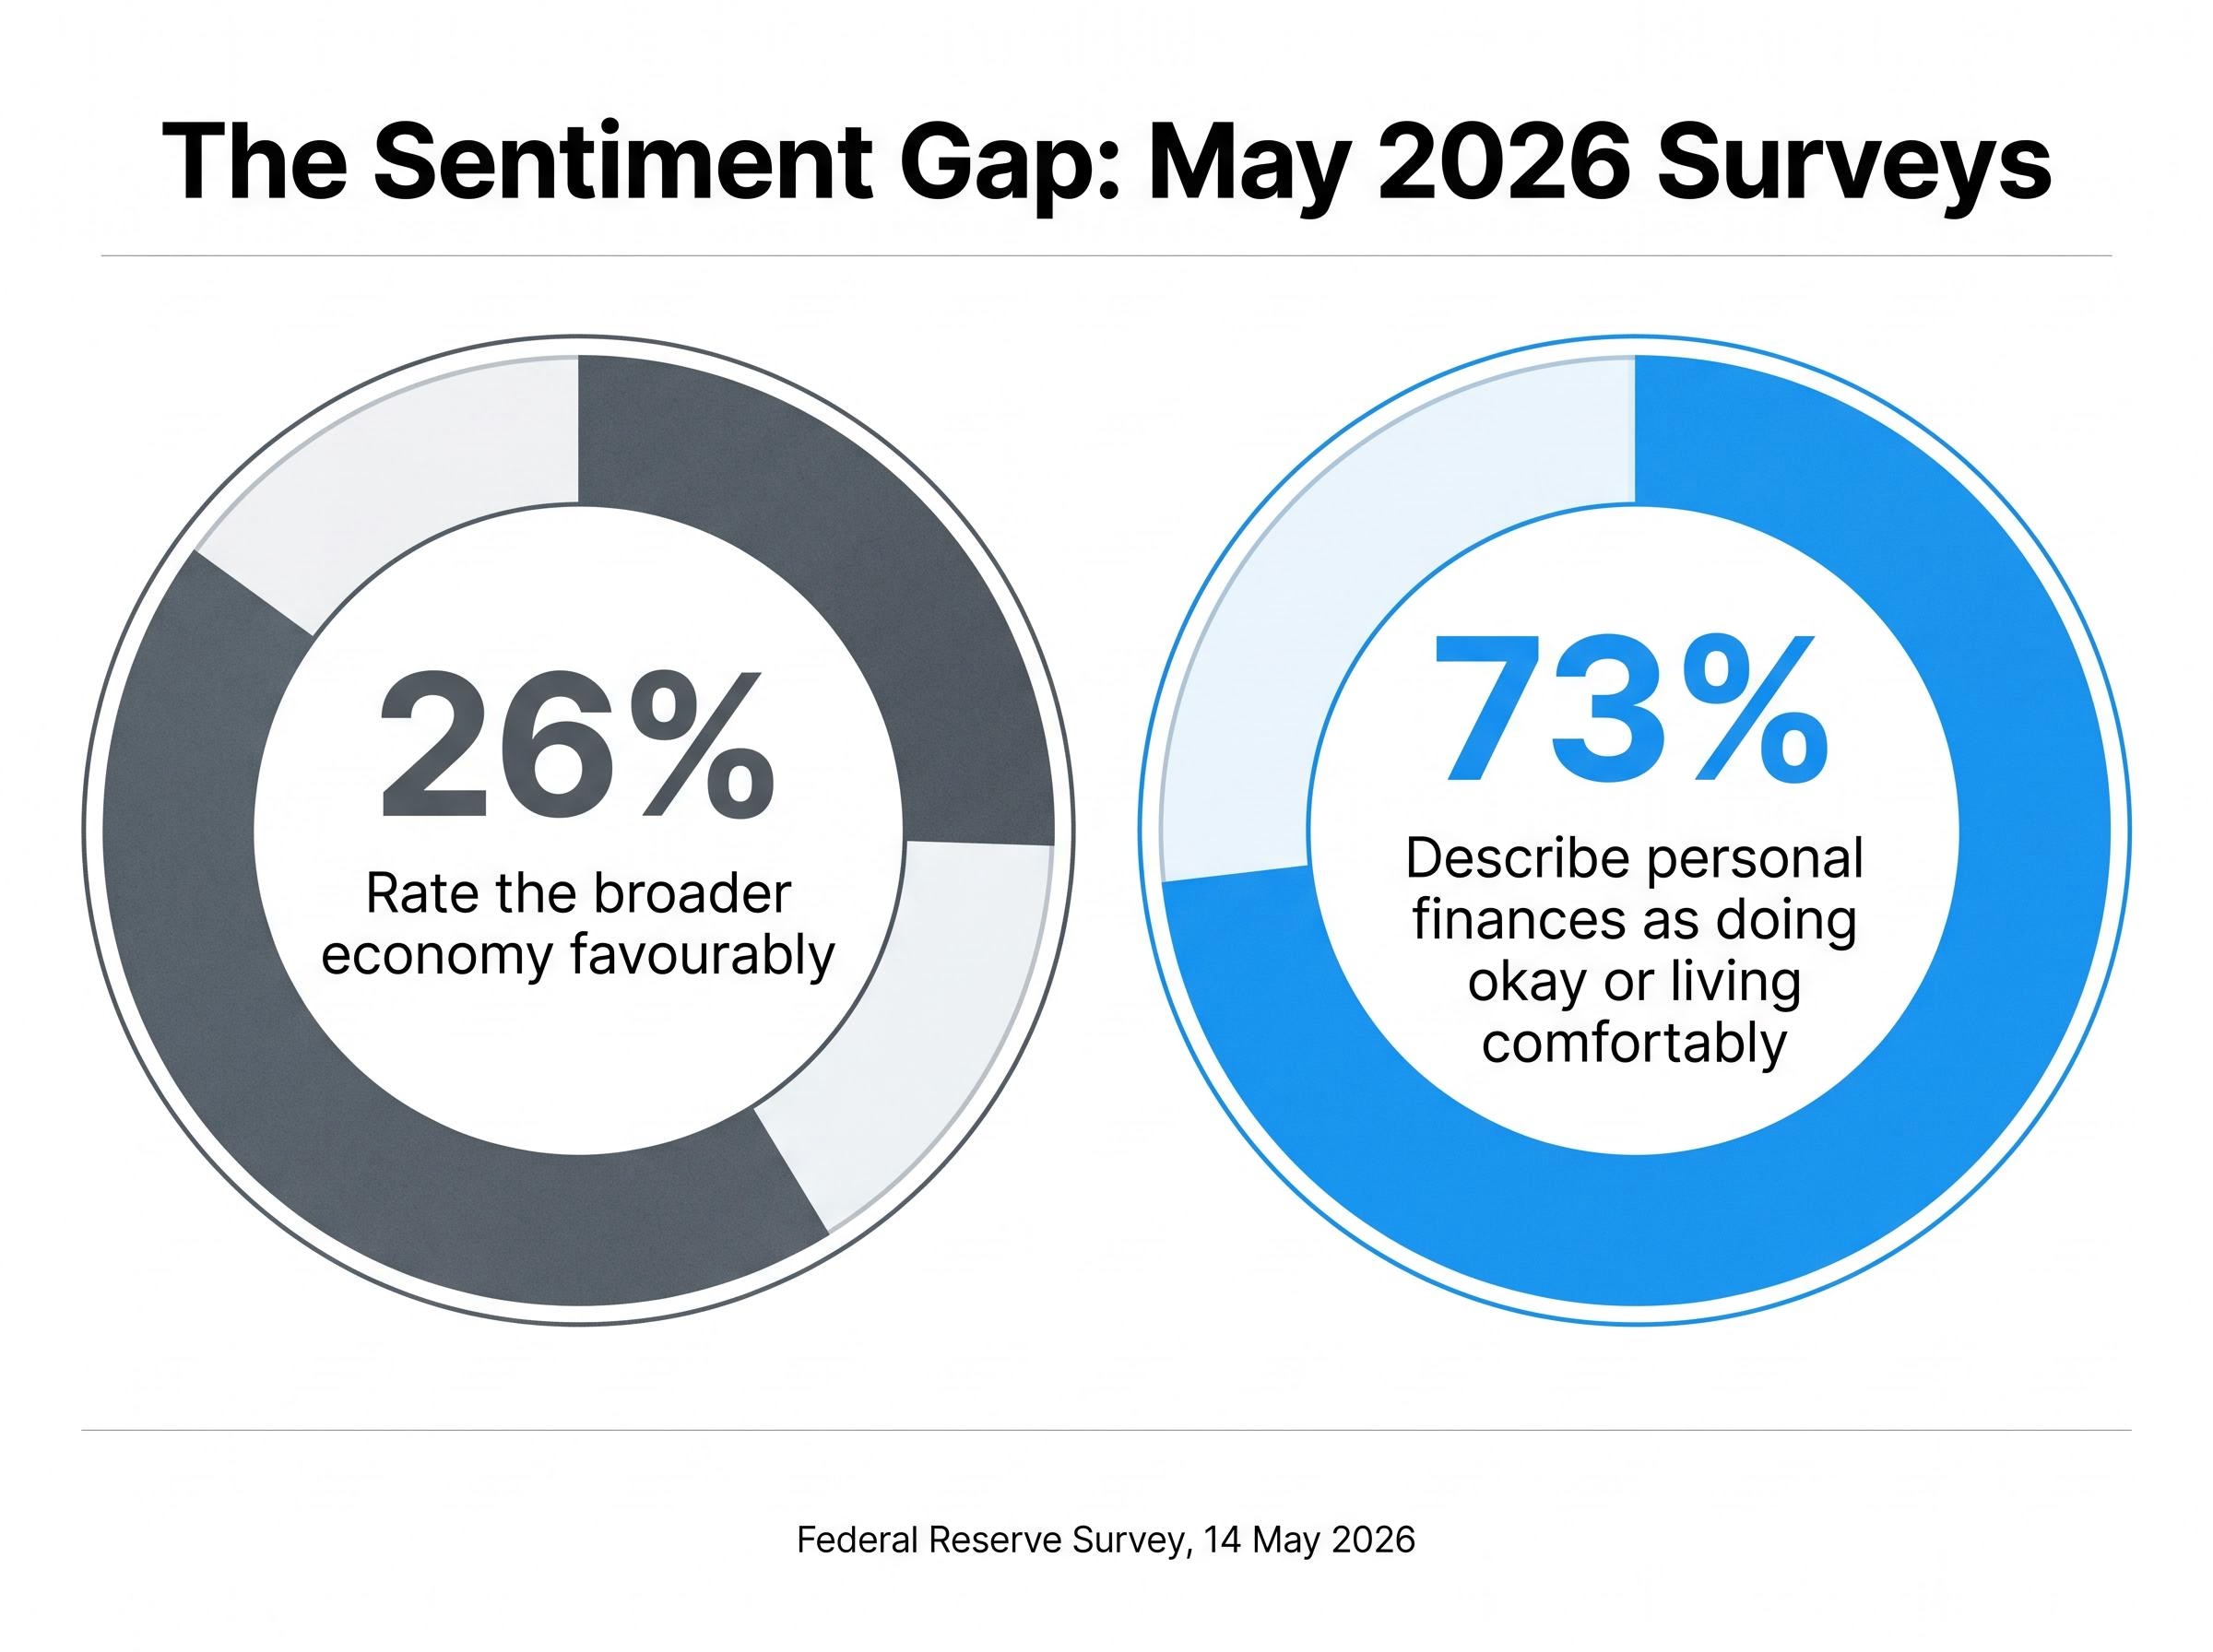
Only 26% of Americans rate the broader economy favourably. Yet 73% describe their own personal finances as doing okay or living comfortably. Both figures emerged from surveys published within days of each other in May 2026, and together they form a puzzle that has consumed economic commentary for weeks. The gap is not a paradox. It has a coherent explanation, rooted in how people process economic information, how partisan identity shapes survey responses, and where genuine financial stress actually sits in the household sector. What follows is an evidence-based account of the psychological, political, and structural forces driving the widest sentiment-reality gap on record, along with an honest assessment of where the aggregate numbers mask real hardship.
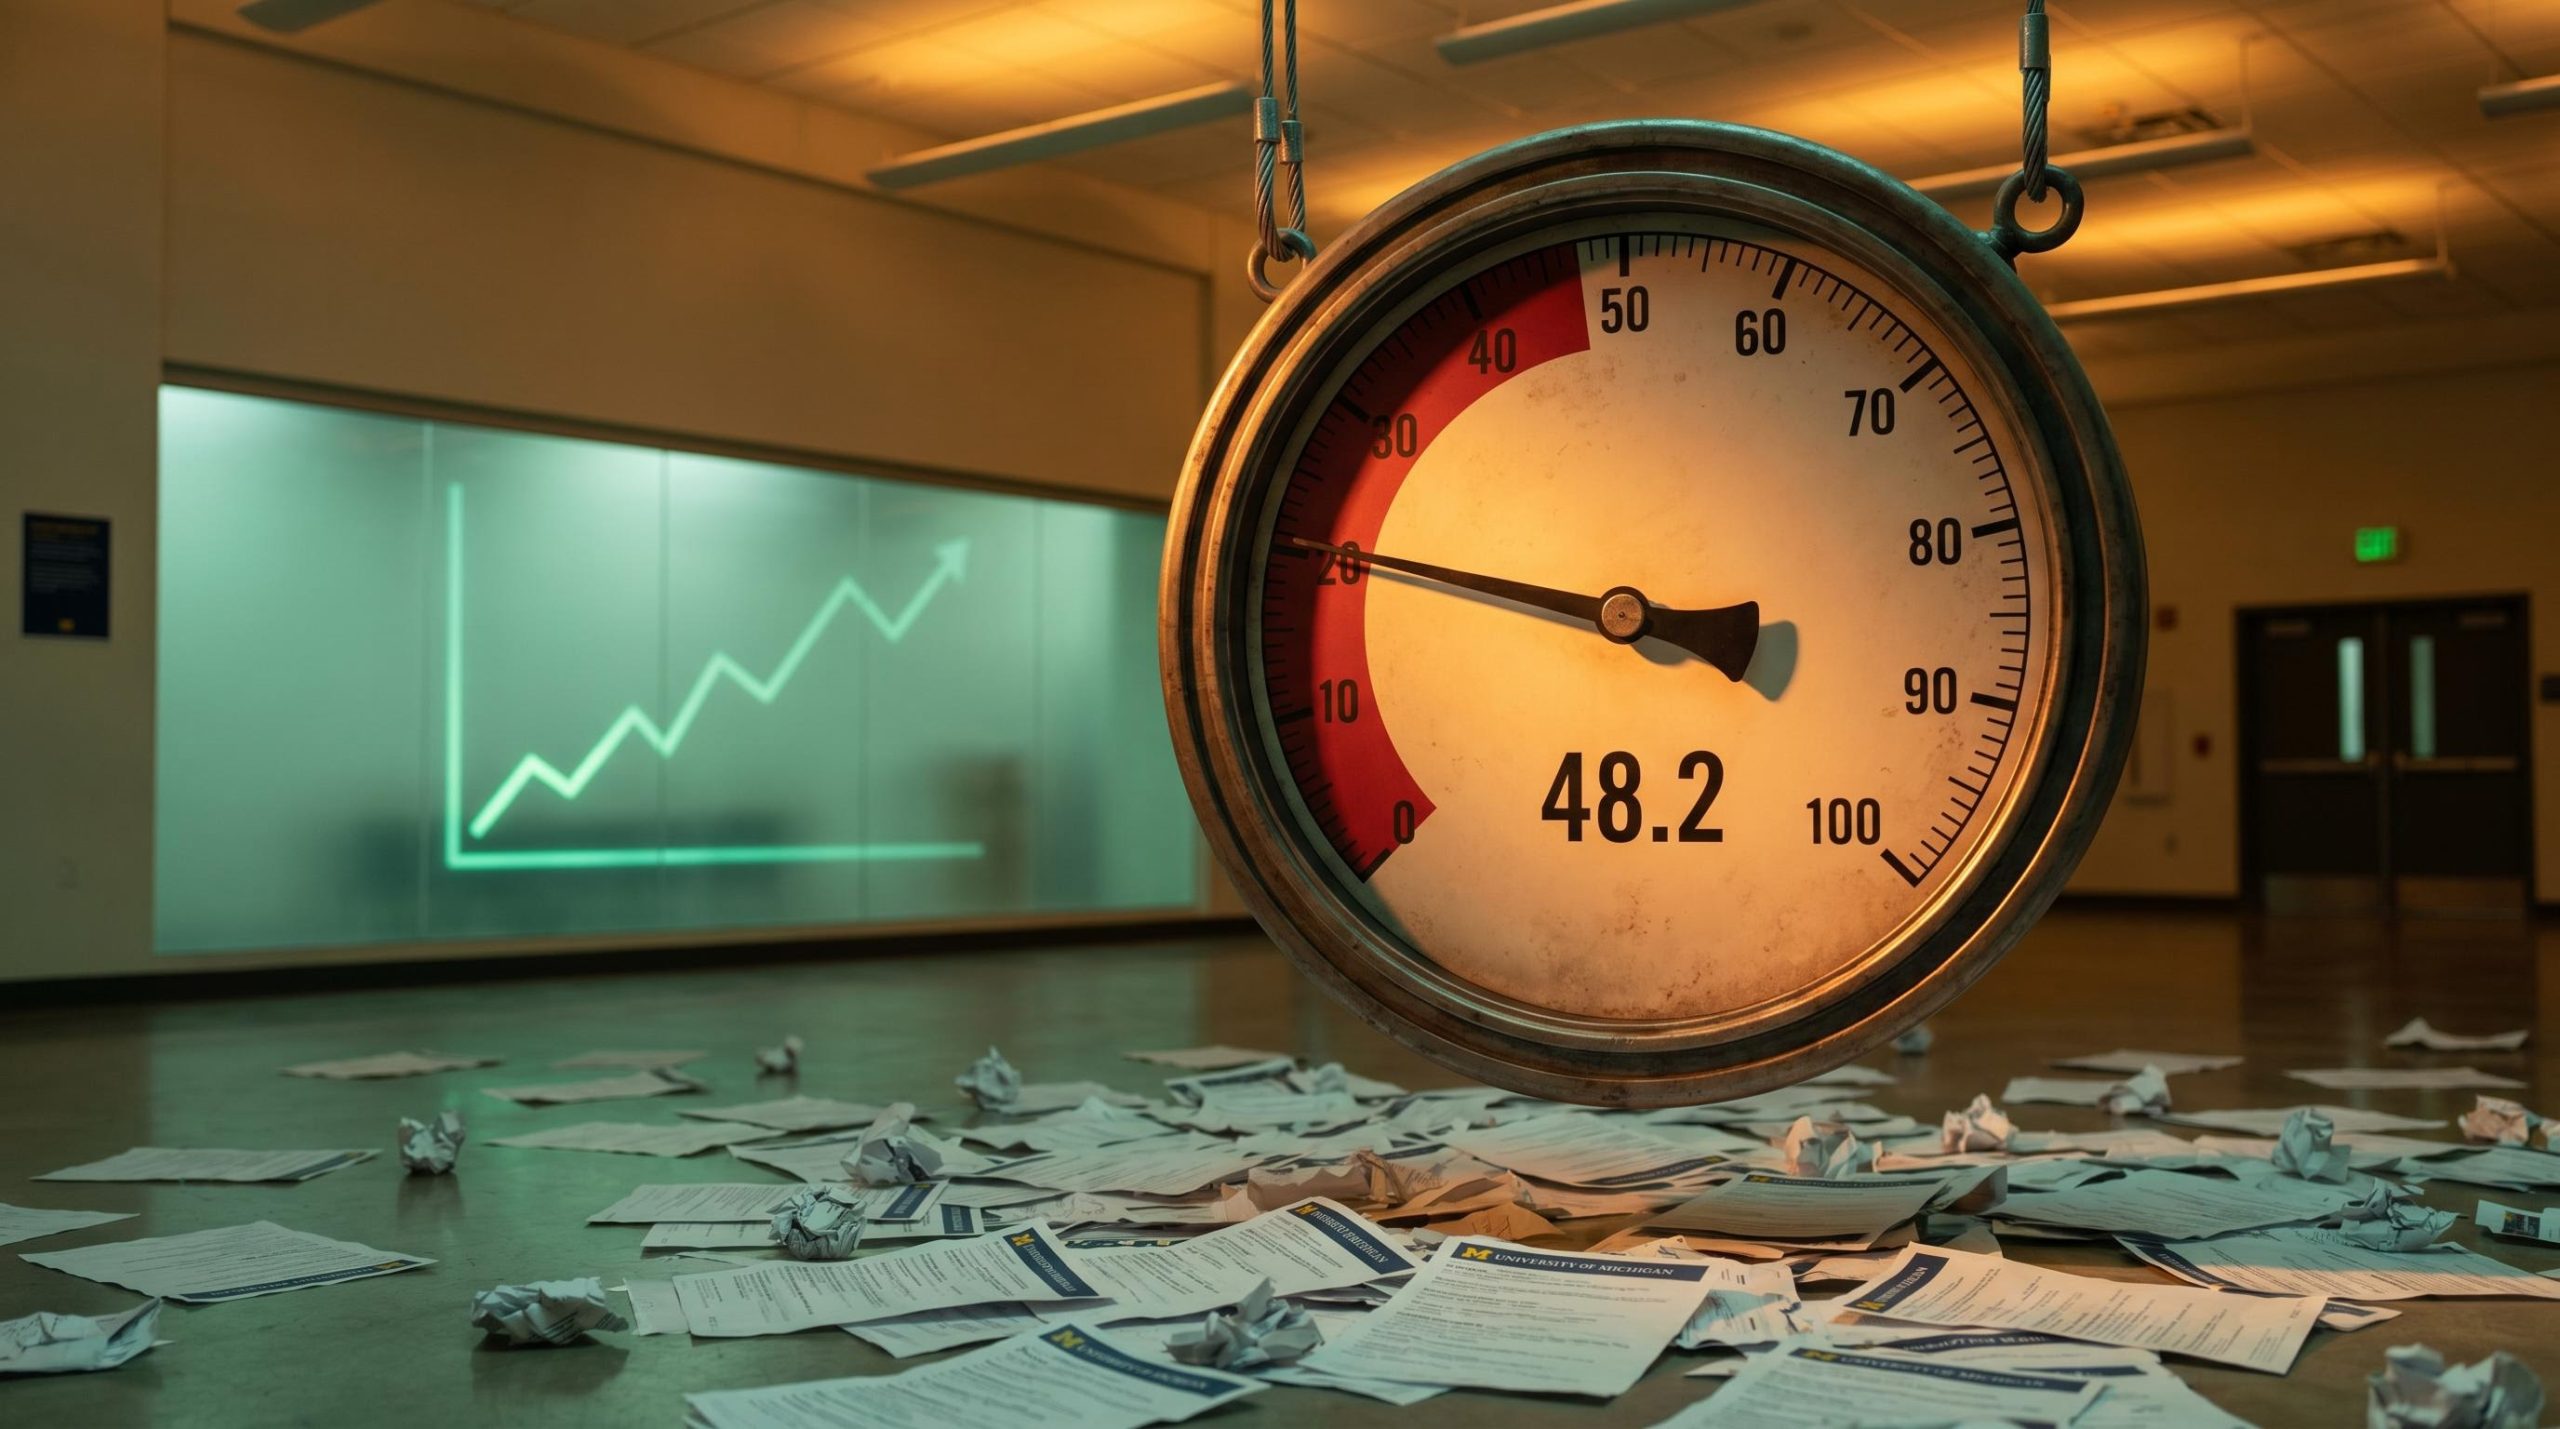
The University of Michigan’s preliminary May 2026 Consumer Sentiment Index fell to 48.2, a record low. The previous trough of 50.0, set in June 2022 amid peak inflation fears, had already been breached by the April 2026 reading of 49.8. May’s decline pushed further into territory no prior survey had reached.
Financial media coverage treated the figure as confirmation that American consumers are in crisis. The framing was understandable. A record low commands attention.
Then, on 14 May 2026, the Federal Reserve published its own survey. The finding: 73% of Americans describe their personal finances as doing okay or living comfortably, while only 26% rate the broader economy favourably.
The Federal Reserve’s SHED report, which tracks household economic wellbeing through direct self-assessment questions, is the primary source for the 73% figure, drawing on responses that ask Americans to evaluate their own financial situation rather than abstract national conditions.
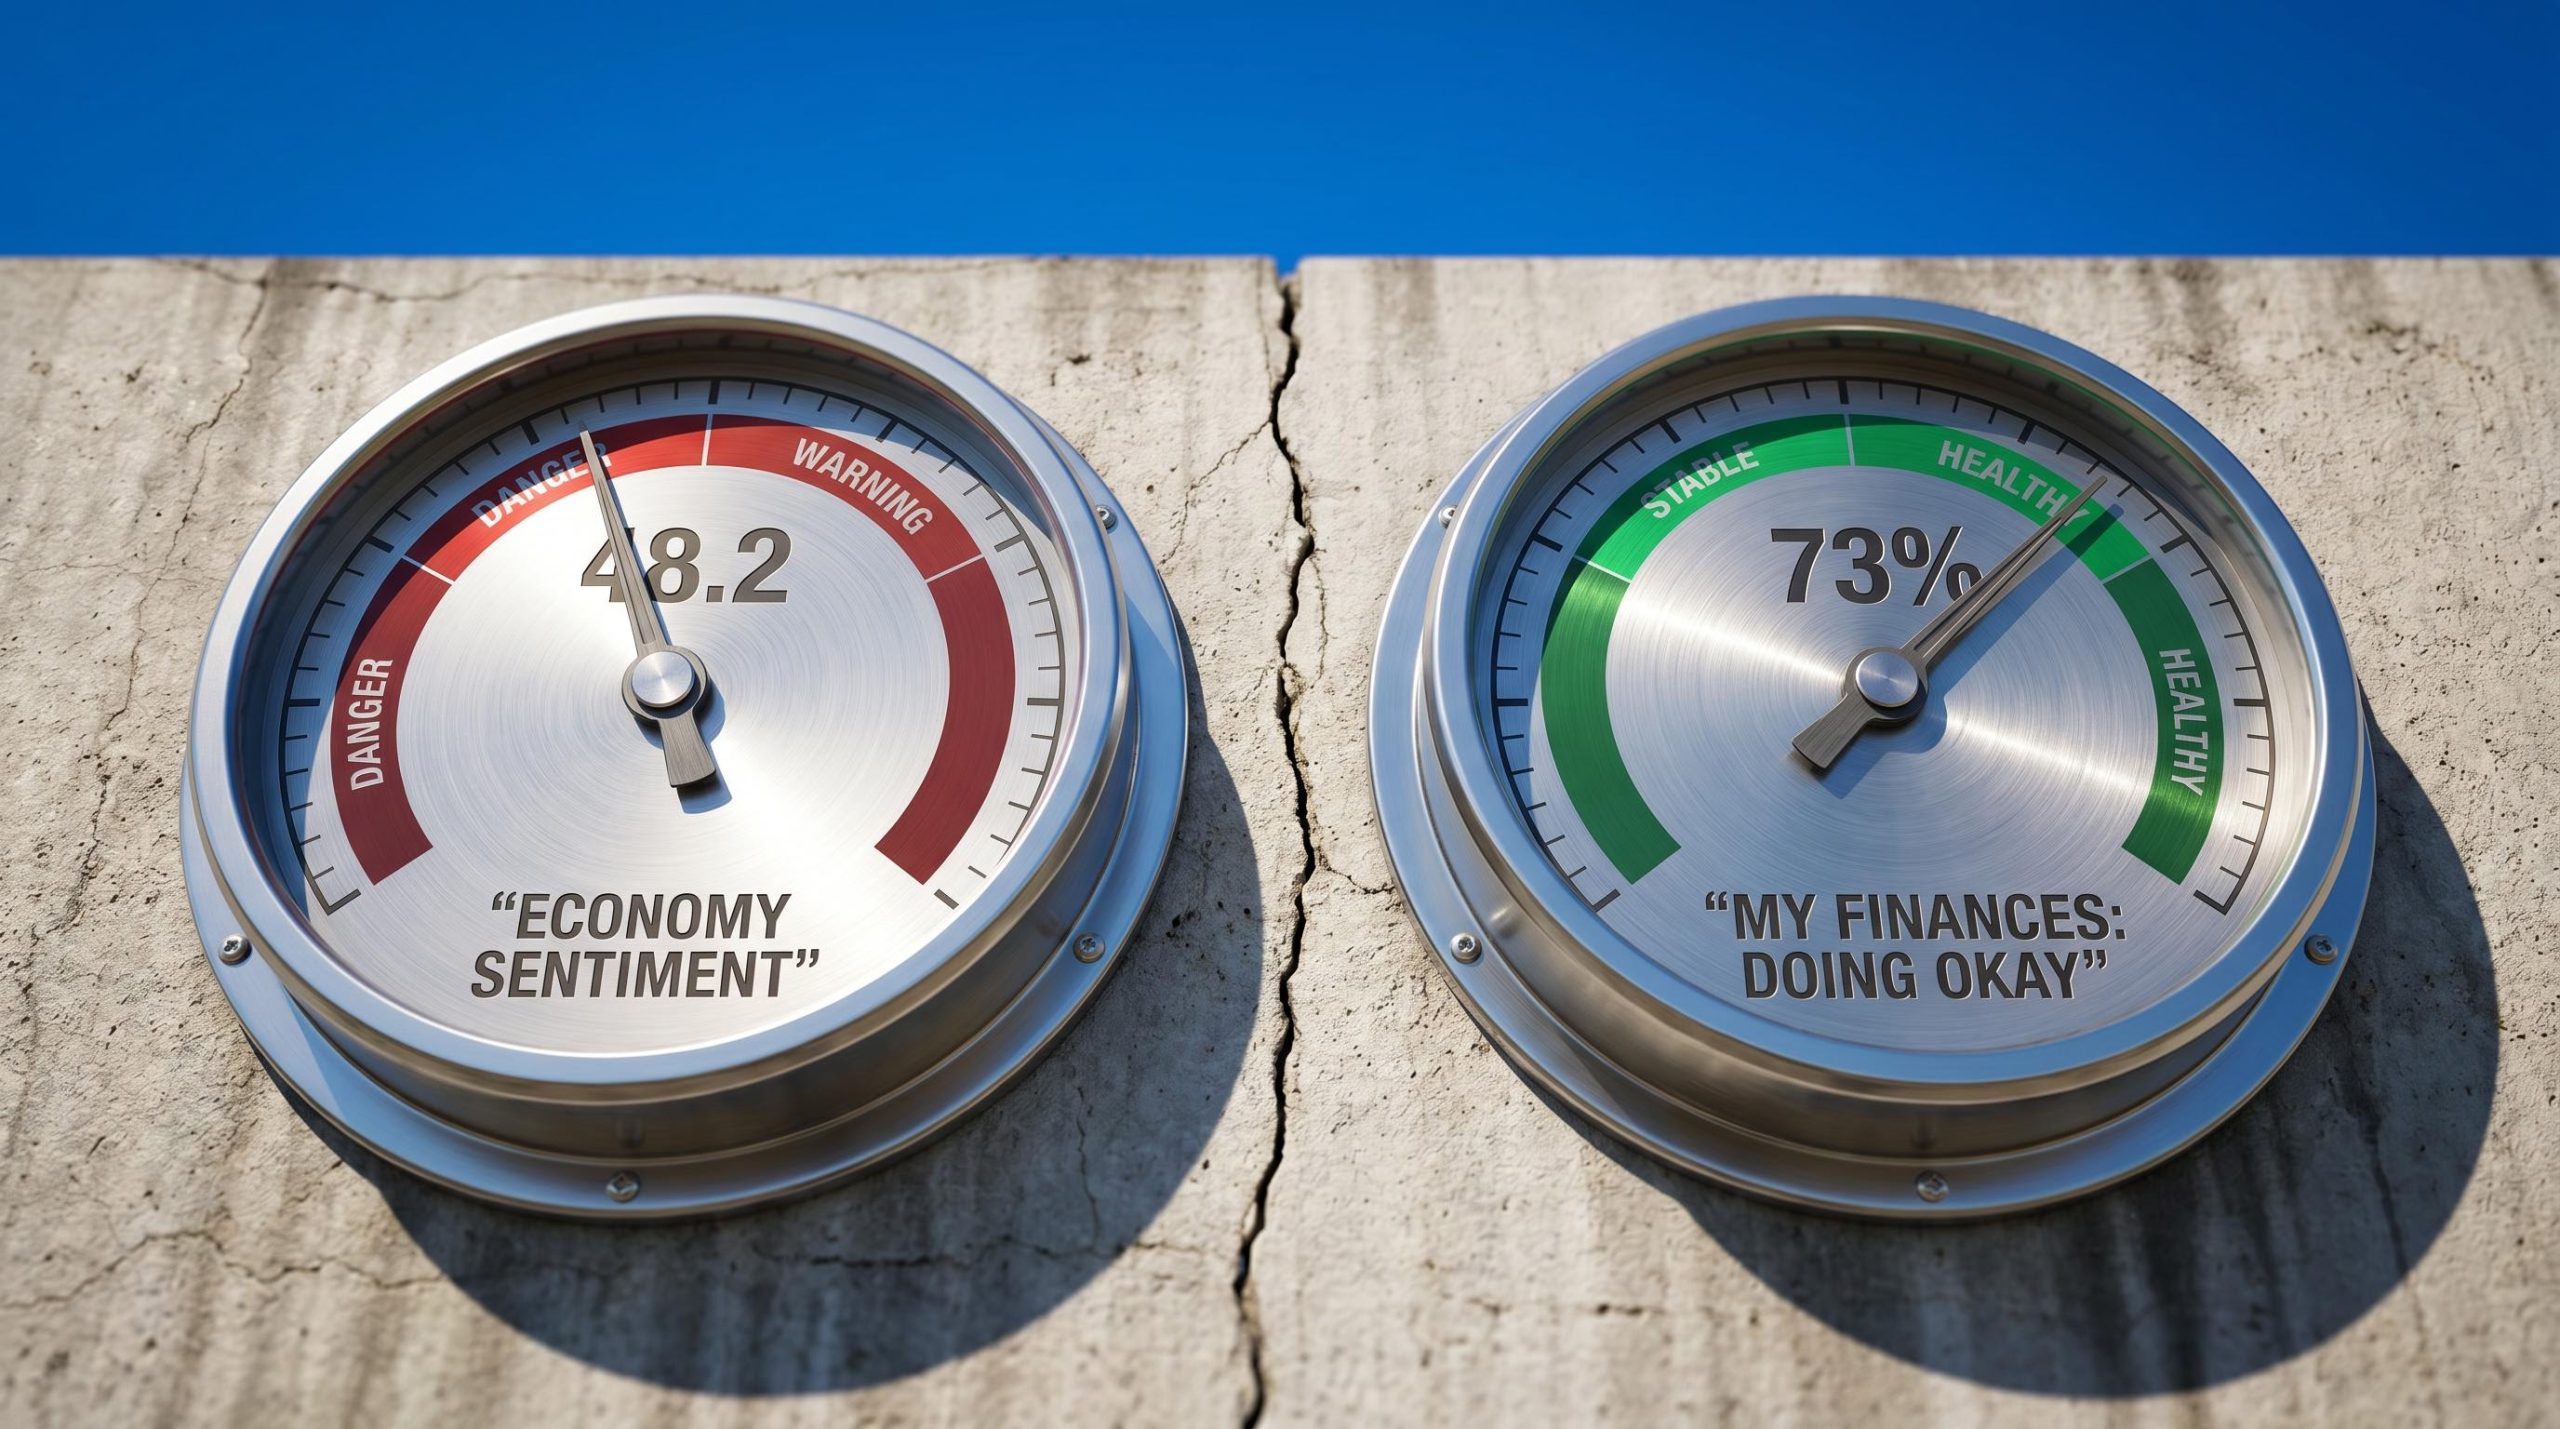
26% rate the economy favourably. 73% say their own finances are fine. Both numbers come from surveys published the same week.
These two readings are not contradictory. They are measuring cognitively distinct things. The Michigan index captures an abstract, media-filtered impression of national conditions. The Fed survey asks people to evaluate their own concrete financial experience. Conflating the two produces bad economic forecasting, and the gap between them is where the real analytical question lives.
The divergence between national economic pessimism and personal financial satisfaction is not a quirk of one survey cycle. Research from the Brookings Institution has found that the framing of survey questions fundamentally shapes responses on economic conditions. Asking someone about “the national economy” activates a judgment built largely from news consumption, social media, and political discourse. Asking about “your own financial situation” triggers a different cognitive process, one grounded in actual income, employment status, and debt experience.
University of Michigan survey research supports this distinction directly. Questions about the “overall economy” correlate primarily with media consumption patterns, while personal finance questions track much more closely with real income changes, job loss, and household debt. The so-called “vibecession” framework, which gained renewed attention in 2025-2026 commentary, describes precisely this dynamic: an economy where objective indicators remain broadly solid but measured sentiment stays persistently depressed.
The causal relationship embedded in consumer sentiment survey mechanics runs in a direction that surprises most readers: stock market movements tend to lead sentiment readings, not the reverse, meaning indices like Michigan’s are better understood as lagging reflections of recent market and media conditions than as forward indicators of economic behaviour.
Three psychological mechanisms explain most of the gap:
The distinction between the rate of inflation and the level of prices is where much of the lingering sentiment damage sits. Inflation, measured as the pace of price increases, slowed substantially from its 2022 peak. By most measures, it returned to ranges consistent with the Federal Reserve’s targets.
Prices themselves, however, did not retreat. A grocery bill that rose 20% between 2021 and 2023 stayed at that elevated level even as the annual inflation rate fell. Consumers anchored to the pre-2021 baseline experience this as permanent damage. That response is not irrational, but it does mean sentiment measures are capturing a legitimate grievance that is distinct from the economy’s current trajectory.
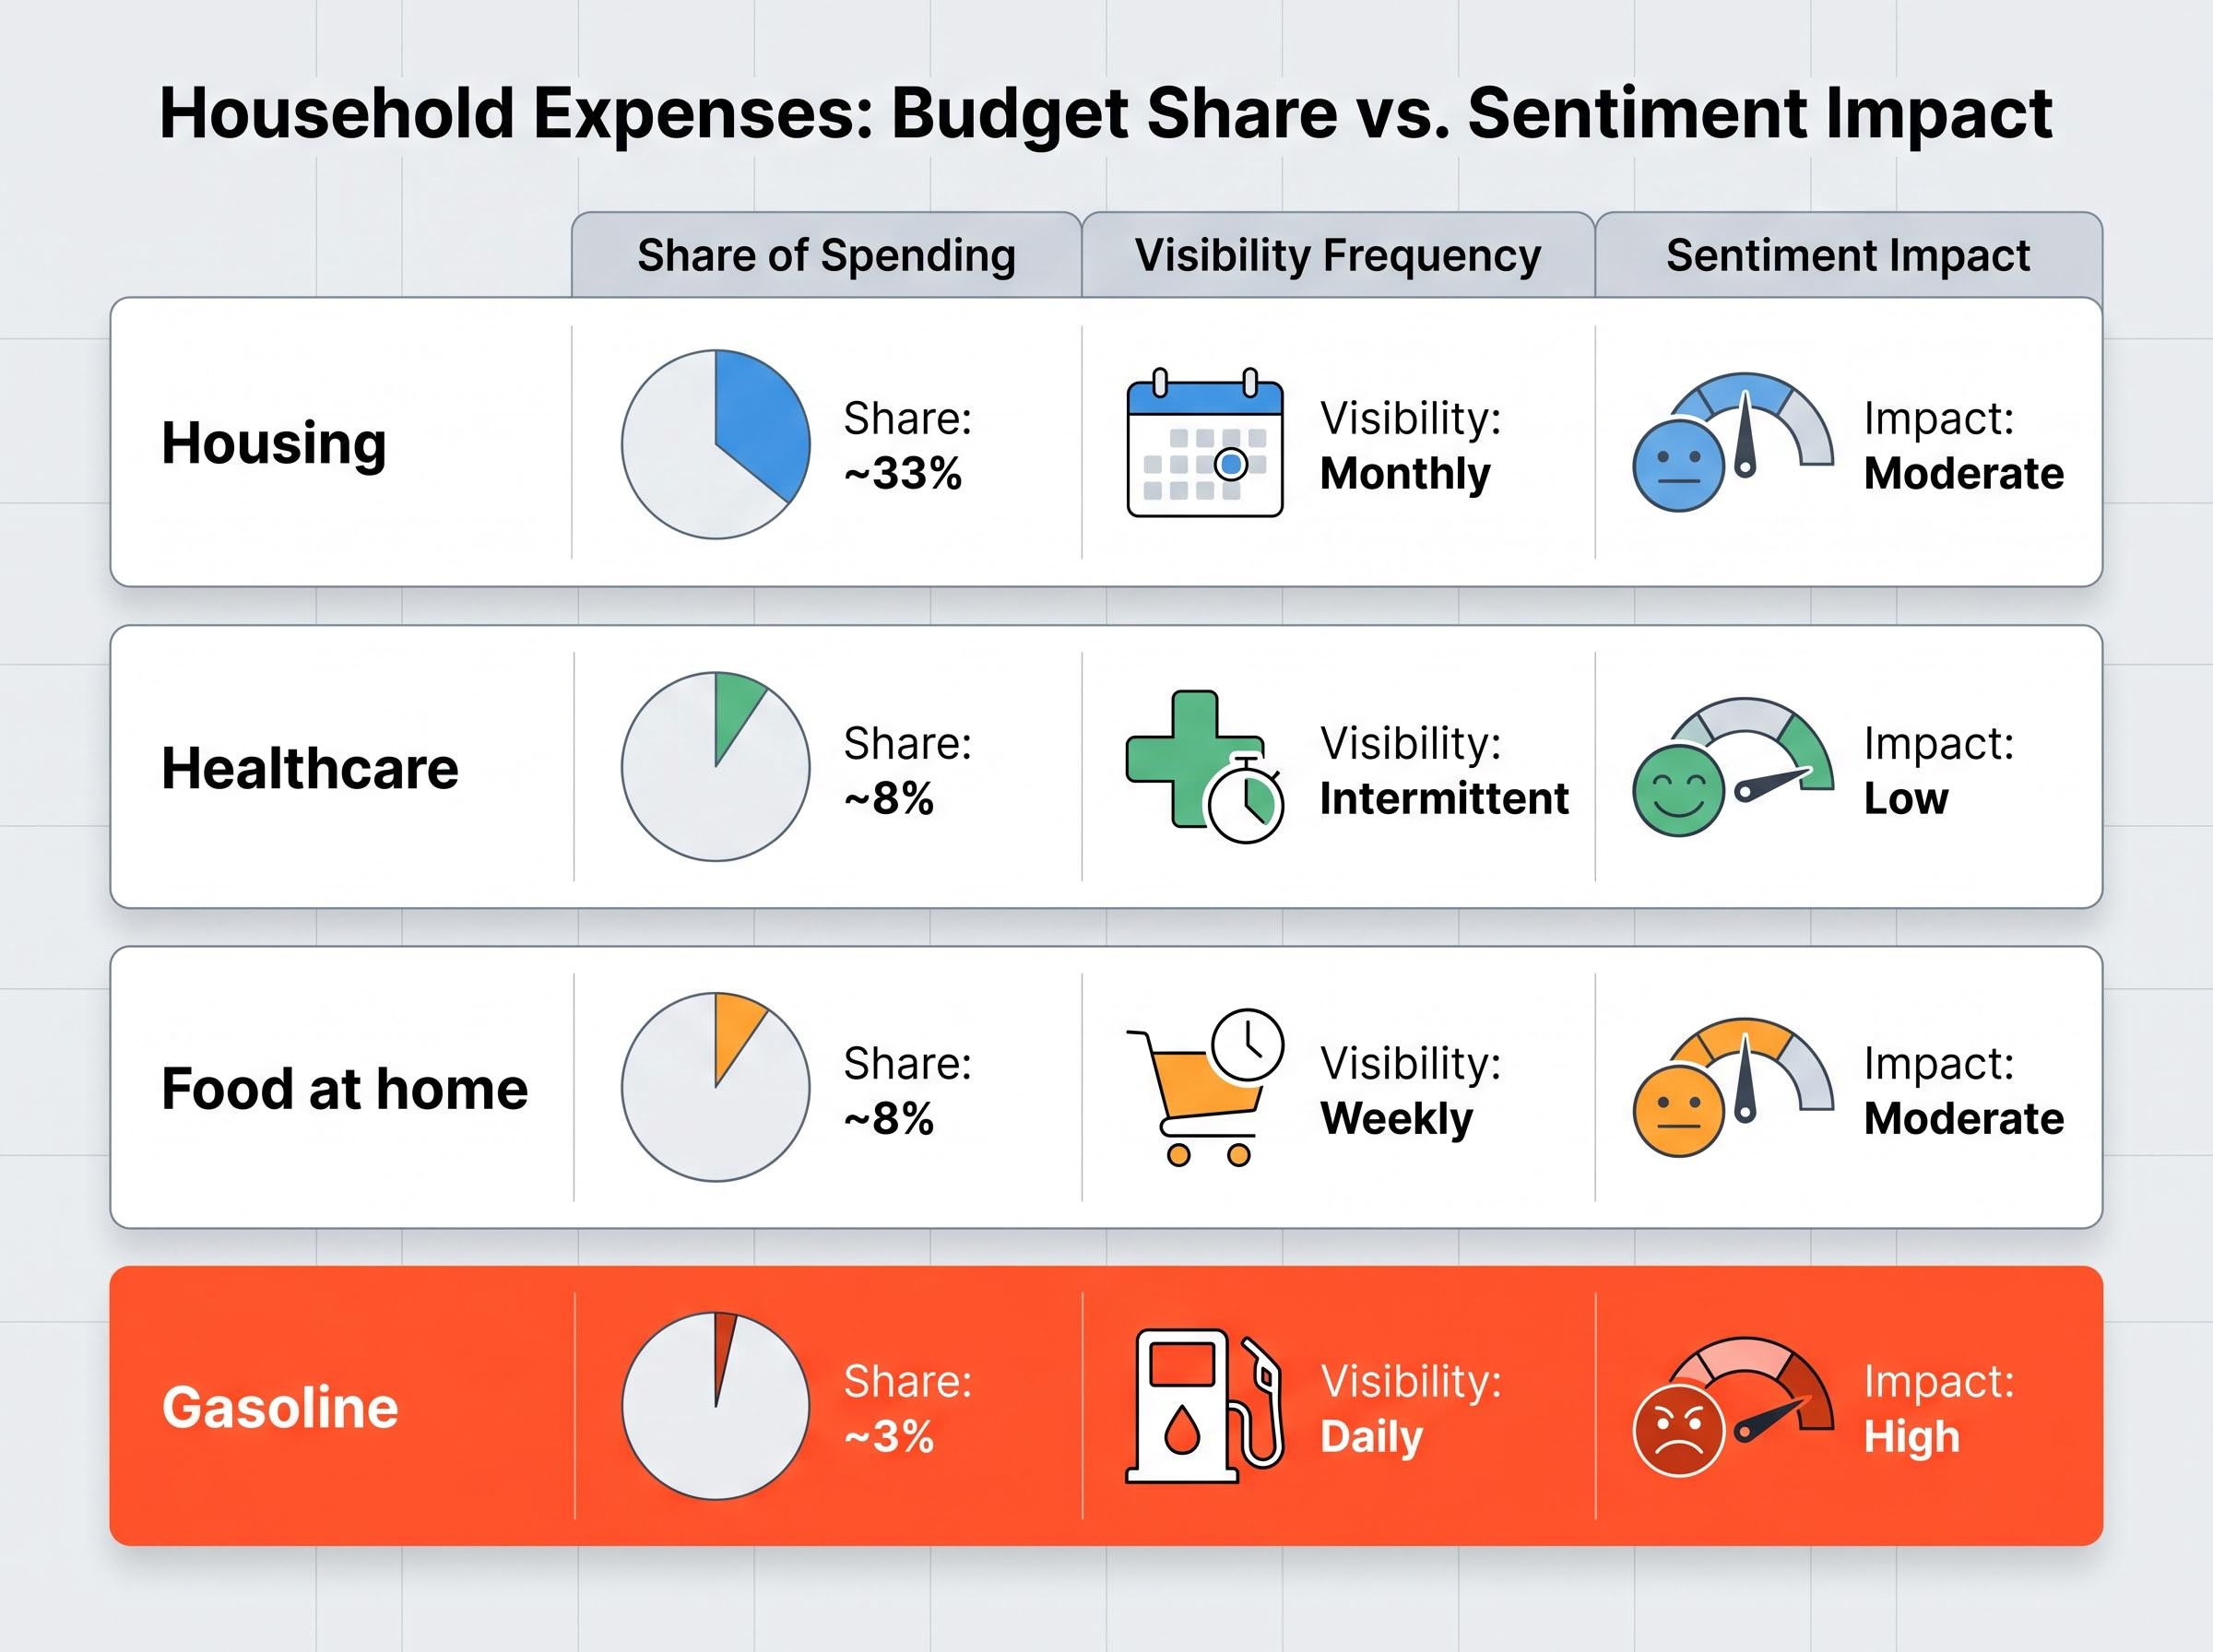
Bureau of Labor Statistics Consumer Expenditure Survey data for 2024 shows that gasoline and motor oil account for approximately 3.0-3.1% of average household expenditures, down from over 4% in prior years. That figure is worth sitting with for a moment: roughly three cents of every dollar spent.
The budget share is small. The sentiment footprint is enormous.
Gas prices are posted in large numerals on roadside signs, updated continuously, and encountered on every trip. No other major household expense replicates this visibility. Rent changes once a year. Healthcare costs are opaque and intermittent. Grocery spending is spread across dozens of line items. Gasoline is a single number, visible from a moving car, that changes frequently enough to serve as a real-time economic scoreboard.
Bank of America card data analysis found that gasoline represents roughly 2.5-3.0% of total card spending in late 2024 to early 2025, yet swings in gas prices correlate with broader consumer mood and discretionary spending behaviour well beyond what that budget share would predict. The budget share is also higher for rural and lower-income households, for whom transportation costs represent a larger fraction of total spending.
Because gas prices function as a heuristic shortcut for “how is the economy doing,” sentiment indices become noisier during periods of energy price volatility driven by geopolitical or supply factors unrelated to domestic economic health.
| Expense Category | Approximate Share of Household Spending | Visibility Frequency | Sentiment Impact |
|---|---|---|---|
| Gasoline | ~3% | Daily (roadside signs) | High |
| Housing | ~33% | Monthly (rent/mortgage) | Moderate |
| Healthcare | ~8% | Intermittent (bills, copays) | Low |
| Food at home | ~8% | Weekly (spread across items) | Moderate |
Panel survey research has produced one of the most striking findings in modern economic measurement: Republicans and Democrats at identical income levels and identical employment statuses report sharply divergent views of the national economy depending on which party holds the presidency. The partisan gap shrinks substantially when the same respondents are asked about their own household finances.
This pattern is not new, but it has intensified. FactSet data as of 15 May 2026 shows Democratic respondent sentiment among the most pessimistic on record. The mirror image appeared roughly four years prior, when Republican respondents reported equivalently depressed readings under a different administration. In neither case did that partisan-driven pessimism produce a recession.
Sentiment questions about the national economy function partly as a proxy for presidential approval. Questions about personal finances do not.
The analytical implication is structural, not political. When partisan identity expression is embedded in aggregate sentiment readings, the index becomes a less reliable leading indicator of economic behaviour. It functions increasingly as a rolling approval rating for the incumbent administration rather than a measure of conditions that predict spending, saving, or borrowing decisions. For anyone using sentiment data to inform financial or business decisions during politically polarised periods, this contamination is not a footnote. It is the main story.
If the economy were as weak as a 48.2 sentiment reading implies, firms committing billions in capital would be among the first to pull back. The investment data tells a different story.
Four institutional sources, working independently with different datasets, reached a consistent conclusion through early 2026:
Firms making multi-year capital commitments respond to actual order flows and profit expectations, not to media-filtered impressions of aggregate conditions. Their behaviour through the first months of 2026 was more consistent with expansion than recession. Equity markets, which function as forward-looking indicators, had similarly not confirmed the recessionary picture implied by sentiment surveys as of May 2026.
The 73% figure should not become false comfort. The New York Federal Reserve’s Q1 2026 Household Debt and Credit Report, published approximately 12-14 May 2026, shows real financial stress concentrated in specific populations.
Federal Reserve survey data reported via Axios on 14 May 2026 noted that the pace at which household debt entered new delinquency status and transitioned to serious delinquency (90-plus days past due) largely declined during Q1, offering some near-term relief within the broader rising trend.
The distributional pattern is telling. The sentiment-reality gap is smallest, or nonexistent, for the lower-income and younger households experiencing actual delinquency stress. These are the populations most likely to report both personal financial difficulty and national economic pessimism. The gap is widest among middle- and upper-income households whose objective financial conditions remain sound but whose macro assessments stay deeply negative for the psychological and political reasons outlined above.
The distributional picture is best understood through the lens of a K-shaped consumer recovery, where aggregate spending metrics remain supported by higher-income households while lower-income cohorts face compounding pressure from elevated rates, depleted savings, and rising essential costs.
The three-layer divergence that runs through this data is now clearly visible. Personal finances versus national economy assessments. Consumer sentiment versus business investment behaviour. Aggregate health versus distributional stress in specific populations. Each layer has a distinct explanation, and none of them require the conclusion that “one number is right and the other is wrong.”
Macro sentiment indices are increasingly contaminated by partisan identity expression, media negativity bias, and price-level anchoring effects. They should be read alongside behavioural data, including investment trends, delinquency rates, and employment figures, rather than treated as standalone economic truth.
The 2022 parallel is instructive. The previous sentiment record low of 50.0 in June 2022 did not trigger a recession. The bull market that began in October 2022 started with sentiment still at historically depressed levels. What mattered for economic outcomes was not what people said about the economy in surveys but what they actually did with their money. Through May 2026, the behavioural evidence, capital investment, contained (if rising) delinquencies, and continued employment growth, remains more consistent with expansion than with the recessionary picture a 48.2 headline implies.
The 2022 comparison functions as more than historical comfort: record-low sentiment readings have historically operated as a contrarian market signal, with the June 2022 Michigan trough coinciding almost precisely with the equity market bottom that preceded a sustained bull run.
This article is for informational purposes only and should not be considered financial advice. Investors should conduct their own research and consult with financial professionals before making investment decisions.
The Consumer Sentiment Index, published monthly by the University of Michigan, measures Americans' perceptions of current and future economic conditions through survey questions. It captures abstract, media-filtered impressions of national economic conditions rather than direct assessments of personal financial situations.
The gap exists because questions about the national economy activate judgments shaped by news consumption and partisan identity, while personal finance questions reflect actual income, employment, and debt experience. Psychological factors including negativity bias, availability bias, and price-level anchoring further depress national sentiment readings beyond what objective conditions would predict.
Panel research shows that Republicans and Democrats at identical income levels report sharply divergent views of the national economy depending on which party holds the presidency, meaning aggregate sentiment indices increasingly function as rolling approval ratings for the incumbent administration rather than reliable indicators of spending or borrowing behaviour.
The Federal Reserve's SHED report published in May 2026 found that 73% of Americans describe their personal finances as doing okay or living comfortably, a reading that contrasts sharply with the record-low Michigan Consumer Sentiment Index of 48.2 recorded the same month.
The New York Federal Reserve's Q1 2026 Household Debt and Credit Report shows stress concentrated in credit card and auto loan delinquencies, particularly among subprime and lower-income borrowers, while mortgage delinquencies remain low because most homeowners locked in fixed rates before 2022.