Foxconn Beats Q2 Estimates by 6% as AI Server Demand Surges
15 hrs ago

The 30-year US Treasury yield briefly exceeded 5.19% intraday on 19 May 2026, its highest reading since 2007, while the 10-year simultaneously pushed toward 4.67%. The surge arrived at the intersection of Moody’s downgrade of US sovereign credit from Aaa to Aa1, sticky inflation expectations, heavy Treasury supply, and a structural reassessment of the compensation investors demand for holding long-duration government debt. Equity markets have logged three consecutive sessions of declines, with the S&P 500 falling 0.67% to 7,354 on 20 May. This is not a one-day technical spike; it is a multi-week repricing with cross-asset consequences. What follows is a breakdown of what is driving yields to these levels, what the 5.25% threshold being discussed by strategists means for equities, and how dramatically Federal Reserve rate-hike expectations have shifted in just one month.
The yield surge is a convergence story, not a single-headline event. Three forces arrived simultaneously:
Oil price transmission into CPI is the supply-side mechanism the Federal Reserve cannot directly resolve: analyst pass-through estimates suggest 40-60% of the oil price increase feeds into core inflation over a 3-6 month lag, meaning the June and July CPI prints carry substantially more policy weight than the April figure in determining whether the two-hike probability at 16.4% continues to climb.
The Moody’s US sovereign rating action cited persistent large fiscal deficits and a rising debt burden as the primary justification for removing the United States’ last remaining triple-A designation, a rationale that directly feeds into the term premium repricing now visible across the long end of the curve.
Goldberg noted on 19 May that the Moody’s downgrade “has likely contributed 5 to 10 basis points to the recent back-up in long-term yields by forcing some investors to reassess their mandates, but the bulk of the move is being driven by term premium and supply concerns.”
Mark Sobel, former US Treasury official and US Chair at OMFIF, described the downgrade on 19 May as “more a symptom than a cause of higher yields.” David Kelly, Chief Global Strategist at JPMorgan Asset Management, echoed the distinction, calling it “mostly symbolic” while acknowledging that “symbolism matters around the margins.”
The distinction matters for investors. A yield spike driven purely by near-term Fed expectations might reverse on a single cooler inflation print. A move dominated by term premium, the additional compensation investors require for holding longer-duration bonds beyond what short-term rate expectations alone would justify, can persist even if the Fed holds rates steady.
The New York Fed term premium estimates, derived from the Adrian, Crump, and Moench model, provide a quantitative lens for isolating how much of the current long-end yield move reflects compensation for duration risk rather than the market’s forward expectations of short-term Fed policy.
When the risk-free rate rises, the cost of holding equities rises with it. The mechanism operates through three steps:
This is the equity risk premium in action. When a government bond yields 5.19%, investors require proportionally higher earnings growth from stocks to justify the additional risk. Without it, capital migrates toward the guaranteed yield.
The 20 May session illustrated the mechanism in real time. The Nasdaq Composite, heavily weighted toward long-duration growth stocks, fell 0.84%, underperforming both the Dow Jones (-0.65%) and the S&P 500 (-0.67%). The Russell 2000 dropped 1.01%, reflecting the additional pressure on smaller companies with higher borrowing costs and thinner margins. The VIX rose 1.35% to 18.06.
| Index | May 20 Close | Session Change |
|---|---|---|
| S&P 500 | 7,354 | -0.67% |
| Nasdaq Composite | 25,871 | -0.84% |
| Dow Jones | 49,364 | -0.65% |
| Russell 2000 | 2,747 | -1.01% |
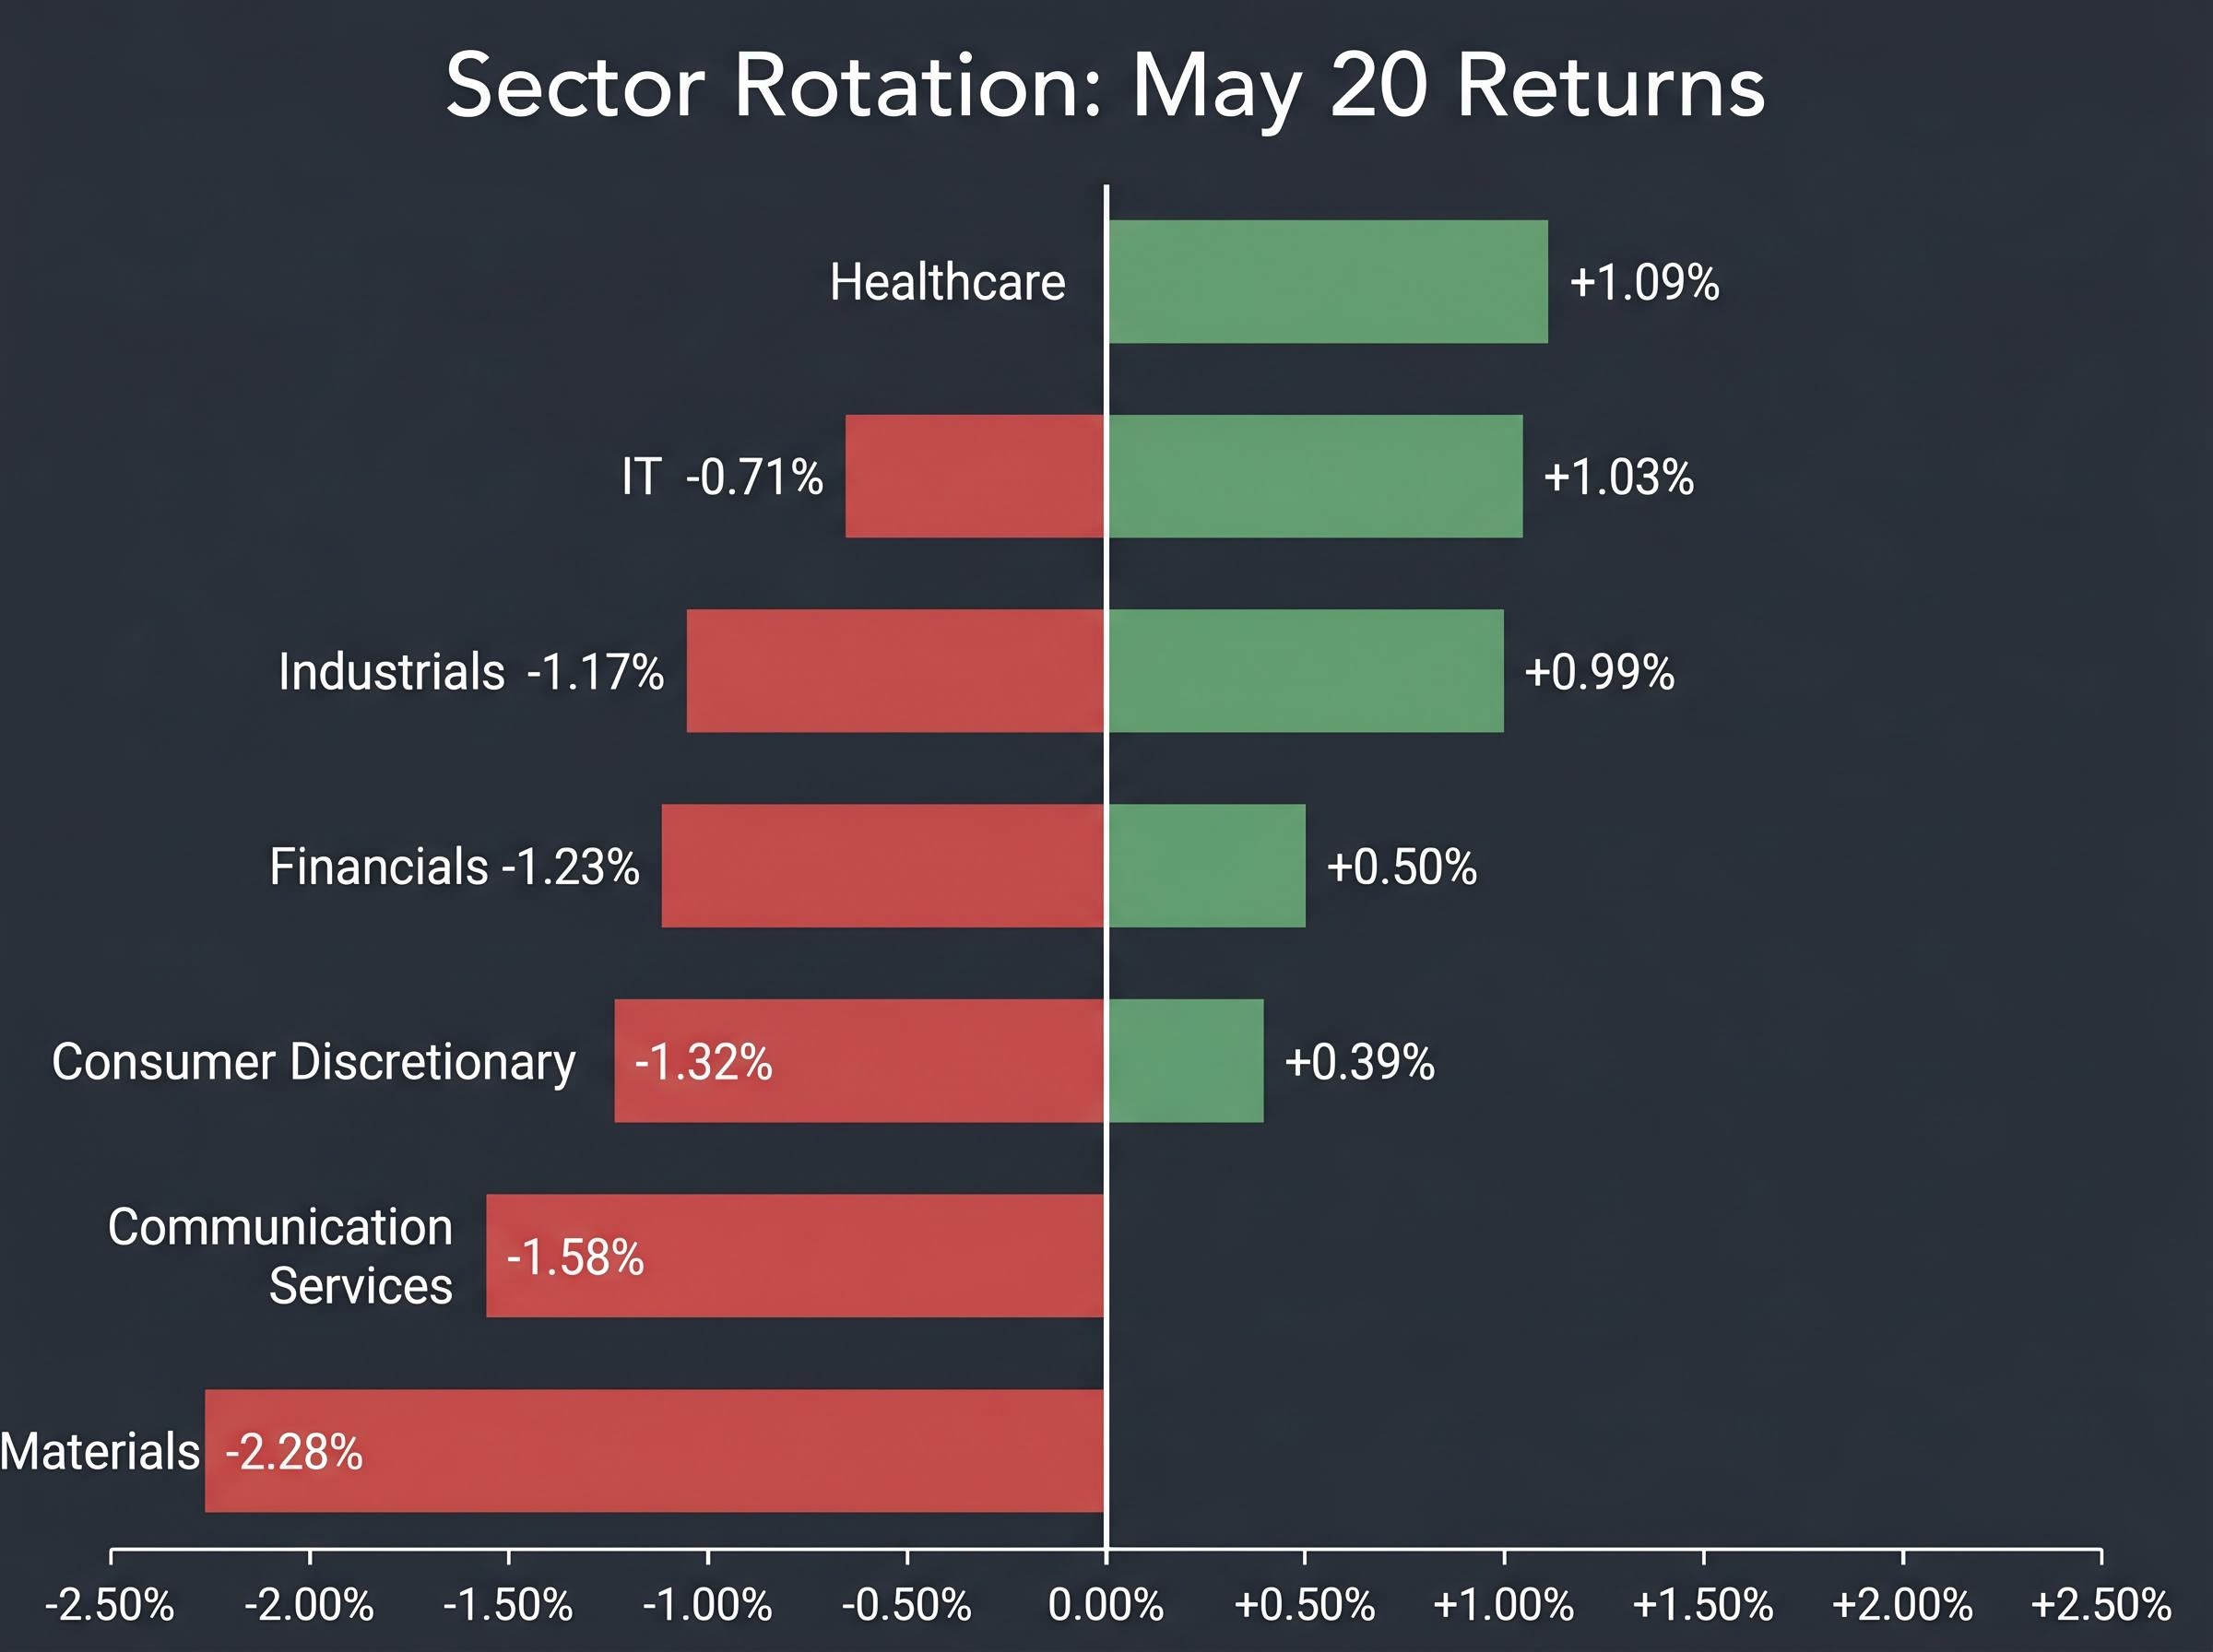
The 20 May session produced a clear map of where capital is moving. Defensive sectors absorbed inflows while rate-sensitive cyclicals and growth-weighted groups sold off.
| Sector | May 20 Return |
|---|---|
| Healthcare | +1.09% |
| Energy | +1.03% |
| Utilities | +0.99% |
| Real Estate | +0.50% |
| Consumer Staples | +0.39% |
| IT | -0.71% |
| Industrials | -1.17% |
| Financials | -1.23% |
| Consumer Discretionary | -1.32% |
| Communication Services | -1.58% |
| Materials | -2.28% |
Energy’s 1.03% gain carries a dual driver. Defensive rotation explains part of it, but elevated oil prices (WTI at $104.03 per barrel; Brent at $110.91) linked to the Strait of Hormuz disruption are doing independent work. That distinction matters: if geopolitical tensions ease, Energy’s outperformance may narrow even if yields remain elevated.
Utilities posted a strong 0.99% session gain, yet the sector carries its own structural rate sensitivity. High dividend yields compress in relative attractiveness as Treasury yields rise. The single-session performance does not fully resolve that tension, and investors should monitor whether the bid persists if the 30-year pushes higher.
Less than 10 basis points separated the 19 May intraday high from 5.25% on the 30-year Treasury, the level that multiple strategists have cited as a structural risk inflection point for equities.
BMO strategist Ian Lyngen has warned that a sustained move above 5.25% on the 30-year would trigger not a single-session selloff but a prolonged equity valuation adjustment, as institutional allocators would be forced to structurally reassess equity risk premia across portfolios.
At 5.25%, the long bond offers a yield that competes directly with long-run equity return expectations. For institutional allocators bound by risk-adjusted return mandates, that creates a forced reallocation question rather than a discretionary one.
The distinction between a yield spike driven by Fed expectations and one driven by term premium carries direct implications for how Washington responds: bond market pressure on policy has displaced equity drawdowns as the primary forcing mechanism on White House decision-making, a dynamic that makes the 30-year yield a more reliable leading indicator of the next policy pivot than the S&P 500 itself.
The positioning backdrop amplifies the risk. The Bank of America Global Fund Manager Survey for May revealed three warning signals:
The market, in short, is positioned for a soft outcome at the precise moment the bond market is pricing a harder one.
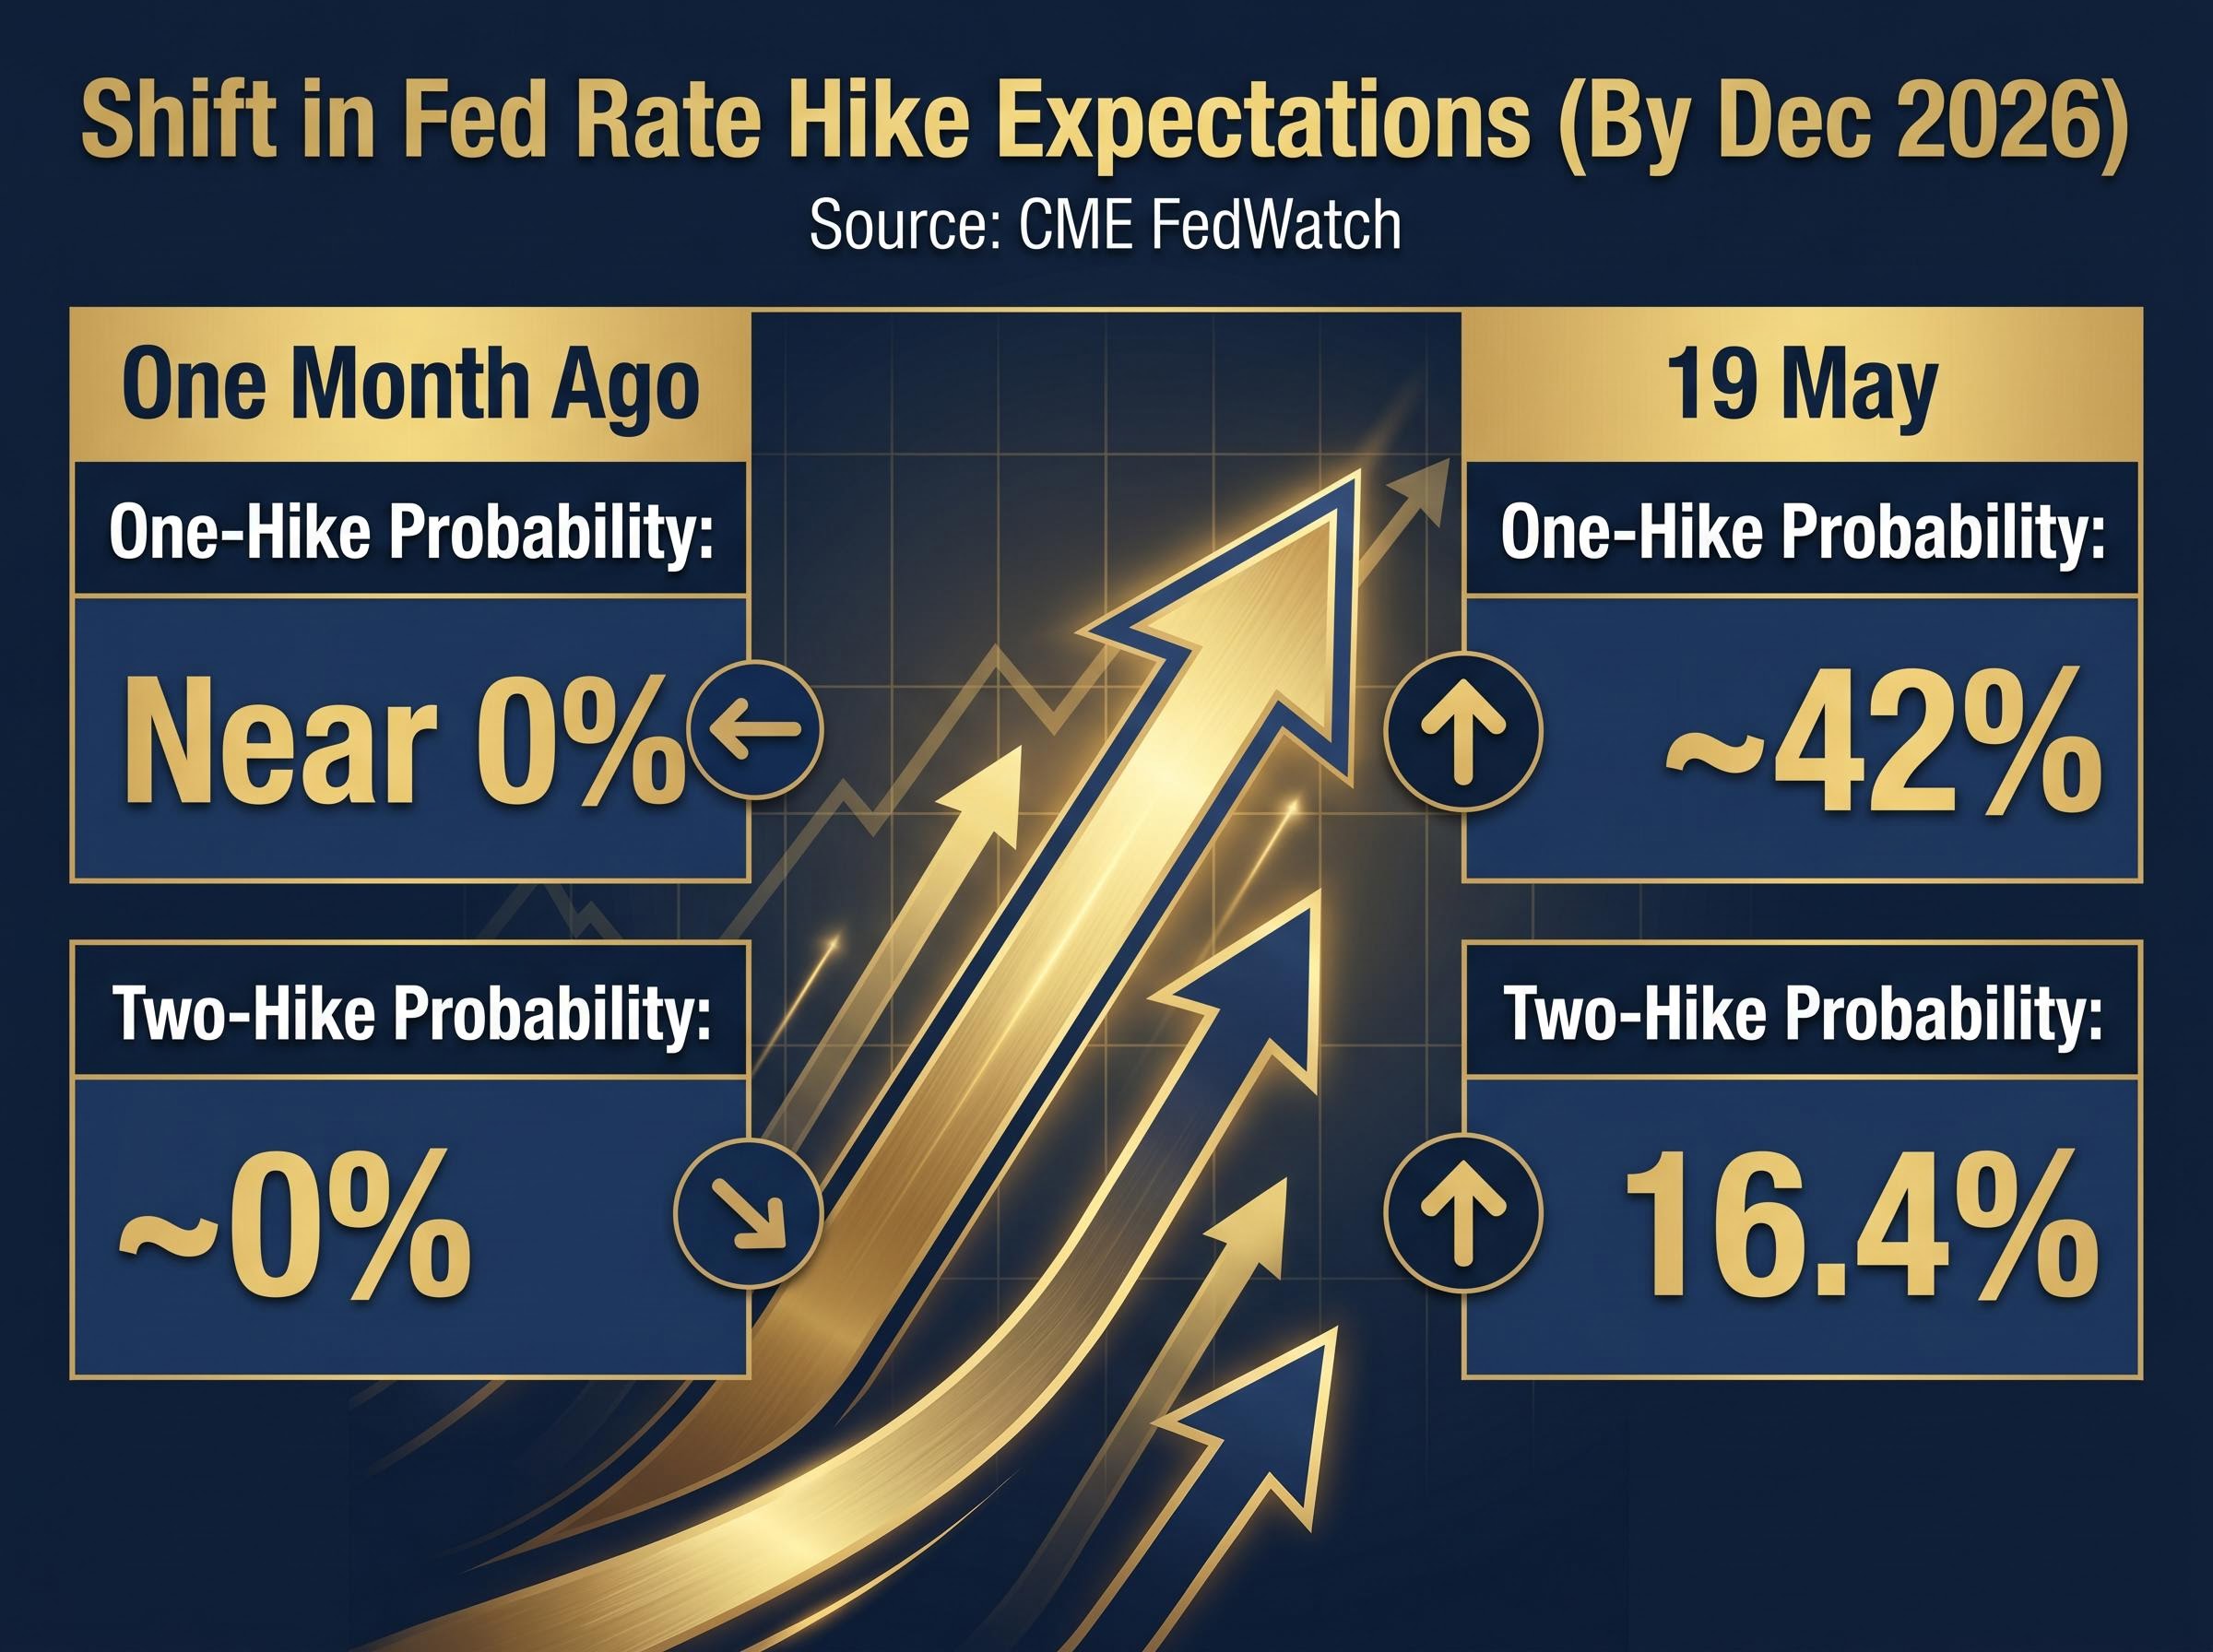
One month ago, the market-implied probability of a Federal Reserve rate hike by December 2026 was near zero. As of 19 May, that figure stood at approximately 42% for at least one 25-basis-point increase, per CME FedWatch data. The probability of two separate hikes reached 16.4%, up from effectively 0%.
Federal Reserve Governor Christopher Waller stated on 17 May: “Markets have moved from expecting cuts to flirting with the idea of hikes.” He added that the Fed “would not hesitate to respond” if inflation reaccelerated.
Cleveland Fed President Loretta Mester reinforced the shift on 18 May, noting: “I understand why markets have pushed out rate cuts and are now pricing in some probability of an increase. We’ve had a string of inflation readings that were higher than we’d like.”
Both Michael Feroli at JPMorgan and Ellen Zentner at Morgan Stanley noted on 19 May that the baseline remains no additional hikes this cycle, but the probability distribution has shifted meaningfully toward the upside. Zentner observed that “the repricing itself tightens financial conditions and may reduce the need for the Fed to follow through,” a dynamic worth monitoring as the repricing compounds the term premium pressure already at work in long-end yields.
The Fed rate hike probability reported by CME FedWatch represents only one layer of the repricing: prediction markets on Kalshi simultaneously placed the odds of a hike before July 2027 at 60%, a figure that incorporates longer-horizon inflation risk from the Hormuz oil shock that short-dated FedWatch contracts do not fully capture.
The yield shock is not confined to the United States. Long-end sovereign bond yields have surged simultaneously across the world’s largest developed markets.
| Market | 30-Year Yield | Context |
|---|---|---|
| US Treasury | ~5.18-5.19% | Highest since 2007 |
| UK Gilt | Above 5.77% | Highest since 2022 Truss crisis |
| German Bund | ~3.68% | Multi-year high |
| Japanese JGB | Record high | Highest on record (exact level pending verification) |
When the same repricing appears in Treasuries, gilts, bunds, and JGBs at once, the signal is structural rather than idiosyncratic. Three common drivers underpin the synchronised move:
The OECD has flagged potential further deterioration in global economic conditions, reinforcing the view that this repricing carries forward-looking implications beyond the current quarter.
The simultaneous surge in long-end yields across the US, UK, eurozone, and Japan reflects a structural term-premium repricing, not a transient Fed-expectations wobble. The proximity of the 30-year Treasury to the 5.25% analyst threshold means the next 10 basis points carry outsized significance for equity valuations and institutional portfolio allocation.
The sector rotation already visible, with Healthcare, Energy, and Utilities outperforming while Materials, Communication Services, and Consumer Discretionary lag, provides a real-time map of how institutional capital is repositioning. These patterns tend to persist through multi-week yield shocks rather than reversing on a single session.
The specific datapoints to monitor in the sessions ahead: the 30-year Treasury yield relative to 5.25%, upcoming CPI prints, further communications from Fed officials Waller and Mester, and any movement in the two-hike probability currently at 16.4% on CME FedWatch.
Investors weighing whether the current yield shock is structural or transitory will find our full explainer on the energy-driven inflation thesis, which examines why the FOMC’s 29 April 2026 statement isolated energy as a distinct inflation variable, what conditions would need to hold for the spike to reverse, and how a faster-than-expected energy price retreat could re-rate growth equities if rate-cut expectations revive.
This article is for informational purposes only and should not be considered financial advice. Investors should conduct their own research and consult with financial professionals before making investment decisions. Past performance does not guarantee future results. Financial projections are subject to market conditions and various risk factors.
The surge in US Treasury yields reflects three converging forces: the Moody's downgrade of US sovereign credit from Aaa to Aa1, sticky inflation expectations from a string of firmer-than-expected CPI readings, and a structural expansion of Treasury supply that is forcing markets to absorb more long-duration debt than buyer appetite currently supports.
BMO strategist Ian Lyngen has warned that a sustained move above 5.25% on the 30-year Treasury would trigger a prolonged equity valuation adjustment, as institutional allocators bound by risk-adjusted return mandates would face forced reallocation away from equities rather than a discretionary choice.
When risk-free rates rise, the discount rates applied to future corporate earnings increase, reducing the present value of those cash flows; companies with earnings weighted furthest into the future, such as high-growth technology names, absorb the steepest valuation compression as a result.
One month prior to 19 May 2026, the market-implied probability of a Fed rate hike by December 2026 was near zero; by 19 May it had risen to approximately 42% for at least one 25-basis-point increase, with the probability of two separate hikes reaching 16.4%, per CME FedWatch data.
During the 20 May 2026 session, defensive sectors led the market, with Healthcare gaining 1.09%, Energy rising 1.03%, and Utilities adding 0.99%, while rate-sensitive and growth-weighted sectors such as Materials (down 2.28%), Communication Services (down 1.58%), and Consumer Discretionary (down 1.32%) underperformed.