
Australia’s big four banks, Commonwealth Bank of Australia (CBA), Westpac, NAB, and ANZ, collectively represent more than one-third of the ASX 200 by market capitalisation. Millions of retail investors hold them directly or through superannuation. Yet most of those investors have no systematic way of assessing whether the price they paid, or the price on screen today, reflects fair value.
That gap matters more than usual right now. CBA’s share price has climbed to levels that multiple valuation approaches struggle to justify on fundamentals alone, and the RBA cash rate sits at 4.35% following three consecutive 25 basis point hikes, a rate environment that directly reshapes both bank earnings and the assumptions underpinning any valuation model.
This guide walks through the two most accessible methods for valuing bank stocks step by step: the price-to-earnings (PE) ratio and the dividend discount model (DDM). Each section uses real ASX data to build worked examples. By the end, readers will know how to apply both methods, how to read what the outputs actually mean, and why no single number from either should be treated as a verdict on its own.
Why bank stocks are different to value
Before any formula appears, it is worth understanding why banks require their own valuation toolkit. Applying generic rules of thumb designed for industrial or consumer businesses to financial stocks is one of the most common mistakes retail investors make, and it produces unreliable results.
Banks are structurally different from most listed companies in three specific ways:
- Net interest margin model. Banks earn income primarily from the spread between what they pay depositors and what they charge borrowers, not from selling goods or services. This means their earnings are tied directly to interest rate movements and credit demand rather than revenue from products.
- High financial leverage by design. Banks operate with far more debt relative to equity than a typical industrial company. This is not a sign of distress; it is how the business model works. But it means traditional metrics like enterprise value or free cash flow are less useful.
- Dividend centrality for Australian investors. Dividends are the primary way bank shareholders realise returns. Australia’s imputation system means fully franked dividends carry attached franking credits that increase the real return to eligible shareholders. CBA, for example, has maintained a consistent fully franked dividend for years, making the dividend stream itself a meaningful input to any valuation.
How banks make money
A bank’s net interest margin (NIM) is the difference between the interest rate it earns on loans and the rate it pays on deposits, expressed as a percentage of its interest-earning assets. When the RBA raises or lowers the cash rate, that spread shifts, and bank earnings move with it.
Because NIM drives the bulk of bank revenue, earnings per share (EPS) and dividends per share (DPS) become the most meaningful signals for investors assessing value. Revenue figures or gross profit margins, which work well for retailers or technology companies, tell a less complete story here.
What this means for the tools you use
The PE ratio anchors to earnings. The DDM anchors to dividends. Both metrics align directly with how banks generate and distribute value, which is why they are the two most appropriate starting points for retail investors. The sections that follow take each method in turn.
When big ASX news breaks, our subscribers know first
Valuing bank stocks using the PE ratio
The PE ratio expresses how much an investor pays for each dollar of a company’s annual earnings. A PE of 20x means the market is pricing each $1 of earnings at $20. It is one of the fastest ways to gauge whether a stock is priced in line with its sector peers.
Applying the PE ratio to a bank stock involves three steps:
- Calculate the PE ratio. Divide the current share price by earnings per share.
- Compare to the sector average. Check whether the stock’s PE sits above, below, or in line with its banking peers.
- Apply the sector PE to the stock’s EPS. This produces a sector-adjusted valuation estimate, showing what the stock would be worth if the market priced it at the same multiple as its peers.
The following worked example uses CBA’s FY24 figures for illustration. These are prior-year numbers; readers should retrieve the FY25 results from the CBA FY25 Profit Announcement at commbank.com.au/about-us/investors/results for any current analysis.
| Metric | CBA (Illustrative FY24) | Sector Average |
|---|---|---|
| Earnings per share | $5.63 | Varies by bank |
| PE ratio | ~28.9x (at $162.78) | ~18x |
| Implied valuation | ~$101.54 (EPS x sector PE) | N/A |
At an illustrative share price of $162.78, CBA’s implied PE is approximately 28.9x, well above the banking sector average of roughly 18x. Applying the sector average multiple to CBA’s $5.63 EPS produces a sector-adjusted valuation of approximately $101.54.
A sector-adjusted PE valuation of approximately $101.54 suggests that, if CBA were priced at the same earnings multiple as its banking peers, the share price would sit materially below where it trades.
That gap does not automatically mean CBA is overvalued. CBA’s forward PE as of mid-May 2026 sits at approximately 22.5-25x, according to data from GuruFocus, Yahoo Finance, and Stock Analysis, while peer banks trade at roughly 12-14x forward earnings. Some of that premium reflects CBA’s superior return on equity, lower credit risk, and digital banking investment. Whether the premium is justified remains one of the most debated questions in Australian equities. The PE method does not settle the argument, but it makes the size of the premium visible.
The PE ratio applied to NAB produces a different picture to the CBA analysis: NAB’s FY24 trailing multiple sits below the big-four peer range upper bound, generating a sector-adjusted fair value estimate of approximately $41.27 against a share price of $37.37, a result that illustrates how the same three-step framework can surface discount signals as readily as premium ones.
Valuing bank stocks using the Dividend Discount Model
For a stock that pays a reliable, growing dividend, there is a straightforward question: what is that income stream worth in today’s dollars? The DDM answers it by reducing an infinite expected dividend stream to a single present value.
The reason the DDM suits income stocks so well in the Australian context is structural: banks, REITs, utilities, and infrastructure companies operate under regulatory or mandate-driven distribution requirements that produce the kind of predictable, recurring dividend streams the model was designed to discount.
The formula has three inputs:
DDM Value = Annual Dividend / (Required Return – Dividend Growth Rate)
- Annual dividend: The dividend per share the company pays each year.
- Required return: The minimum annual return an investor demands for holding the stock, reflecting both the risk-free rate and the equity risk premium.
- Dividend growth rate: The rate at which the dividend is expected to grow each year into the future.
Running the base DDM calculation
Using CBA’s illustrative FY24 dividend of $4.85 per share, a blended range of required return rates between 6% and 11%, and growth rate assumptions between 2% and 4%, the base DDM produces a central estimate of approximately $98.33 per share.
An adjusted forward dividend estimate of $4.76 lifts that figure to approximately $100.66. Both sit well below the illustrative market price of $162.78.
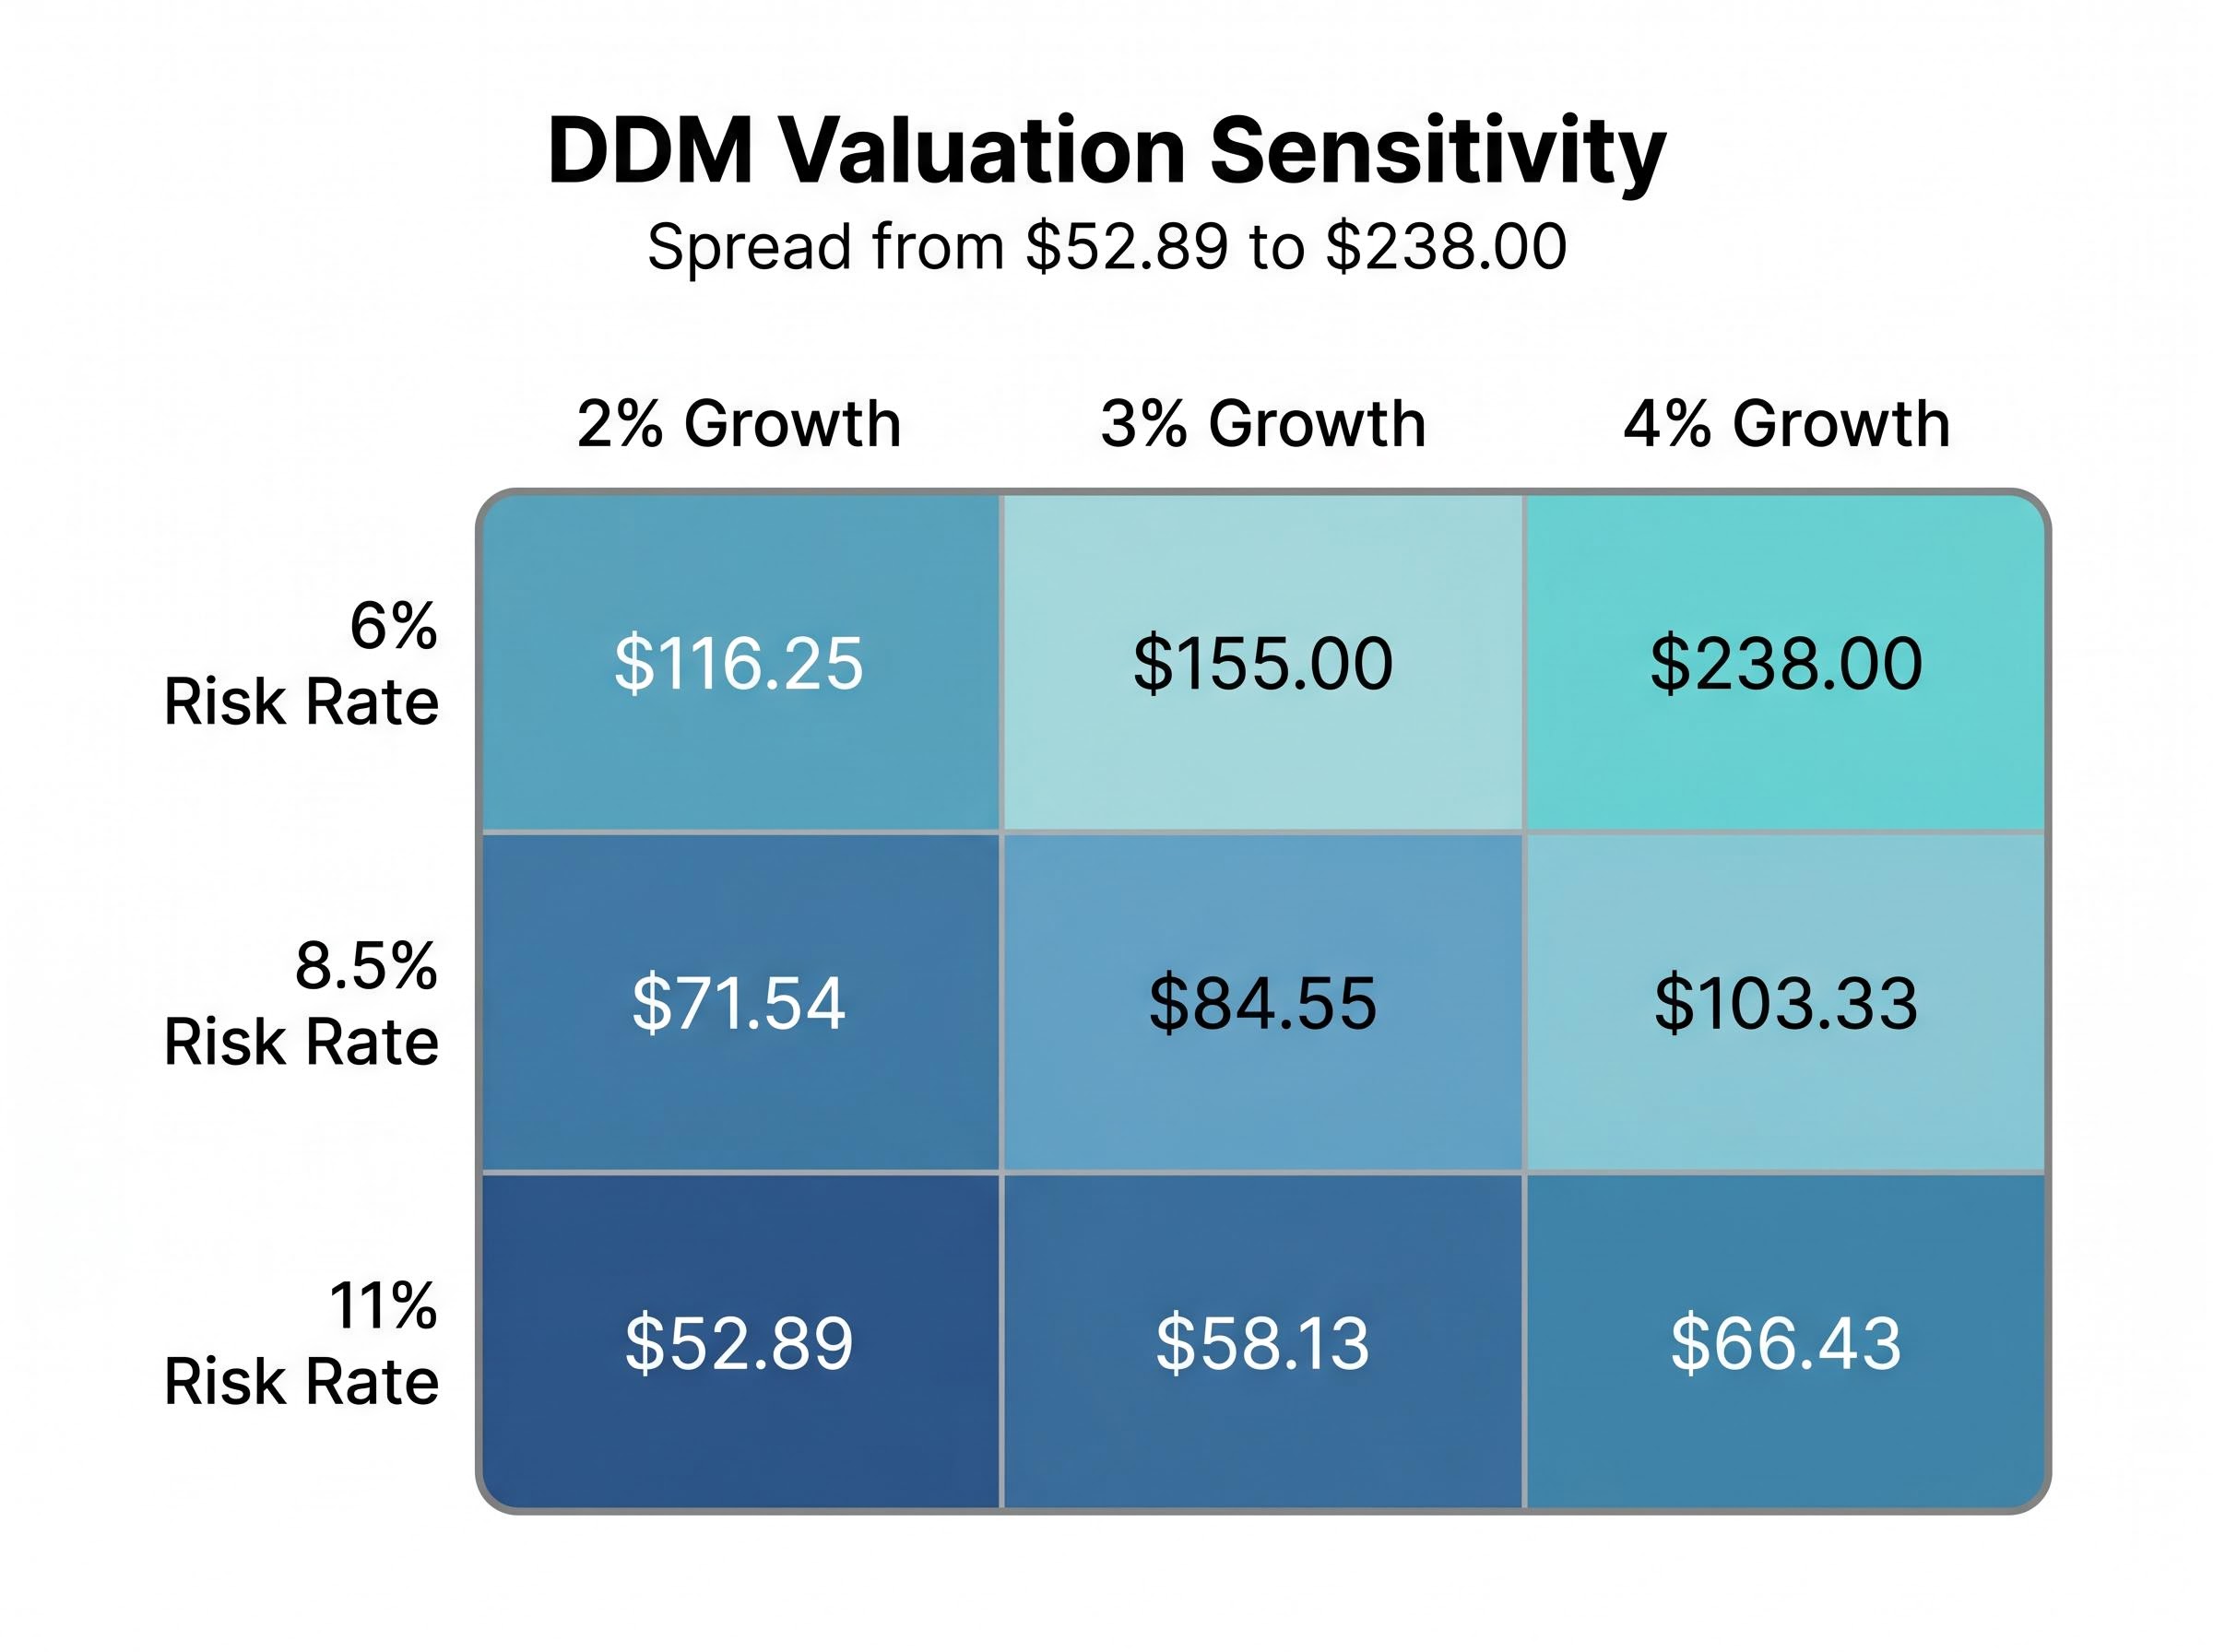
The range of outputs across different assumptions tells a more complete story. The table below shows how sensitive the DDM output is to small changes in the growth rate and required return inputs.
| Risk Rate | 2% Growth | 3% Growth | 4% Growth |
|---|---|---|---|
| 6% | $116.25 | $155.00 | $238.00 |
| 8.5% | $71.54 | $84.55 | $103.33 |
| 11% | $52.89 | $58.13 | $66.43 |
The spread from $52.89 (high risk rate, low growth) to $238.00 (low risk rate, high growth) is enormous. That width is not a flaw in the model. It is a signal that bank valuations are acutely sensitive to assumptions about future growth and the return investors require for bearing risk.
Adjusting for franking credits
Australian resident investors who receive fully franked dividends are entitled to franking credits, which represent company tax already paid on the profits distributed. To calculate the gross dividend (the pre-tax equivalent), divide the cash dividend by one minus the corporate tax rate.
At a 30% corporate tax rate, CBA’s illustrative $4.85 cash dividend converts to a gross dividend of approximately $6.80 per share ($4.65 / 0.70).
The ATO franking tax offset rules confirm that franking credits attached to fully franked dividends are included in an eligible resident shareholder’s assessable income, then applied as a direct offset against tax payable, with any excess credits refundable, a mechanism that materially increases the real after-tax return compared with the face value of the cash dividend alone.
Substituting the gross dividend into the DDM formula produces a valuation of approximately $143.80 per share, materially higher than the $98.33 base case. This reflects the additional value that the imputation system delivers to eligible Australian shareholders, a real economic benefit that offshore investors cannot access.
CBA dividends are fully franked. Readers unfamiliar with how franking credits work in practice can find a clear primer at ASIC Moneysmart (moneysmart.gov.au/investment-choices/shares).
How to interpret your valuation range (and what not to do with it)
The CBA sensitivity analysis produces a range spanning from $52.89 to $238.00. That spread is not a sign that the model is broken. It is an honest reflection of how much a bank’s estimated value depends on assumptions about two variables, growth and required return, that no one can predict with precision.
A valuation range can tell an investor:
- Whether a stock’s current price sits inside, above, or below the range of plausible outcomes
- Which assumptions would need to hold for the current price to be justified
- How much room exists for error before the investment thesis changes
A valuation range cannot tell an investor:
- What the share price will do next week, next month, or next year
- Whether now is the right time to buy or sell
- What other market participants are thinking or how they will behave
“A valuation model tells you what a stock is worth under a set of assumptions, not what the market will do next.”
CBA’s illustrative market price of $162.78 sits above the base DDM estimate of $98.33 but above the gross dividend DDM estimate of $143.80 as well. The framing of the question, specifically which dividend figure to use, changes the answer materially. This is why the concept of a margin of safety matters: investors who require a meaningful gap between the market price and their modelled estimate are building in a buffer against the inevitable imprecision of the inputs.
No single model output constitutes a buy or sell signal. Both PE and DDM are starting points for further analysis, not verdicts.
This article is for informational purposes only and should not be considered financial advice. Investors should conduct their own research and consult with financial professionals before making investment decisions. Past performance does not guarantee future results. Financial projections are subject to market conditions and various risk factors.
The next major ASX story will hit our subscribers first
Beyond the numbers: qualitative factors that affect bank stock value
Quantitative models can only capture what is already known and expressed in historical data. The qualitative layer is where investors find signals that precede the numbers.
Macroeconomic signals to watch
Three macroeconomic variables are most directly linked to Australian bank earnings:
- Unemployment levels. Rising unemployment increases the likelihood that borrowers default on home loans and personal debt, eroding the quality of a bank’s loan book and compressing earnings. Current data is available from ABS Labour Force, Australia (abs.gov.au/statistics/labour/employment-and-unemployment/labour-force-australia/latest-release).
- Residential property values. Australian banks hold enormous mortgage portfolios. Falling property prices reduce the collateral backing those loans and can trigger higher provisioning for bad debts. The ABS Residential Property Price Indexes (abs.gov.au/statistics/economy/price-indexes-and-inflation/residential-property-price-indexes-eight-capital-cities/latest-release) provide the authoritative data.
- Consumer confidence. When households feel pessimistic about the economic outlook, they borrow less and save more, which slows credit growth and compresses the revenue banks can generate from new lending.
The RBA cash rate of 4.35% as of May 2026, reached via a hiking cycle rather than a prolonged hold, directly affects both net interest margins and the discount rate assumptions plugged into DDM calculations. A shifting rate environment means last year’s assumptions may no longer hold.
Company-specific questions to ask
Beyond macro conditions, investors benefit from examining each bank’s revenue mix. A bank heavily reliant on NIM is more exposed to rate cycle shifts than one growing non-interest income from fees, wealth management, or insurance. The cost-to-income ratio, which measures how efficiently a bank converts revenue into profit, reveals whether management is maintaining operational discipline.
Annual reports, investor day transcripts, and regulatory commentary from APRA and ASIC are all freely accessible and provide direct insight into management quality and strategic direction.
A framework for combining both methods and taking your next step
Running two separate valuations is more useful than running one, but the real value emerges when the outputs are read together. A simple three-step process ties the exercise together:
- Run both the PE and DDM valuations using the most current financial data available.
- Note where the outputs converge or diverge. Convergence between two independent methods carries more weight than any single estimate. Divergence signals that the assumptions behind one or both models need closer scrutiny.
- Layer in qualitative factors from the macroeconomic and company-specific analysis above, then form a considered view expressed as a range rather than a single price target.
In the CBA illustrative example, the PE-based valuation produced approximately $101.54, the base DDM approximately $98.33, and the gross dividend DDM approximately $143.80. All three sit below the illustrative share price of $162.78. The convergence of two independent methods at the lower end of the range is itself a signal worth taking seriously.
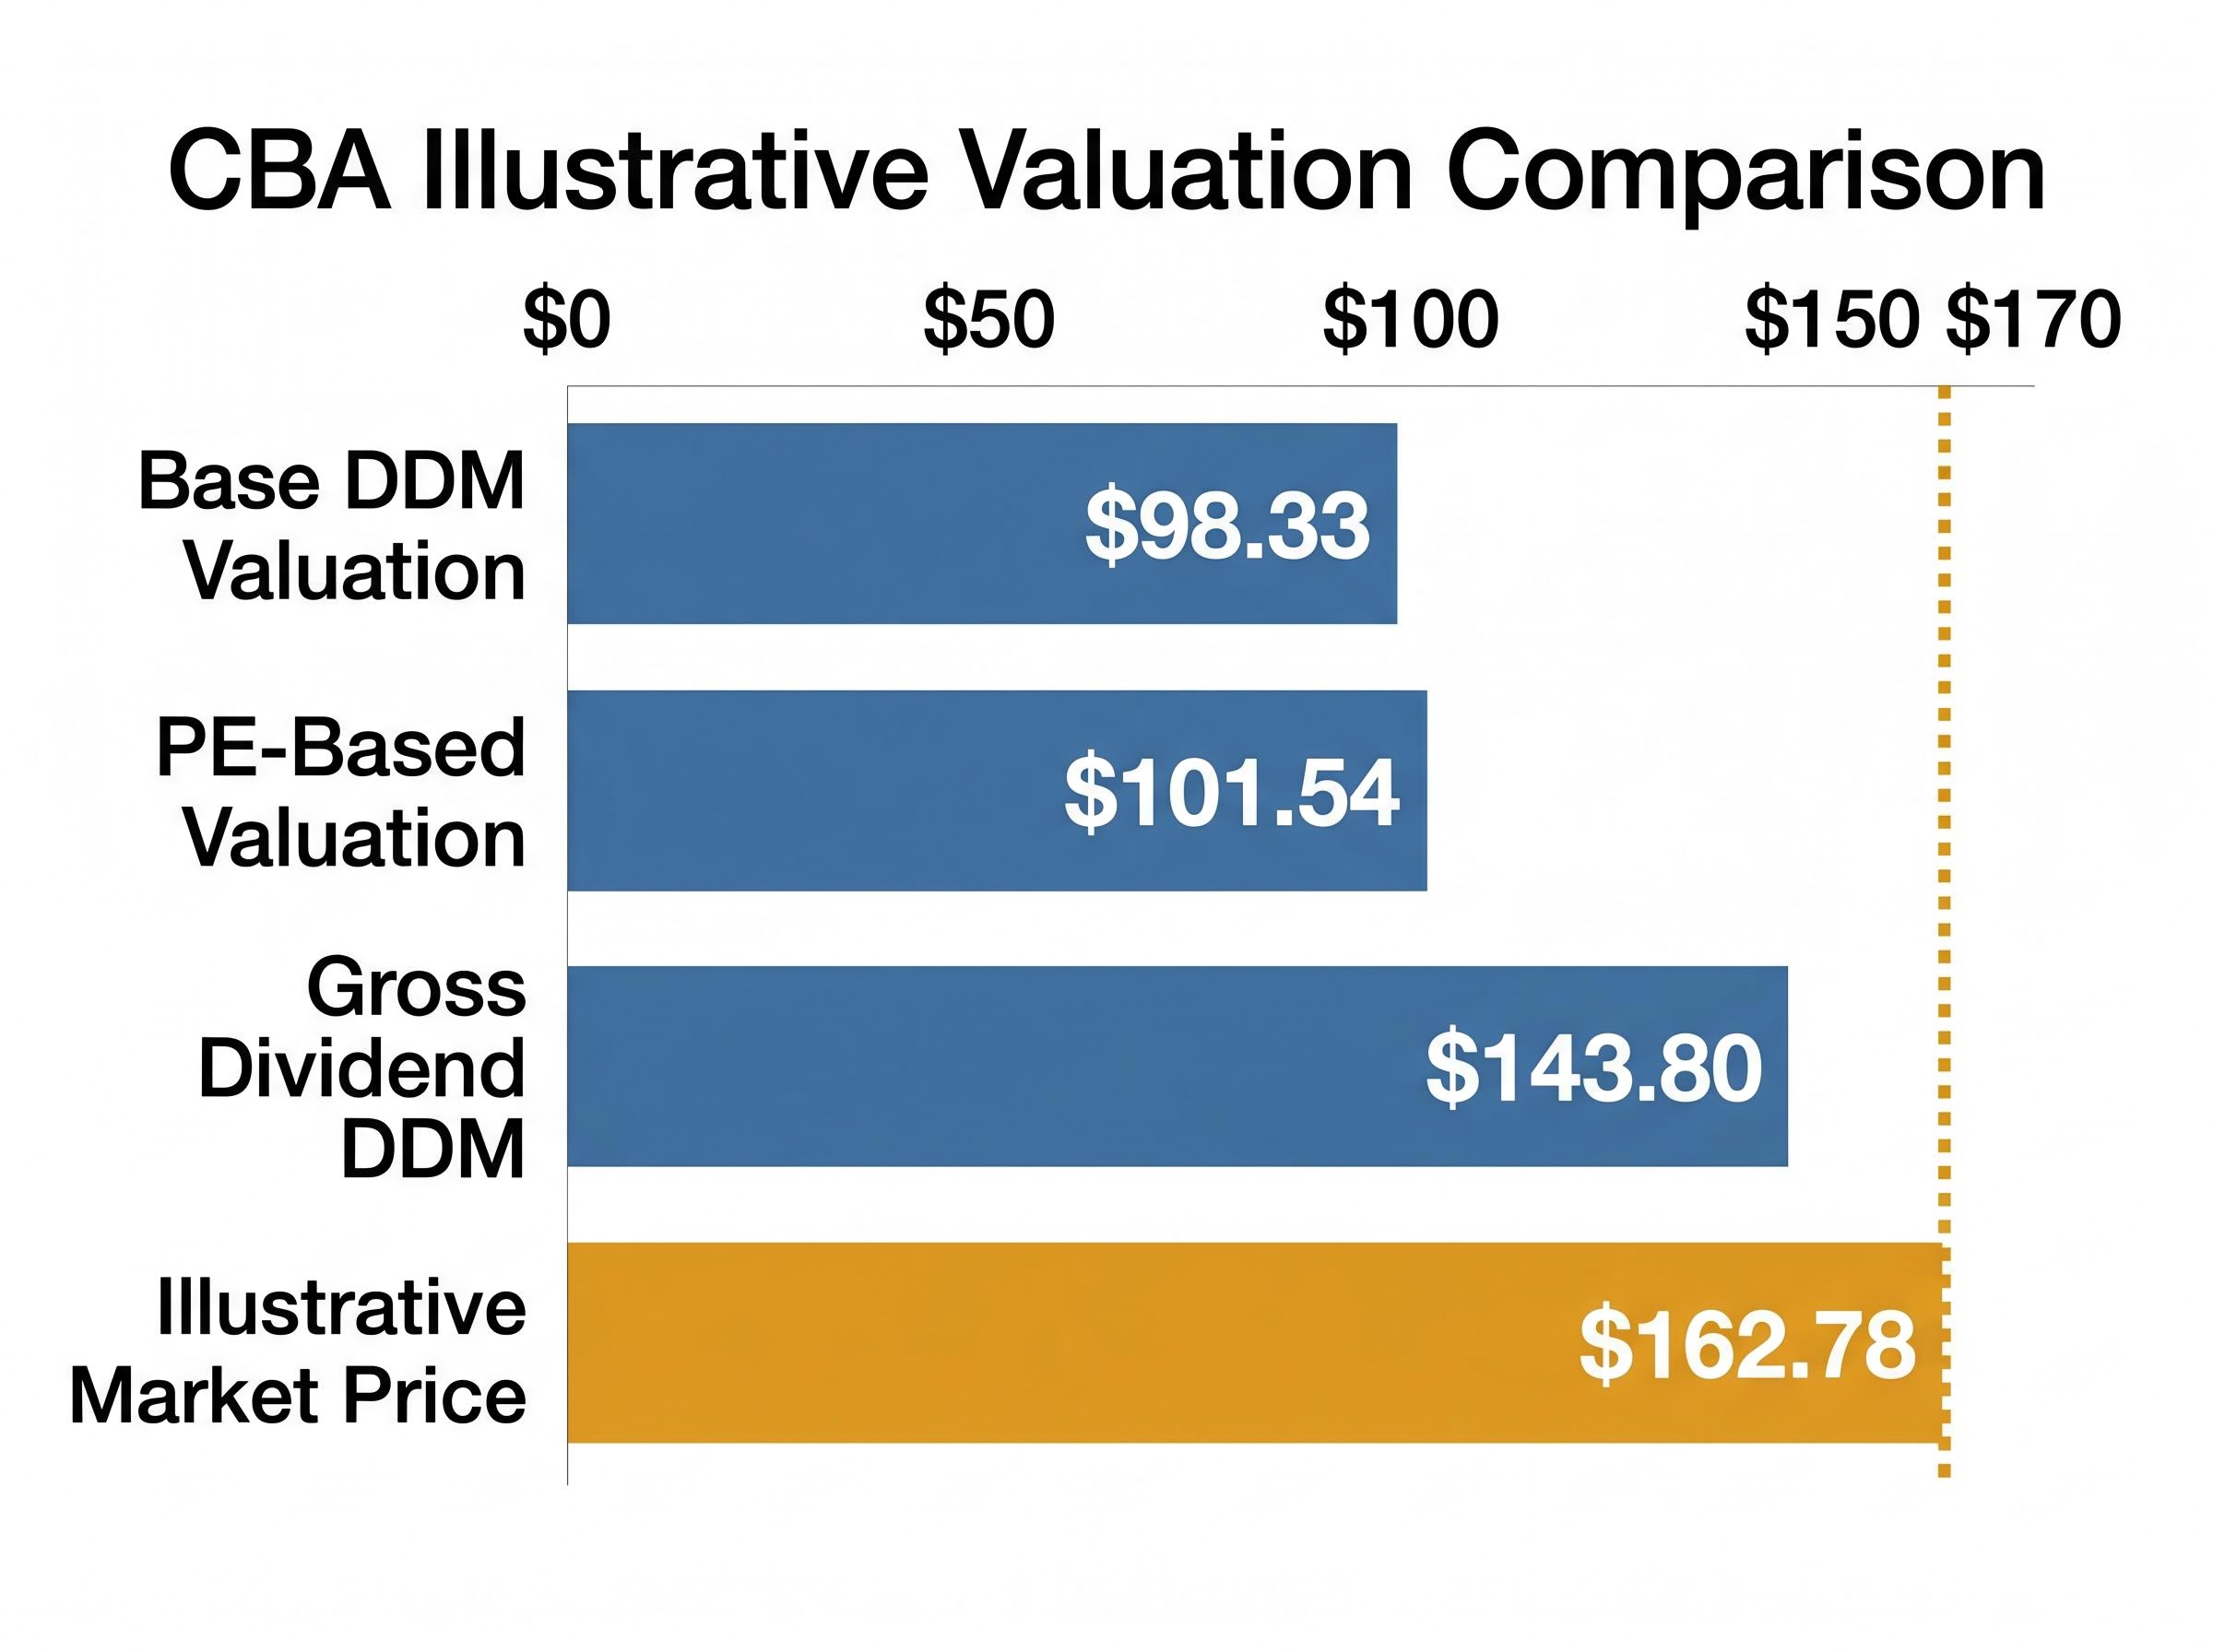
Both the PE and DDM approaches, using illustrative FY24 data, point to the same general conclusion: CBA’s share price sits above the range that these fundamental models support. That convergence is the most useful output the exercise produces.
These are illustrative figures built on FY24 data. For any current analysis, retrieve the FY25 results from CBA’s investor relations page at commbank.com.au/about-us/investors/results. The ASX investor education hub (asx.com.au/investors/learn-about-shares) and ASIC Moneysmart (moneysmart.gov.au/investment-choices/shares) offer further foundational resources.
The goal of any valuation exercise is not a precise price target. It is a clearer sense of whether a stock is likely cheap, fair, or expensive relative to its fundamentals. Combining two methods and layering in qualitative judgement brings a retail investor meaningfully closer to the analytical standard used by professional fund managers.
Investors wanting to build a full analytical framework from the quantitative foundations covered here will find our comprehensive walkthrough of qualitative bank valuation useful; it applies a five-factor checklist covering income structure, property exposure, unemployment trajectory, management discipline, and arrears trends to the current May 2026 environment, including the specific data that Morgan Stanley and other analysts are flagging as early stress indicators in the current credit cycle.
—