How to Value ASX Bank Stocks Using PE and DDM
7 mins ago

Most Australian retail investors know Westpac pays a reliable fully franked dividend, but very few could say whether the current share price of around $36.21 is cheap, fair, or expensive based on those dividends alone. The Dividend Discount Model is one of the most intuitive valuation tools available, and ASX bank stocks are among its best natural applications, given their long dividend histories, relatively stable payout patterns, and the unique boost that Australian franking credits add to after-tax returns. Yet the model is rarely explained with enough specificity for someone to actually run the numbers.
This guide walks through the complete DDM methodology using Westpac (ASX: WBC) as a live case study. It covers how to set up the formula, how to choose realistic growth and discount rate inputs, what the numbers actually produce, and how franking credits can shift a fair-value estimate materially. By the end, readers will have a replicable framework they can apply to any ASX dividend-paying stock.
The DDM works best for companies with predictable, long-term dividend streams. Australia’s Big Four banks fit this profile more closely than most listed businesses. Their earnings are anchored to the domestic mortgage and lending cycle, their payout ratios tend to be high and consistent, and their boards treat the dividend as a signalling mechanism that management is reluctant to cut without cause.
Contrast this with a high-growth technology company reinvesting every dollar of cash flow, or a capital-intensive industrial firm whose dividends swing with commodity prices. For those businesses, a dividend-based valuation framework would be unreliable. For a bank like Westpac, which paid a full-year ordinary dividend of $1.53 per share in FY2025 (an interim of 76 cents paid 27 June 2025 and a final of 77 cents paid 19 December 2025), the income stream is the core of the investment case.
The range of ASX sectors suited to DDM is narrower than many investors assume: banks, listed infrastructure, utilities, and consumer staples qualify largely because regulatory constraints and mandated distribution requirements produce the stable payout histories the model requires, while most industrials and technology companies do not.
Three structural characteristics make bank stocks particularly DDM-friendly:
KPMG’s 2025 Australian major bank benchmarks place the sector’s average return on equity at approximately 10.7% and average net interest margin at 183 basis points, contextualising Westpac’s FY2025 ROE of 9.7% and NIM of 1.95% as positioned slightly below and above those respective sector averages.
Fully franked dividends mean the company has already paid 30% corporate tax on the profits distributed. Eligible Australian shareholders can claim that tax payment as a credit against their own income tax liability. For investors on lower marginal rates, the credit can even produce a refund.
This matters for valuation because the cash dividend understates the true pre-tax value of the income stream. A DDM that ignores franking credits systematically undervalues Australian bank stocks for domestic investors, a point this guide quantifies in a later section.
The DDM answers one question: if a stock pays dividends into the future and an investor requires a certain annual return, what is the most that investor should pay for it today?
The logic is straightforward. A share is worth the present value of all the dividends it will ever pay. If those dividends grow at a constant rate, the maths simplifies into a single formula known as the Gordon Growth Model. This variant is the most practical for stable dividend payers like the major banks, because it requires only three inputs.
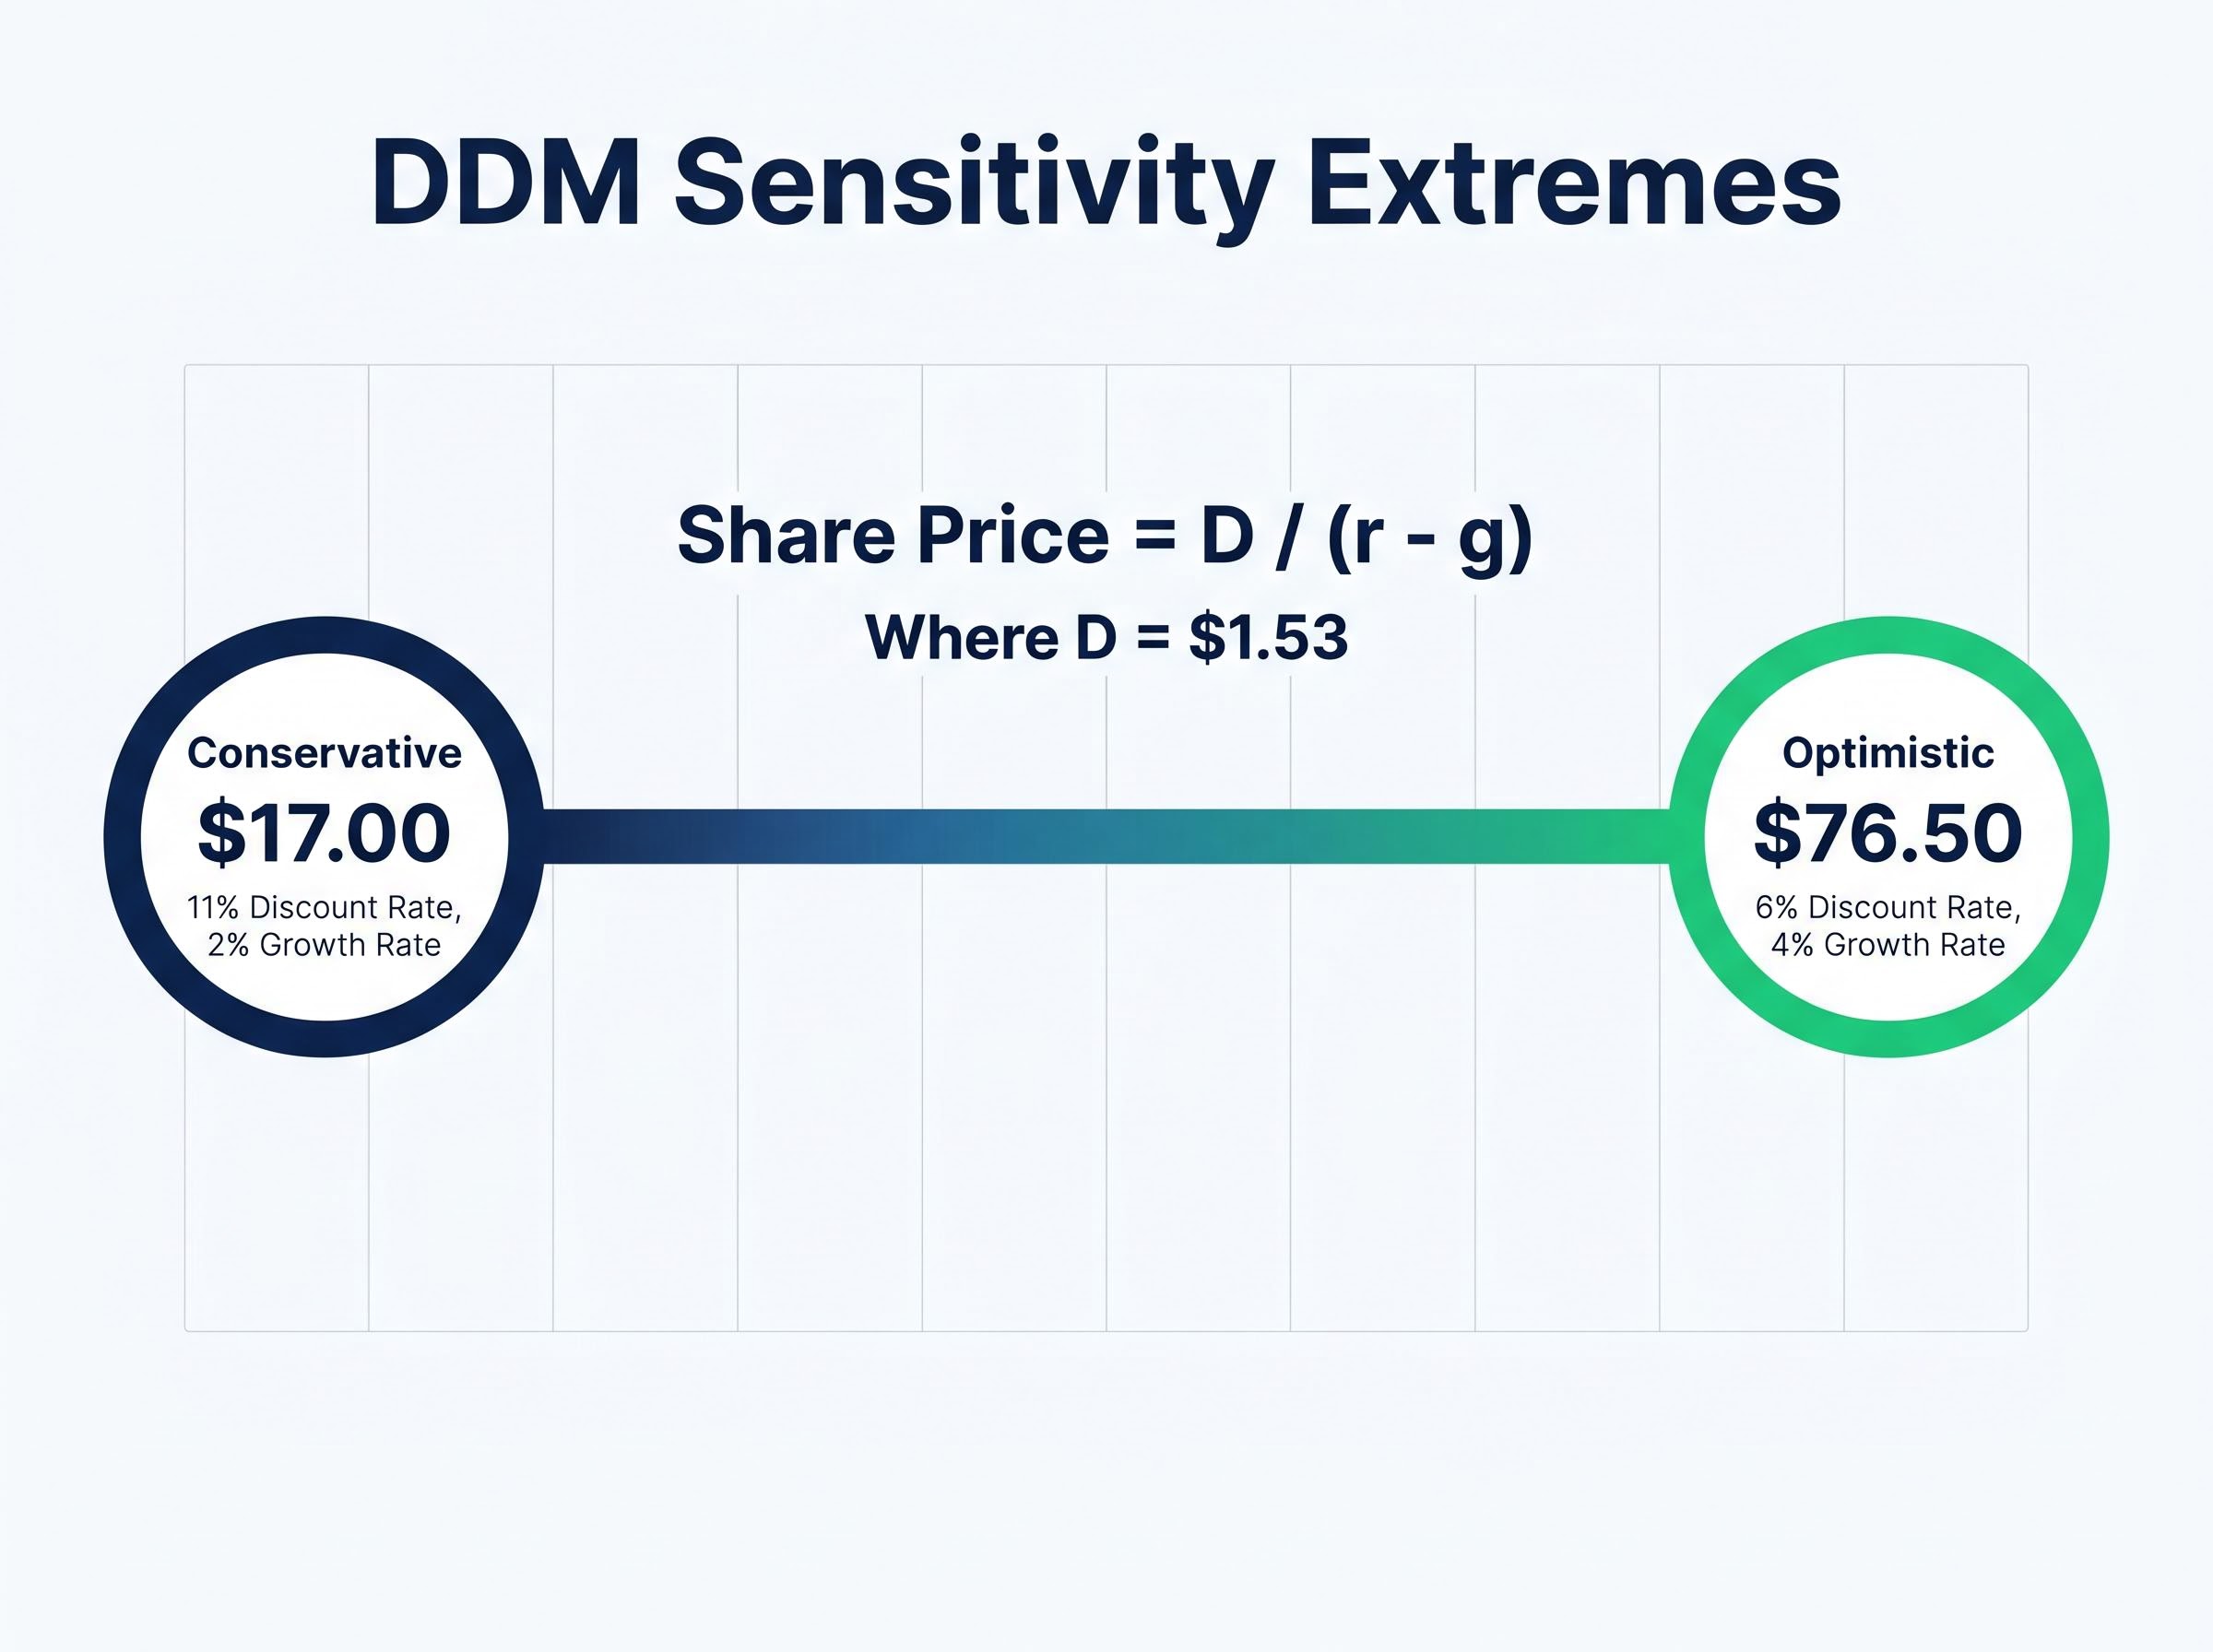
DDM Formula (Gordon Growth Model): Share Price = D / (r – g)
Where D = next year’s expected dividend, r = required return (discount rate), g = expected long-run dividend growth rate
Each variable in plain language:
The formula captures a simple relationship: the higher the dividend or growth rate, the more the stock is worth; the higher the required return, the less it is worth. What makes the model genuinely useful, and genuinely tricky, is how an investor selects those inputs.
This is where the DDM shifts from arithmetic to judgment. The formula is simple; the assumptions that feed it are not.
The discount rate represents the annual return an investor requires for holding the stock. A common starting framework uses the risk-free rate (typically proxied by Australian government bond yields) plus a risk premium reflecting the additional uncertainty of owning bank equity. For a major Australian bank, a range of 6% to 11% captures positions from relatively optimistic required returns through to more conservative risk-adjusted expectations.
The dividend growth rate should reflect realistic long-run earnings growth, not recent short-term momentum. Mature Australian banks operate in a saturated domestic lending market. A sustained growth range of 2% to 4% per annum is commonly applied. Westpac’s FY2025 ROE of 9.7% provides a reality check: a bank cannot sustainably grow dividends faster than it grows earnings, and ROE sets an upper boundary on that growth capacity.
The model’s output is highly sensitive to the gap between these two inputs. A discount rate of 8% and a growth rate of 3% produces a very different result than 10% and 2%. Running multiple scenarios is more informative than treating any single output as precise.
The macro assumptions driving bank valuations extend well beyond the growth and discount rate inputs in the DDM: RBA rate trajectory, employment conditions, and property price expectations each shift the plausible range of earnings-per-share growth, which is why professional analysts covering NAB and its peers can hold buy and sell ratings simultaneously on the same stock.
The sensitivity table below uses Westpac’s $1.53 dividend across a range of assumptions:
| Discount Rate (r) | g = 2% | g = 3% | g = 4% |
|---|---|---|---|
| 6% | $38.25 | $51.00 | $76.50 |
| 8% | $25.50 | $30.60 | $38.25 |
| 10% | $19.13 | $21.86 | $25.50 |
| 11% | $17.00 | $19.13 | $21.86 |
The key insight: small changes in the gap between r and g produce large swings in the estimated fair value. At a 6% discount rate and 4% growth, the model produces $76.50. At 11% and 2%, it produces $17.00. Same company, same dividend, vastly different conclusions.
That range is not a flaw. It is the model telling the investor that valuation depends on their own assumptions about risk and growth, and that those assumptions deserve scrutiny.
The sensitivity table above uses the cash dividend of $1.53. For eligible Australian taxpayers, that figure understates the true value of the income stream, because every dollar of Westpac’s fully franked dividend carries a corporate tax credit attached.
The adjustment is mechanical but the impact is material. Here is how to gross up a fully franked dividend to its pre-tax equivalent:
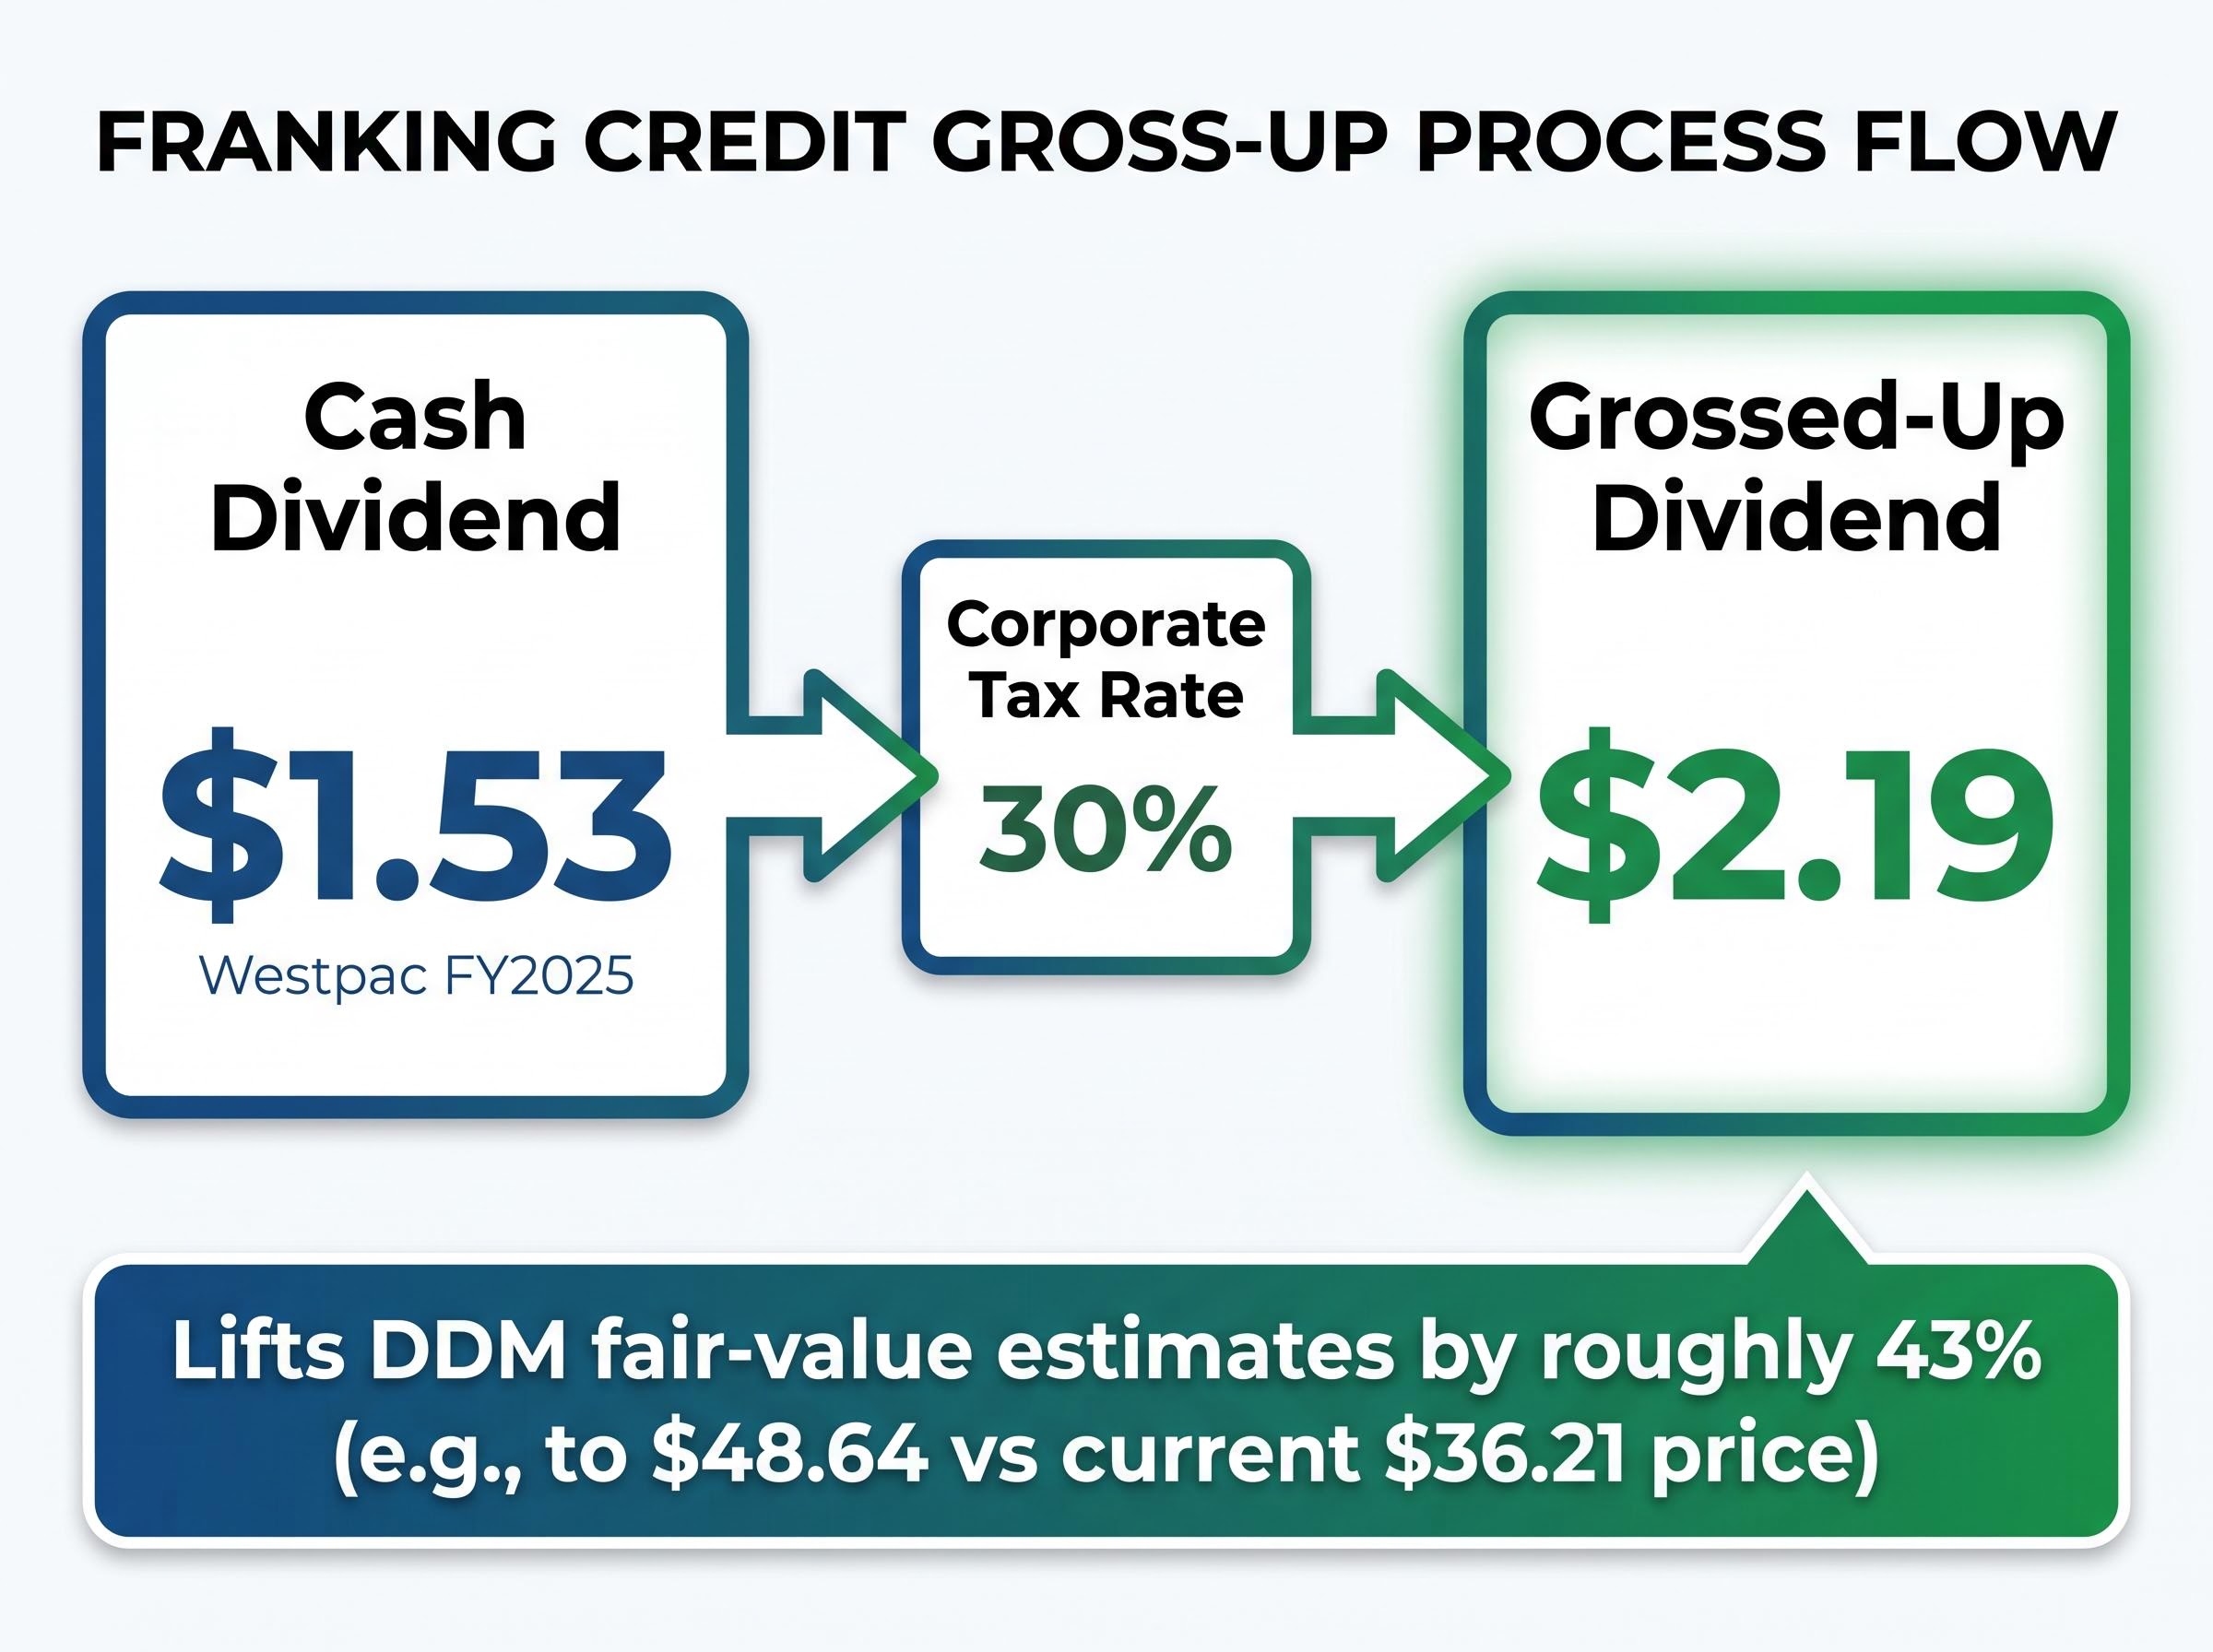
Westpac’s $1.53 fully franked dividend is equivalent to a $2.19 pre-tax dividend for eligible Australian shareholders.
The magnitude of this adjustment is significant. Using the grossed-up dividend of $2.19 instead of the cash figure lifts every fair-value estimate by roughly 43%. Under certain assumption sets, incorporating franking credits has been shown to produce fair-value estimates in the vicinity of $48.64 per share, well above the current market price of approximately $36.21.
Two caveats apply. First, the franking credit benefit depends on the investor’s marginal tax rate and eligibility to claim refundable credits. Self-managed superannuation funds in pension phase and low-income investors receive the full benefit; higher-rate taxpayers receive a partial offset. Second, foreign investors generally cannot claim Australian franking credits, which means the grossed-up DDM is relevant only for eligible domestic holders.
For Australian resident investors on standard marginal tax rates, ignoring franking credits in a DDM can cause a 30-40% underestimate of fair value. That is a material analytical error this adjustment corrects.
The DDM produces a number. That number rests on an assumption the model cannot verify: that dividends will grow at a constant rate, indefinitely, without interruption. For a major bank, several real-world risks can break that assumption.
APRA’s capital adequacy standards require authorised deposit-taking institutions to maintain minimum CET1 ratios and obtain regulatory approval before making capital distributions that exceed statutory after-tax earnings, which means dividend payout decisions at the major banks are structurally constrained by prudential requirements, not just board discretion.
Westpac’s current financial position provides context for where the bank sits within these risks. FY2025 net interest margin was 1.95%, above the major bank average of 1.78%. Common equity tier 1 (CET1) capital, a measure of balance-sheet resilience, stood at 12.5%, above sector averages. ROE was 9.7%. These metrics indicate current health, but they can change materially across economic cycles.
The DDM captures the value of the dividend stream. It does not capture asset backing or relative earnings pricing. Two complementary lenses address those gaps.
A price-to-earnings (P/E) ratio compares the share price to earnings per share, revealing whether the market is paying a premium or discount relative to current profitability. A price-to-book (P/B) ratio compares the share price to net asset value per share, which is particularly relevant for banks where the balance sheet is the business.
The price-to-earnings limitations for bank stocks are more structural than they appear: the major banks cluster in a narrow PE band in 2026, meaning qualitative factors such as NIM trajectory, regulatory exposure, and management culture carry more weight in distinguishing relative value than the earnings multiple alone.
A convergence of signals across multiple methods, where the DDM, P/E, and P/B all point in the same direction, provides a stronger basis for a valuation view than any single model output.
This guide has covered three steps that, taken together, give retail investors a replicable valuation framework:
The wide spread of outputs is not a weakness. It is an honest reflection of valuation uncertainty. Some assumption sets produced estimates well below Westpac’s current share price of approximately $36.21; others produced estimates well above it. The model does not deliver a verdict. It frames the question, and the investor’s job is to decide which assumptions they find most credible.
Revisiting the model with each new set of full-year results, and cross-referencing with the company’s annual report for forward earnings guidance, turns a one-off calculation into an ongoing analytical habit.
Dividend trap warning signs, including payout ratios above 100%, yield spikes driven by falling share prices rather than rising dividends, and one-off special payments inflating trailing yield, are the practical complement to a DDM analysis, because the model assumes the dividend base is sustainable when the market may already be pricing in a cut.
This article is for informational purposes only and should not be considered financial advice. Investors should conduct their own research and consult with financial professionals before making investment decisions. Past performance does not guarantee future results. Financial projections are subject to market conditions and various risk factors.
The Dividend Discount Model (DDM) values a share by calculating the present value of all future dividends it is expected to pay. For ASX stocks like Westpac, the Gordon Growth Model variant simplifies this into three inputs: the expected annual dividend, the required rate of return, and the long-run dividend growth rate.
Fully franked dividends carry a corporate tax credit worth 30% of the pre-tax profit distributed, which means the cash dividend understates the true income value for eligible Australian investors. Grossing up Westpac's $1.53 cash dividend produces an equivalent pre-tax figure of approximately $2.19 per share, lifting every fair-value estimate in the DDM by roughly 43%.
For mature Australian banks like Westpac, a long-run dividend growth rate of 2% to 4% per annum is commonly applied, reflecting the saturated domestic lending market. Discount rates typically range from 6% to 11%, representing the risk-free rate plus a bank equity risk premium.
Australia's major banks have long dividend histories, high and consistent payout ratios, and earnings anchored to the domestic mortgage and lending cycle, all of which are the stable, predictable characteristics the DDM requires. Most technology or commodity-exposed companies lack this dividend consistency, making the model unreliable for them.
The DDM assumes dividends grow at a constant rate indefinitely, but Australian banks have cut dividends during severe downturns, most recently in 2020, and earnings can be materially affected by APRA capital requirements, interest rate changes, and rising loan losses during recessions. Cross-referencing the DDM with price-to-earnings and price-to-book ratios provides a more complete valuation picture.