Starbucks Builds AI Tools to Drop Microsoft, IBM and Oracle Apps
3 hrs ago
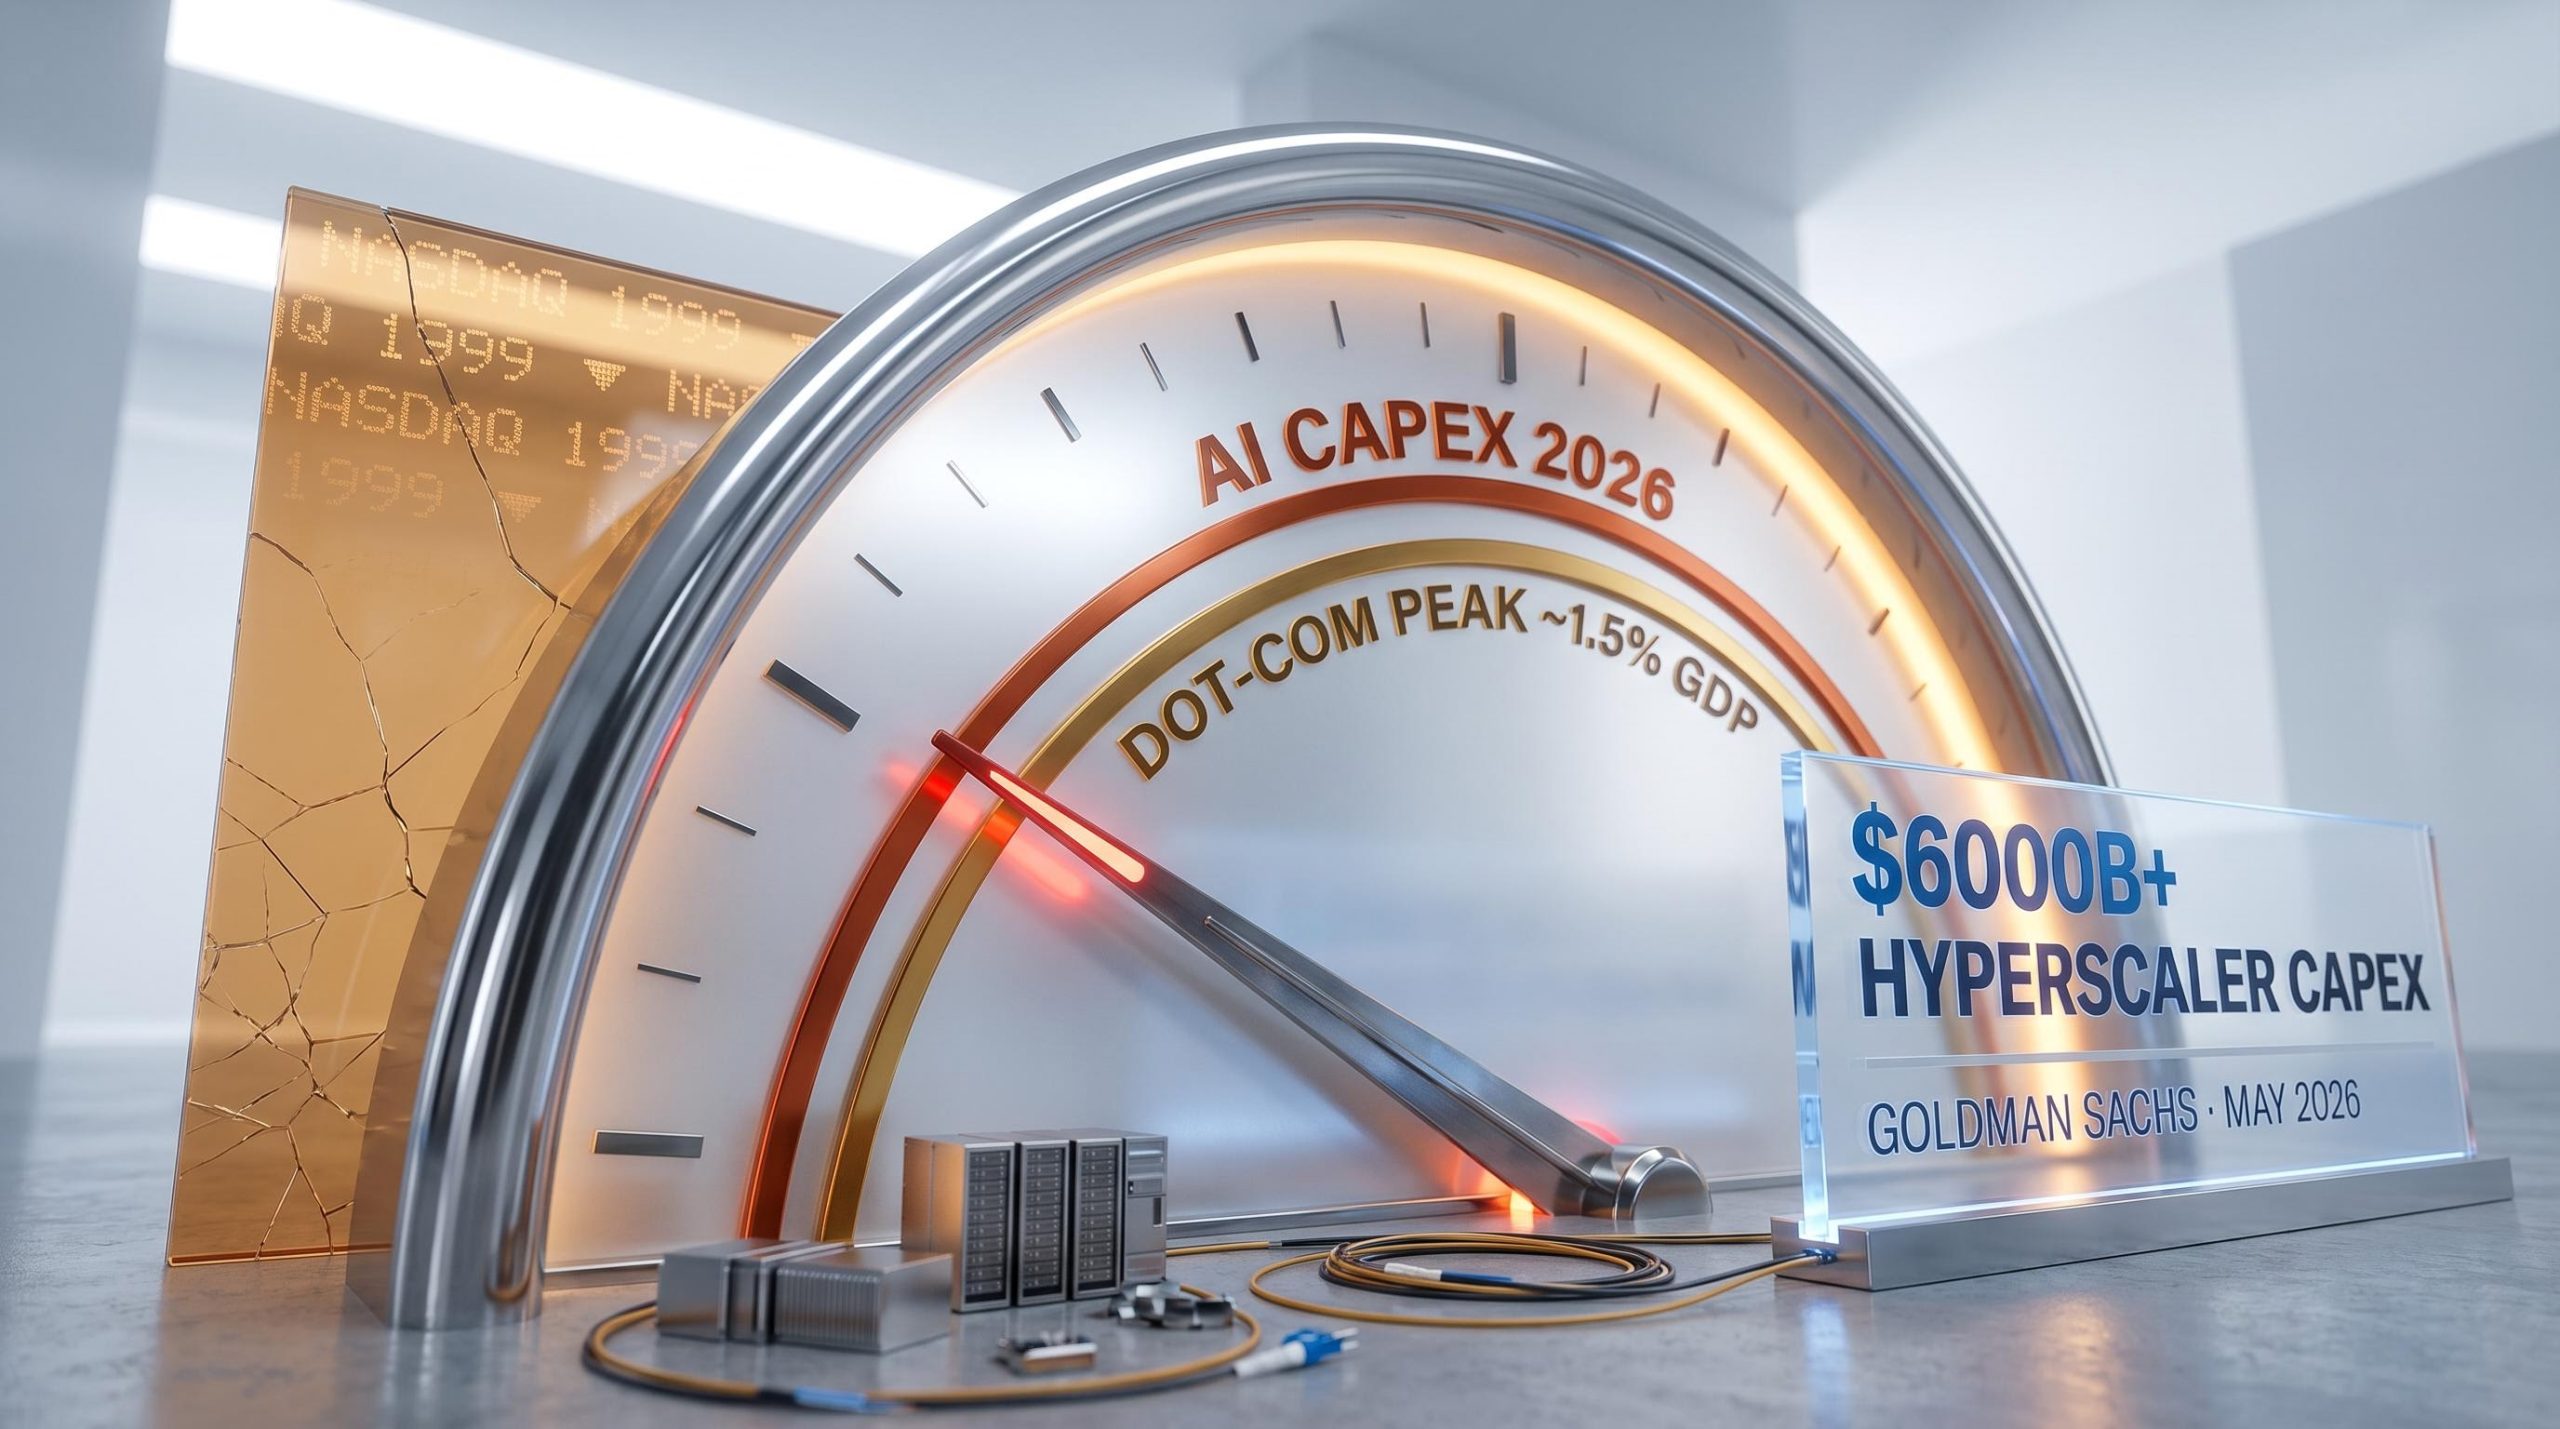
Goldman Sachs has identified a milestone that reframes the AI investment debate: technology spending tied to artificial intelligence has now surpassed its late-1990s dot-com peak as a share of US GDP. The finding, drawn from Goldman’s May 2026 assessment, arrives at a moment when the four largest US hyperscalers are collectively guiding toward combined capital expenditure well above $600 billion annually, and when AI stock valuations have recovered to pre-conflict highs despite months of geopolitical turbulence. What follows is an examination of what the GDP milestone means for AI equity valuations, why the sector’s internal risk structure is more dangerous than headline volatility suggests, and what specific signals separate a durable investment cycle from a repeat of the late 1990s.
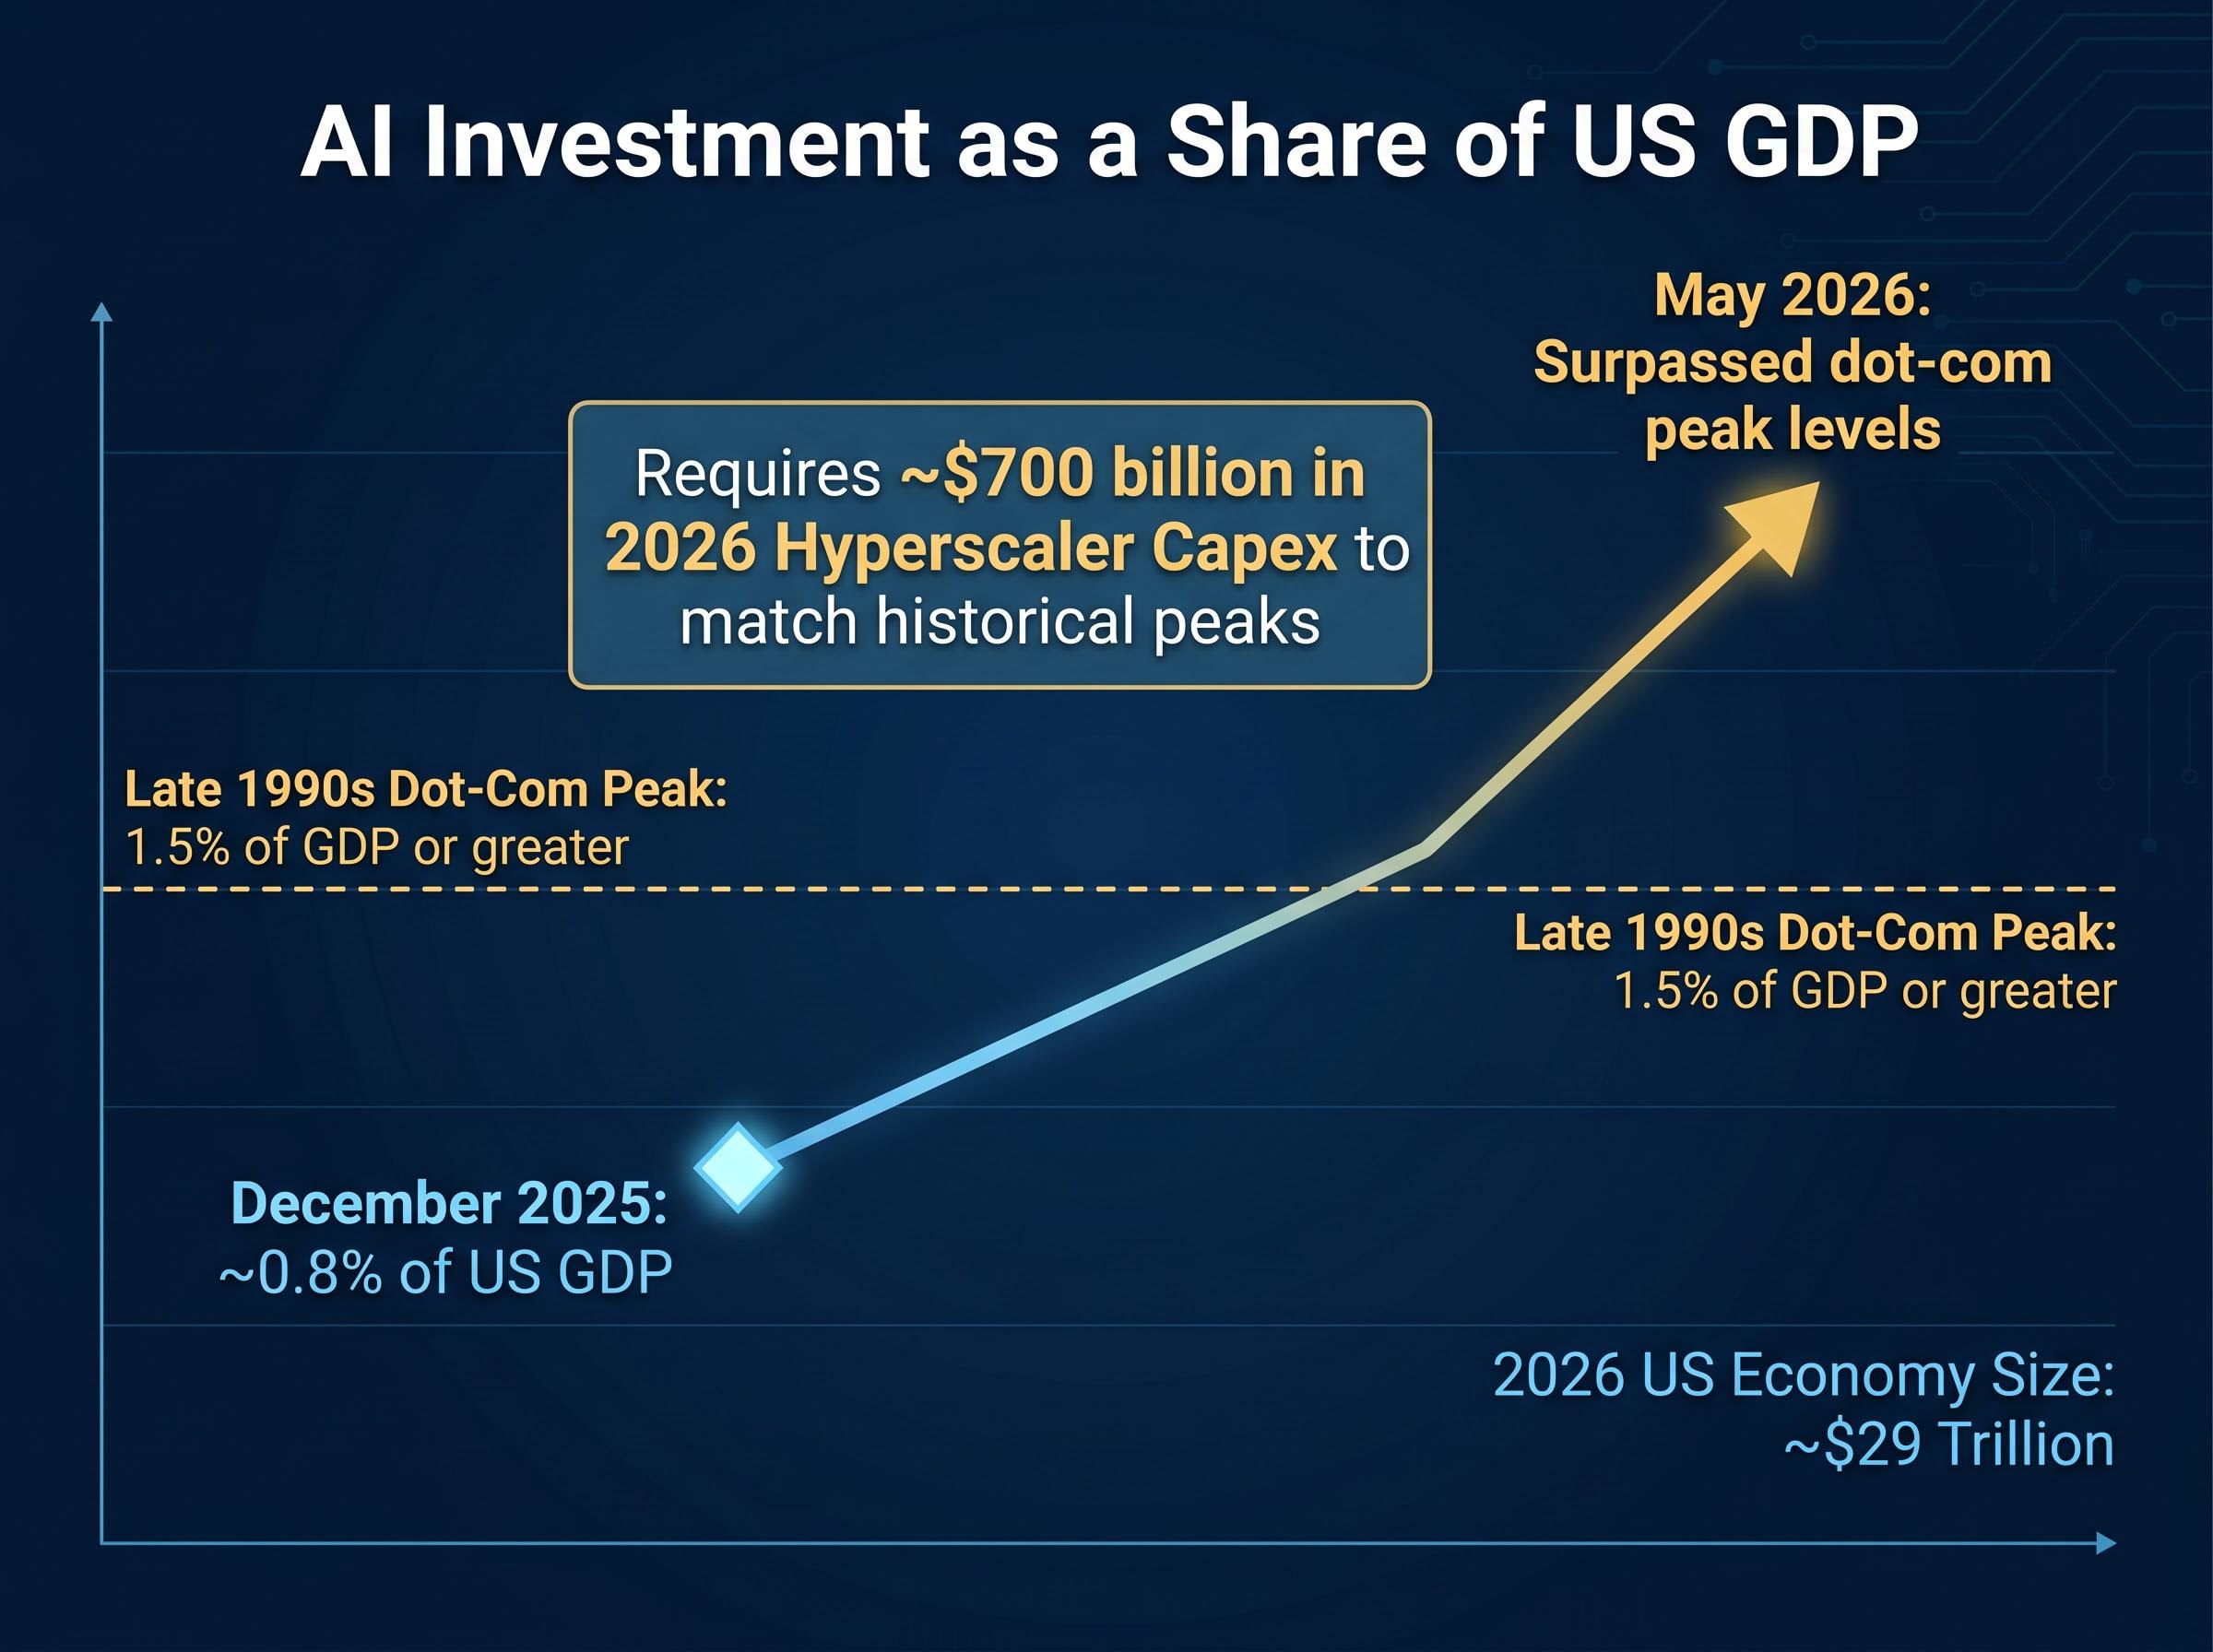
The headline number carries weight on its own terms. According to Goldman Sachs’ December 2025 assessment, AI-related technology investment as a share of US GDP stood at approximately 0.8%, remaining substantially below the peak levels of 1.5% of GDP or greater recorded during the late-1990s dot-com cycle, with hyperscaler capex needing to reach approximately $700 billion in 2026 to match those historical peak levels.
Goldman Sachs finding (May 2026): AI-related technology investment as a percentage of US GDP has surpassed the peak levels reached during the late-1990s dot-com era, marking a historically significant threshold for capital cycle analysis.
That assessment updates Goldman’s own earlier work. In December 2025, the firm placed AI capex at approximately 0.8% of GDP and noted that historical technology boom peaks had reached 1.5% of GDP or greater. The intervening months saw hyperscaler spending accelerate sharply, pushing the GDP-share figure through the prior cycle’s ceiling. The shift from below prior peaks to above them happened faster than most institutional forecasts anticipated.
AI spending as a share of GDP reached 4.9% in Q1 2026, surpassing both the dot-com era peak of approximately 4.2% and the cloud buildout peak of approximately 3.8%, with the rewards of that spending appearing most concentrated in the infrastructure and energy layer rather than in application stocks where monetisation remains contested.
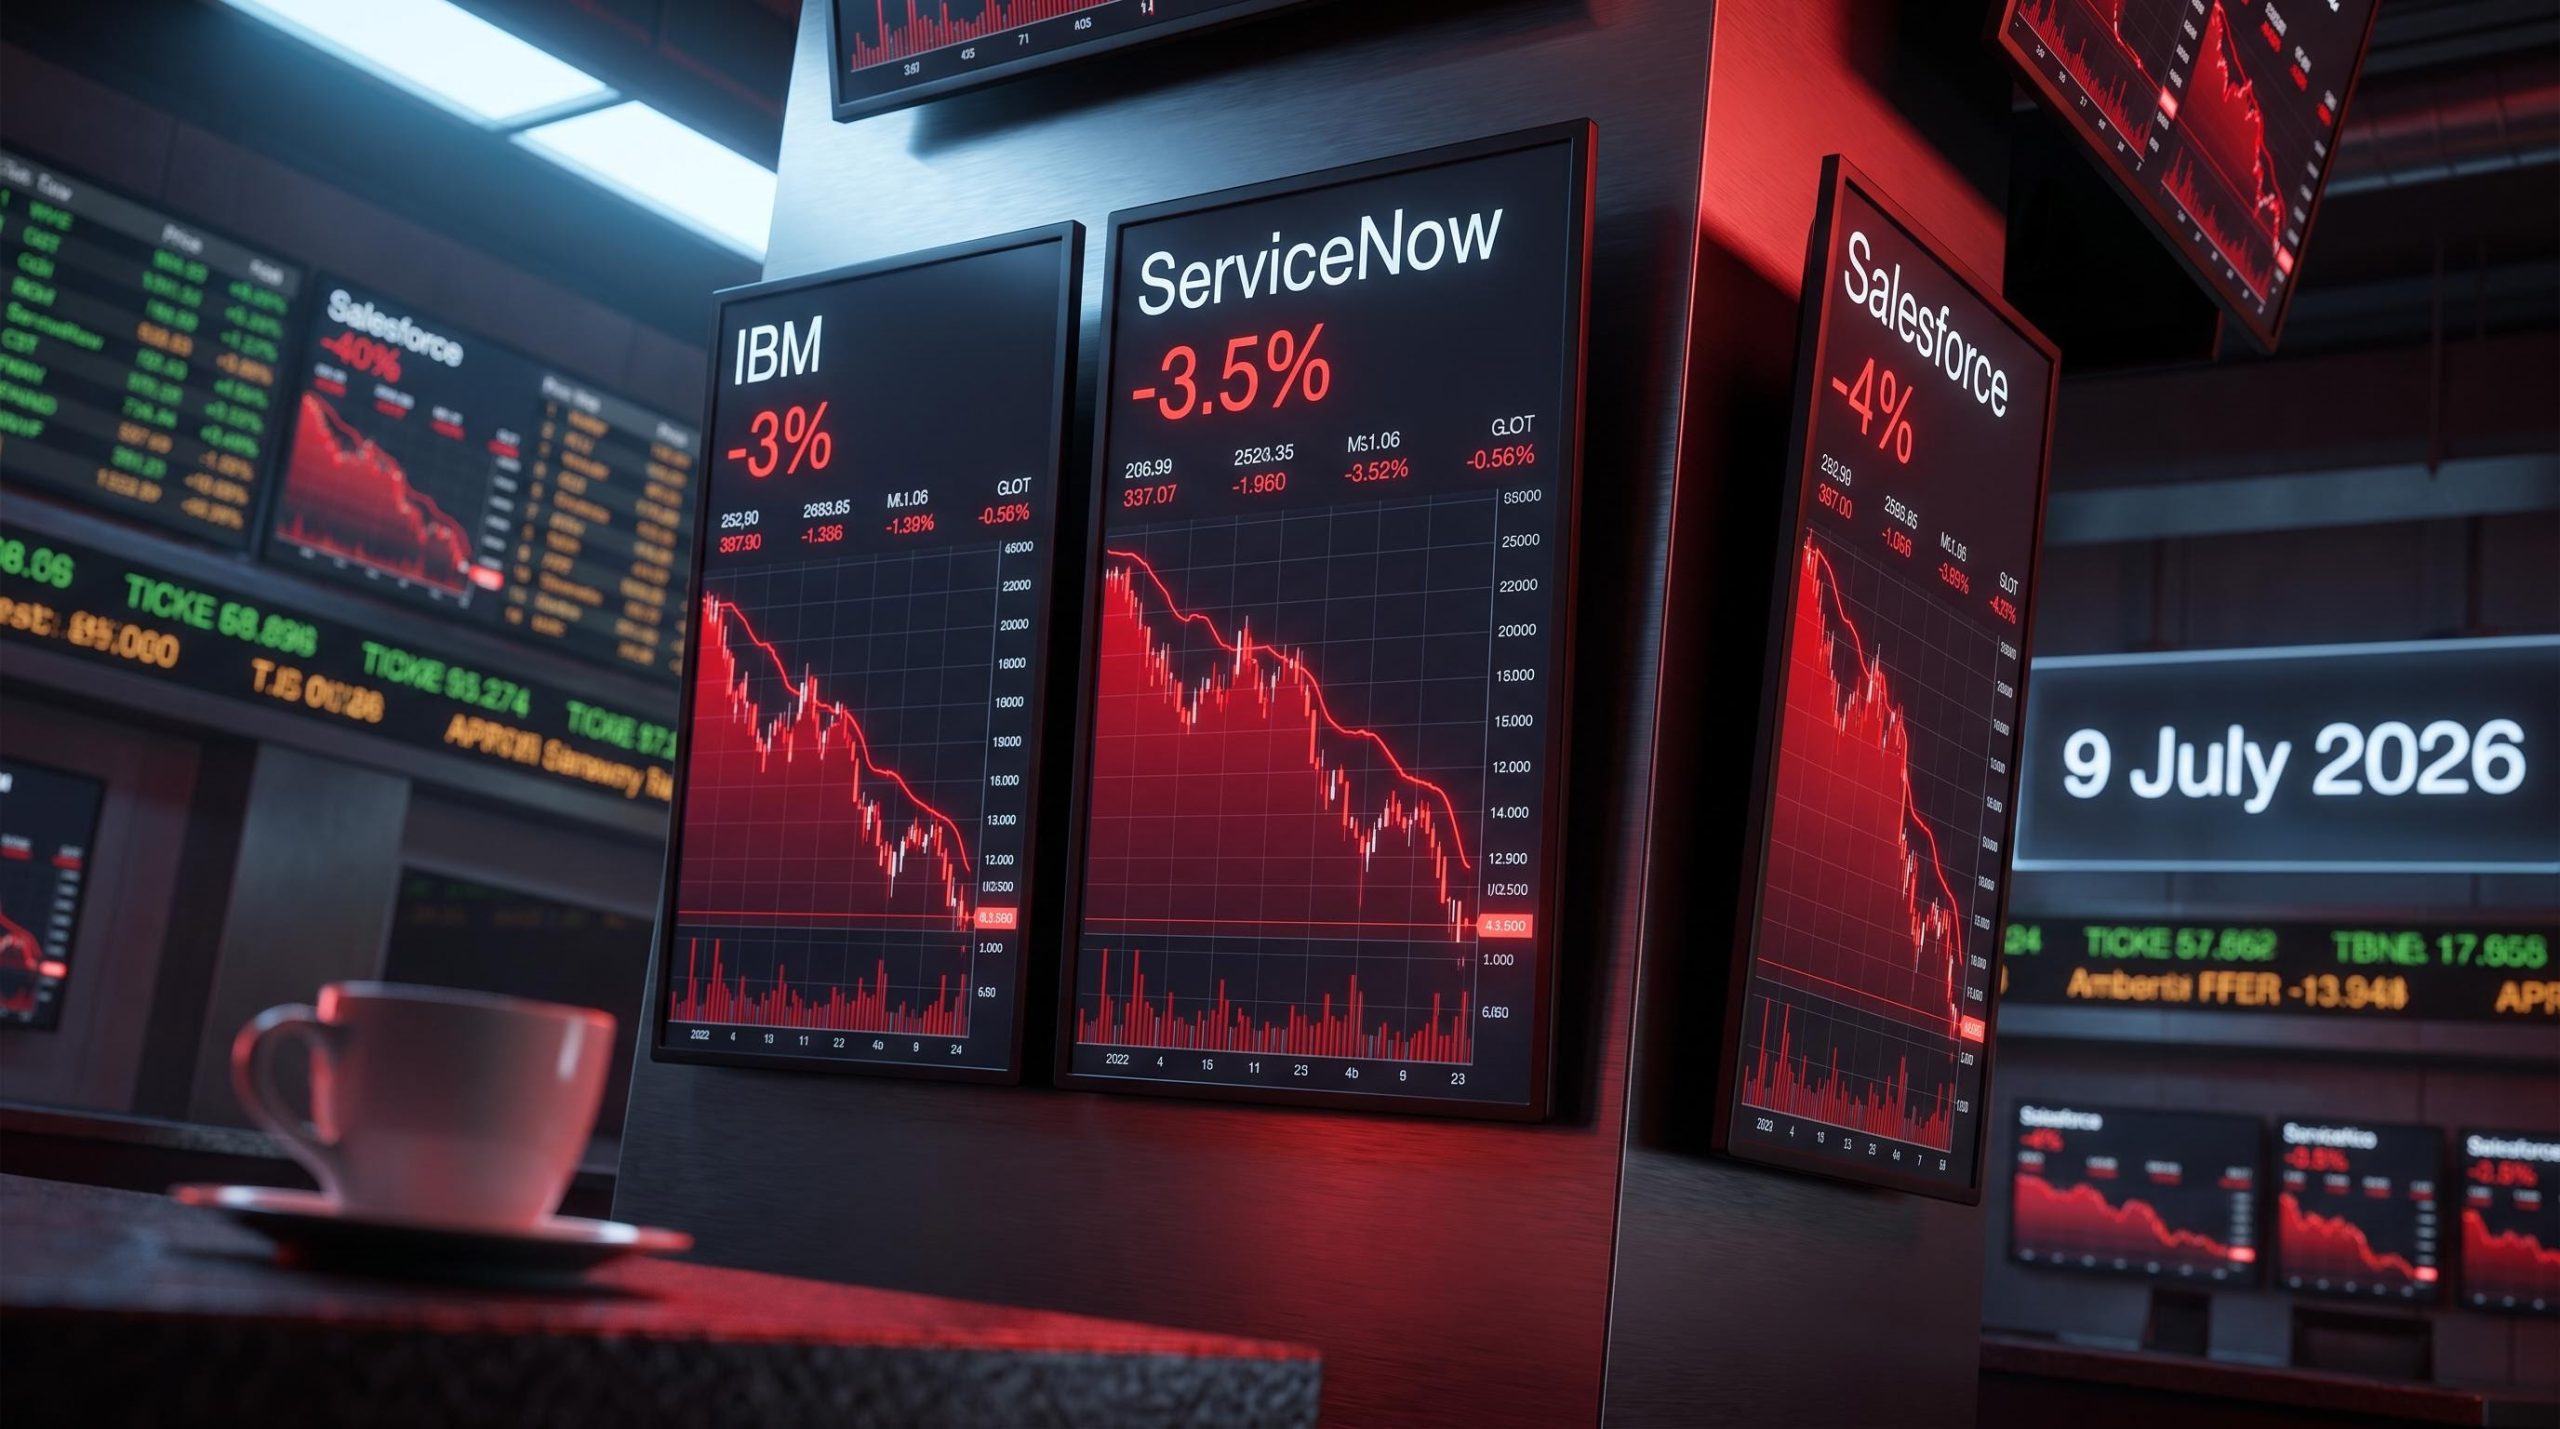
The tension is visible in market pricing. AI-concentrated indices, including the Nasdaq and regional benchmarks in Korea and Taiwan, recovered to pre-conflict price levels as of May 2026, even as Goldman simultaneously flagged growing valuation risk across the sector.
Comparing AI capex as a percentage of GDP rather than in absolute dollar terms is the only analytically honest way to benchmark against the 1990s. The US economy in 2026 is roughly three times larger in nominal terms than it was in 1999. A figure of $600 billion in annual hyperscaler spending sounds unprecedented, and in raw dollar terms it is. Sized against a $29 trillion economy, however, the GDP-share comparison provides the structural context that raw figures obscure. When Goldman uses this lens, it is measuring the economy’s commitment to a single technology bet relative to its total output, the same measurement that flagged the 1990s telecom build-out as historically anomalous.
Index-level volatility readings across AI-heavy benchmarks have remained subdued for months. For many investors, that calm registers as safety. Goldman Sachs’ May 2026 analysis explains why it should not.
The firm characterises what it calls “distributional” volatility within the AI sector: a growing divergence in outcomes between individual AI stocks, with clear winners and losers pulling apart even as the broader index stays relatively flat. The mechanism works in three steps:
Goldman’s May 2026 assessment found that this dispersion dynamic is pushing stock-to-stock correlations within the AI sector to historically low levels, a direct mechanical consequence of the winner-loser divergence.
The distinction matters for portfolio construction. Low index volatility in a genuinely calm market is a safety signal. Low index volatility produced by large opposing moves inside the index is a masking effect. Goldman’s framework warns that mistaking the second for the first is a specific and measurable error that leaves investors exposed to single-stock risk they believe they have diversified away.
The surface-level similarities between the current AI spending cycle and the late-1990s dot-com era are difficult to dismiss. Capital intensity is at historic scale. Spending is outpacing current monetisation across much of the sector. The entire investment thesis depends on eventual broad enterprise adoption to justify present-day multiples.
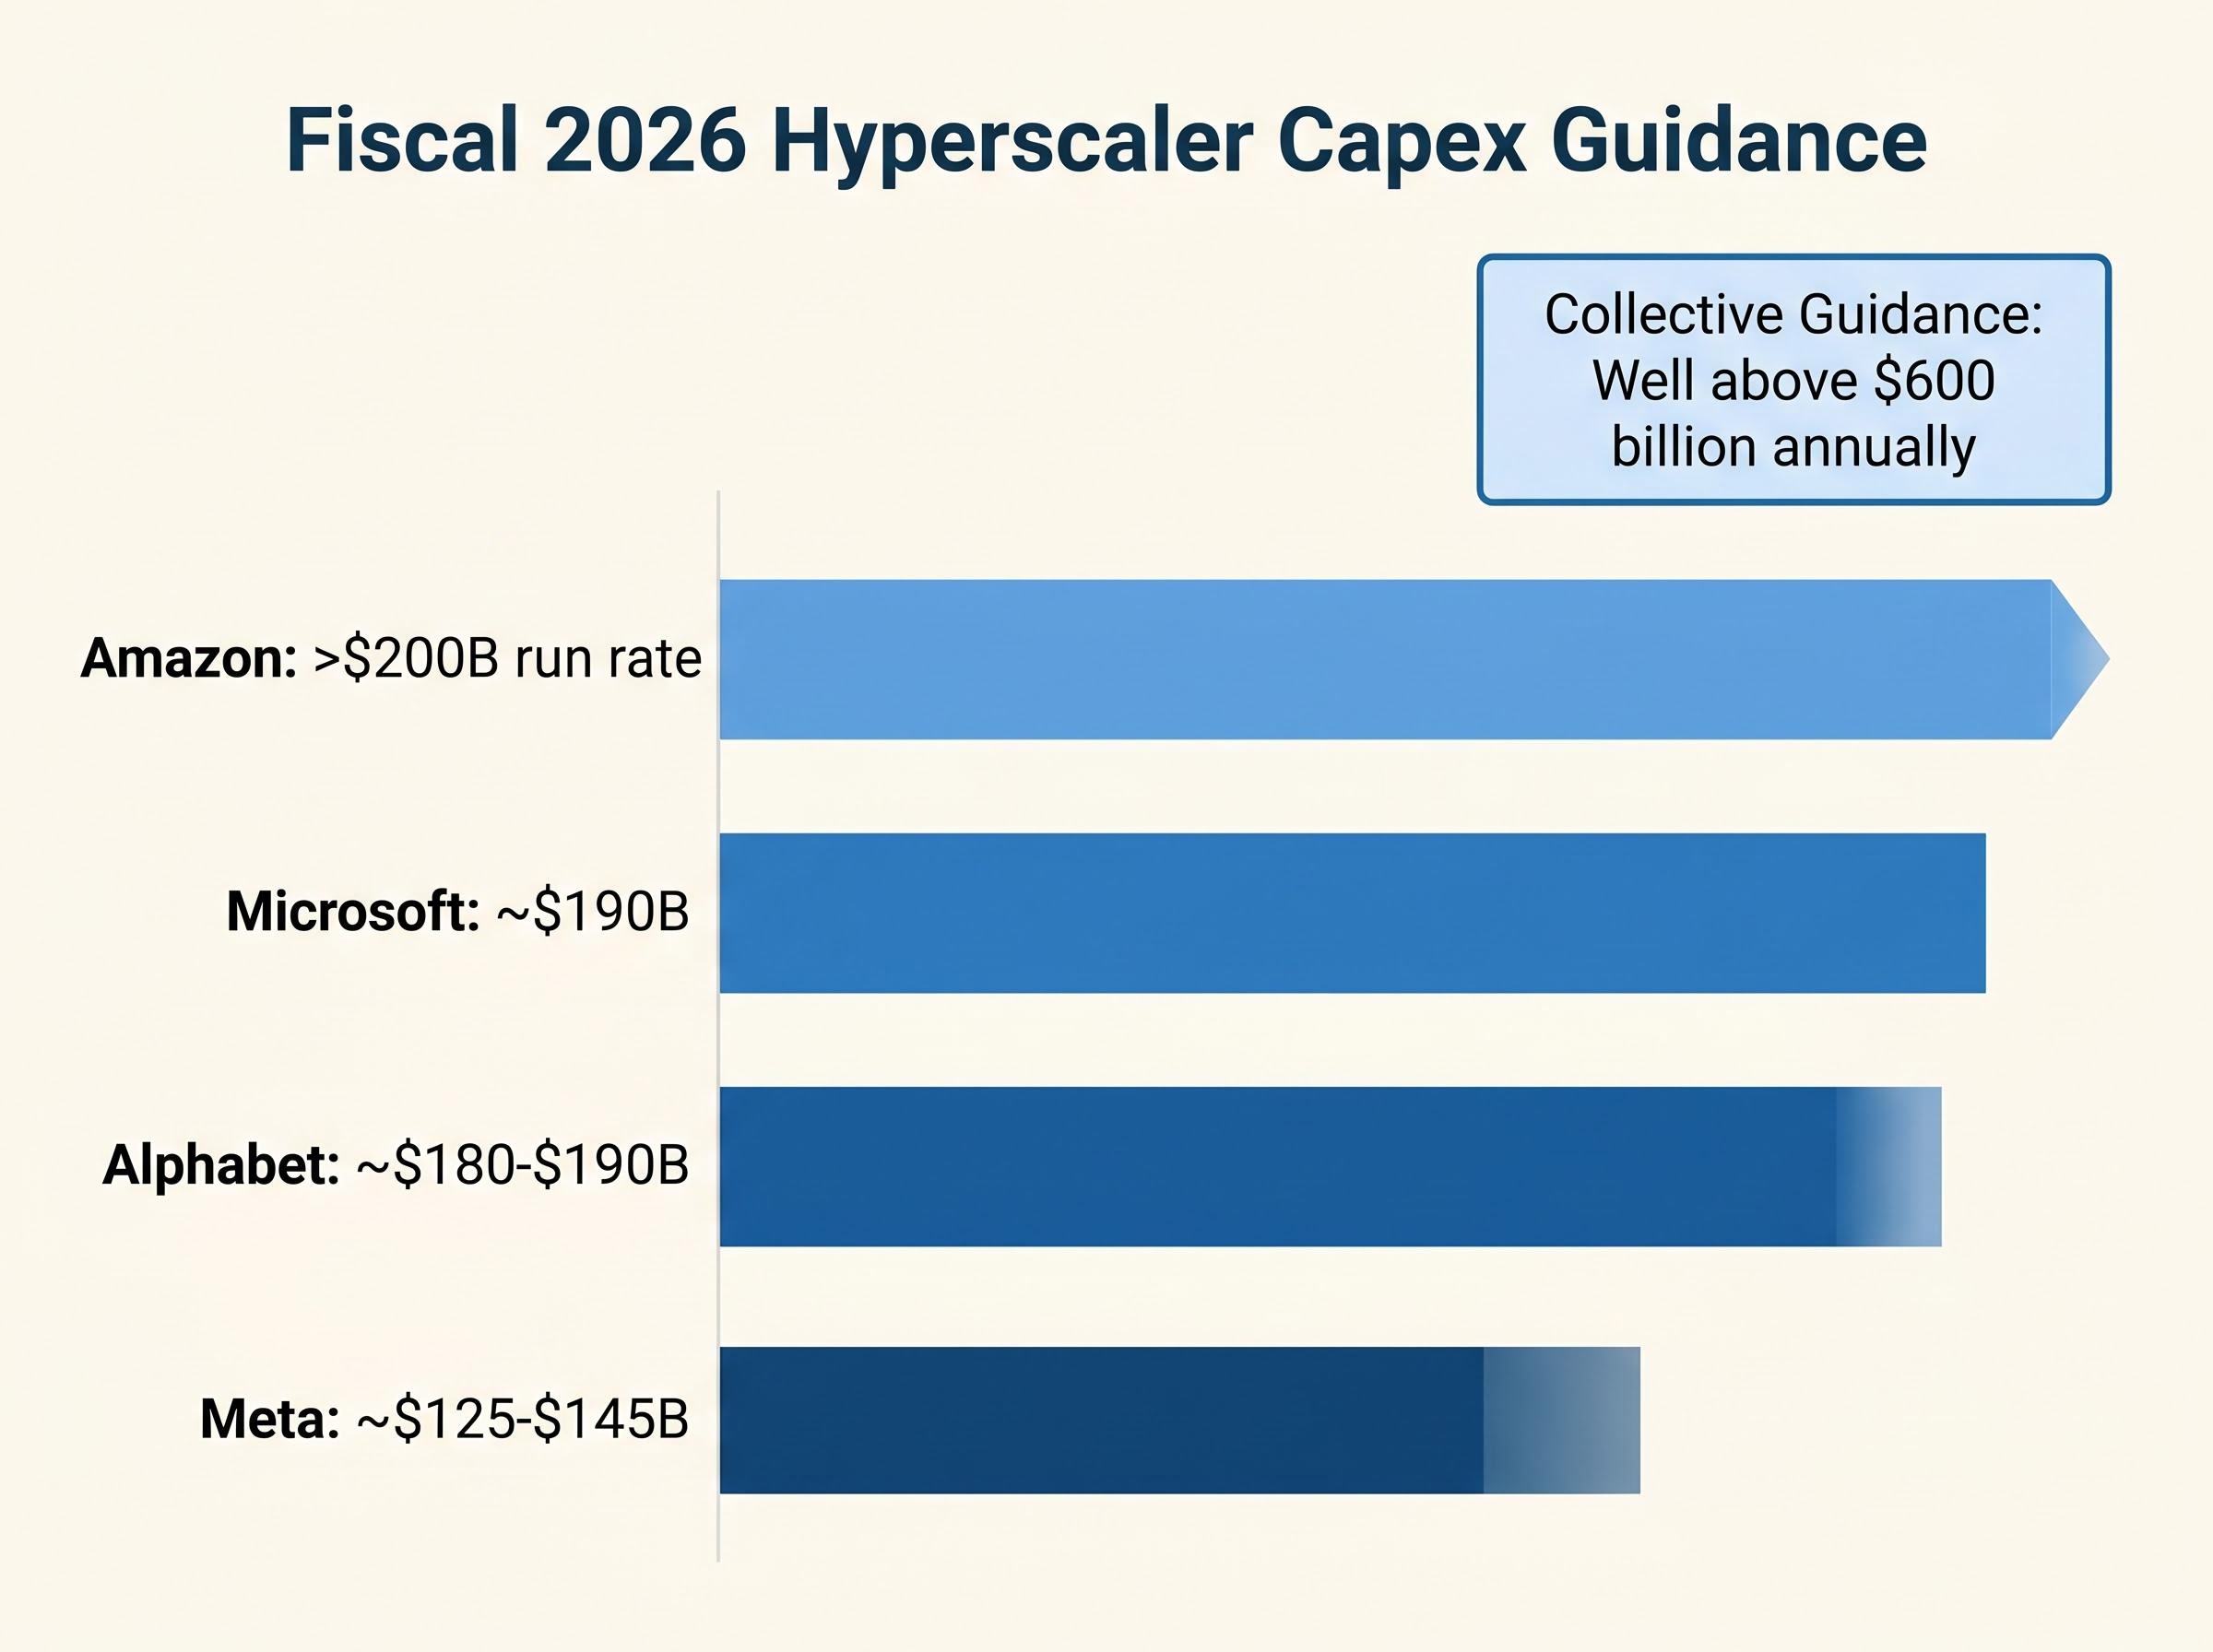
The hyperscaler capex figures illustrate the scale. Guidance-period estimates place Microsoft at approximately $190 billion through fiscal 2026, Alphabet at approximately $180-$190 billion, Amazon at an implied run rate above $200 billion, and Meta at approximately $125-$145 billion. These figures are drawn from earnings guidance and should be verified against the latest quarterly filings for precision.
| Dimension | Dot-com era (late 1990s) | Current AI cycle (2025-2026) |
|---|---|---|
| Revenue profile of leading companies | Most firms had little or no profit | Leaders generate substantial revenue and earnings |
| Capital intensity relative to GDP | Peaked at approximately 1.5% of GDP | Now reported to exceed late-1990s peak levels |
| Free cash flow generation | Largely absent across sector leaders | Hyperscalers produce large, positive free cash flow |
| Dependence on forward monetisation | Near-total; most revenue was speculative | Partial; real AI revenue exists but must accelerate |
The consensus analyst warning is direct: if hyperscaler spend slows before broad enterprise monetisation arrives, significant multiple compression could follow. That warning is structurally identical to what was said about telecom capex in 1999.
The difference that matters most is the pace of enterprise AI adoption. Measurable AI revenue is materialising across chips, cloud infrastructure, software, and advertising monetisation. The rate of enterprise uptake, however, must accelerate to meet the assumptions embedded in current capex trajectories. If adoption catches infrastructure spending, current valuations become more defensible than their dot-com equivalents ever were. If it does not, the capital intensity comparison becomes the dominant analogy. That verdict is not yet available.
For investors wanting to stress-test these comparisons against a rigorous historical framework, our full explainer on AI bubble frameworks and historical valuation examines the Shiller CAPE ratio at 40-41, Minsky financing stage classification, and dot-com era concentration data, with worked comparisons across the three most extreme valuation episodes in 155 years of market history.
The distributional volatility mechanism described above carries a specific consequence for passive investors. A narrow group of AI mega-cap leaders now represents a disproportionate share of benchmark weight inside indices that many retail investors hold through index funds or exchange-traded funds.
The concentration builds exposure through several channels:
Multiple major institutions have separately flagged this structural vulnerability. JPMorgan’s equity research highlights elevated concentration risk in benchmark indices. Bank of America has identified AI-related mega-cap concentration as a key risk to broader equity performance. Goldman Sachs’ May 2026 assessment characterises growing valuation risk accompanying the surge in AI spending.
Index concentration beyond dot-com levels is now a documented structural feature of US equity markets, with five companies controlling roughly 30% of total market capitalisation and the top 10 S&P 500 constituents representing approximately 40% of index weight, figures that Goldman Sachs and Morgan Stanley describe as extreme by any modern measure.
The asymmetry is straightforward: concentration amplifies gains during the leadership phase and amplifies losses during a de-rating. Passive investors who believe index ownership provides insulation from single-sector risk may be carrying more AI-specific exposure than they realise.
The analysis above produces three monitoring signals that investors can track to assess whether the AI cycle is maturing into self-sustaining growth or approaching a valuation correction.
Goldman characterises the current risk distribution as more evenly balanced following the recent market recovery, suggesting neither a clear bullish nor bearish macro setup. Separately, Goldman analyst Dominic Wilson has assessed that severe downside tail risk tied to macro escalation remains inadequately priced, a reminder that AI valuation risk does not exist in isolation from geopolitical risk.
Index breadth deterioration provides an independent confirmation of the distributional divergence Goldman describes: as of mid-May 2026, only 50.9% of S&P 500 constituents were trading above their 200-day moving average, down sharply from above 70% in March, a breadth signal that historically foreshadows index-level volatility even when headline indices remain near highs.
When AI stocks begin moving together again, with correlations rising across the cohort, it signals that the winner-loser dispersion is collapsing. The sector is repricing as a group rather than on individual merit. This is the reversal of the distributional volatility dynamic: the masking effect fades, and the underlying risk becomes visible at the index level. Historically, such reversals precede index-level volatility spikes rather than further calm.
AI capex has crossed a historically significant threshold. That fact existed in no prior year of this cycle, and it reframes the valuation debate whether or not it resolves it.
The tension at the centre of AI equity positioning remains genuinely two-sided. The leading AI companies carry real revenue, large free cash flow, and dominant competitive positions that their 1999 analogues never possessed. At the same time, the distributional volatility mechanism means the sector’s internal risk is higher than index-level volatility readings suggest, a structural condition likely to persist as long as the winner-loser divergence continues.
Goldman’s characterisation of the risk distribution as more evenly balanced reinforces the ambiguity. This is not a one-sided call. It is a two-tailed risk environment that demands calibration rather than conviction in either direction.
The cycle’s durability hinges on enterprise adoption catching up to infrastructure spend. That verdict is not yet in. For investors, the appropriate posture is not a binary stay-in or get-out decision but a continuous assessment of whether the monetisation evidence is strengthening or stalling relative to the capex commitments already made.
This article is for informational purposes only and should not be considered financial advice. Investors should conduct their own research and consult with financial professionals before making investment decisions. Past performance does not guarantee future results. Financial projections are subject to market conditions and various risk factors.
—
Distributional volatility refers to a growing divergence in performance between individual AI stocks, where winners and losers move in opposite directions. Because those opposing moves partially cancel out at the index level, headline volatility appears low even though individual stock risk is high, creating a misleading impression of a safe environment.
According to Goldman Sachs' May 2026 assessment, AI-related technology investment as a share of US GDP has now surpassed the peak levels recorded during the late-1990s dot-com cycle, which had previously reached approximately 1.5% of GDP. Earlier Goldman analysis from December 2025 had placed AI capex at around 0.8% of GDP, meaning the threshold was crossed rapidly over the intervening months.
Investors should track three key signals: the pace of enterprise AI monetisation relative to infrastructure spending, the trajectory of hyperscaler capital expenditure guidance, and stock-to-stock correlation trends within the AI sector. Rising correlations across AI stocks historically precede broader sector repricing and index-level volatility spikes.
A small number of AI leaders command outsized weighting in major benchmark indices, meaning a de-rating in those names moves the entire index. Nominally different index funds and ETFs often hold the same AI mega-caps in top positions, reducing the diversification benefit investors assume they are receiving.
Unlike dot-com era companies, today's leading hyperscalers generate substantial revenues, earnings, and large positive free cash flows. However, the current cycle still depends on enterprise AI adoption accelerating to justify capital expenditure trajectories, and if that monetisation does not materialise, the capital intensity comparison to the dot-com era becomes the dominant analogy.