Trump Tears Up Iran Deal as Oil and Rate Markets Reprice
1 hr ago
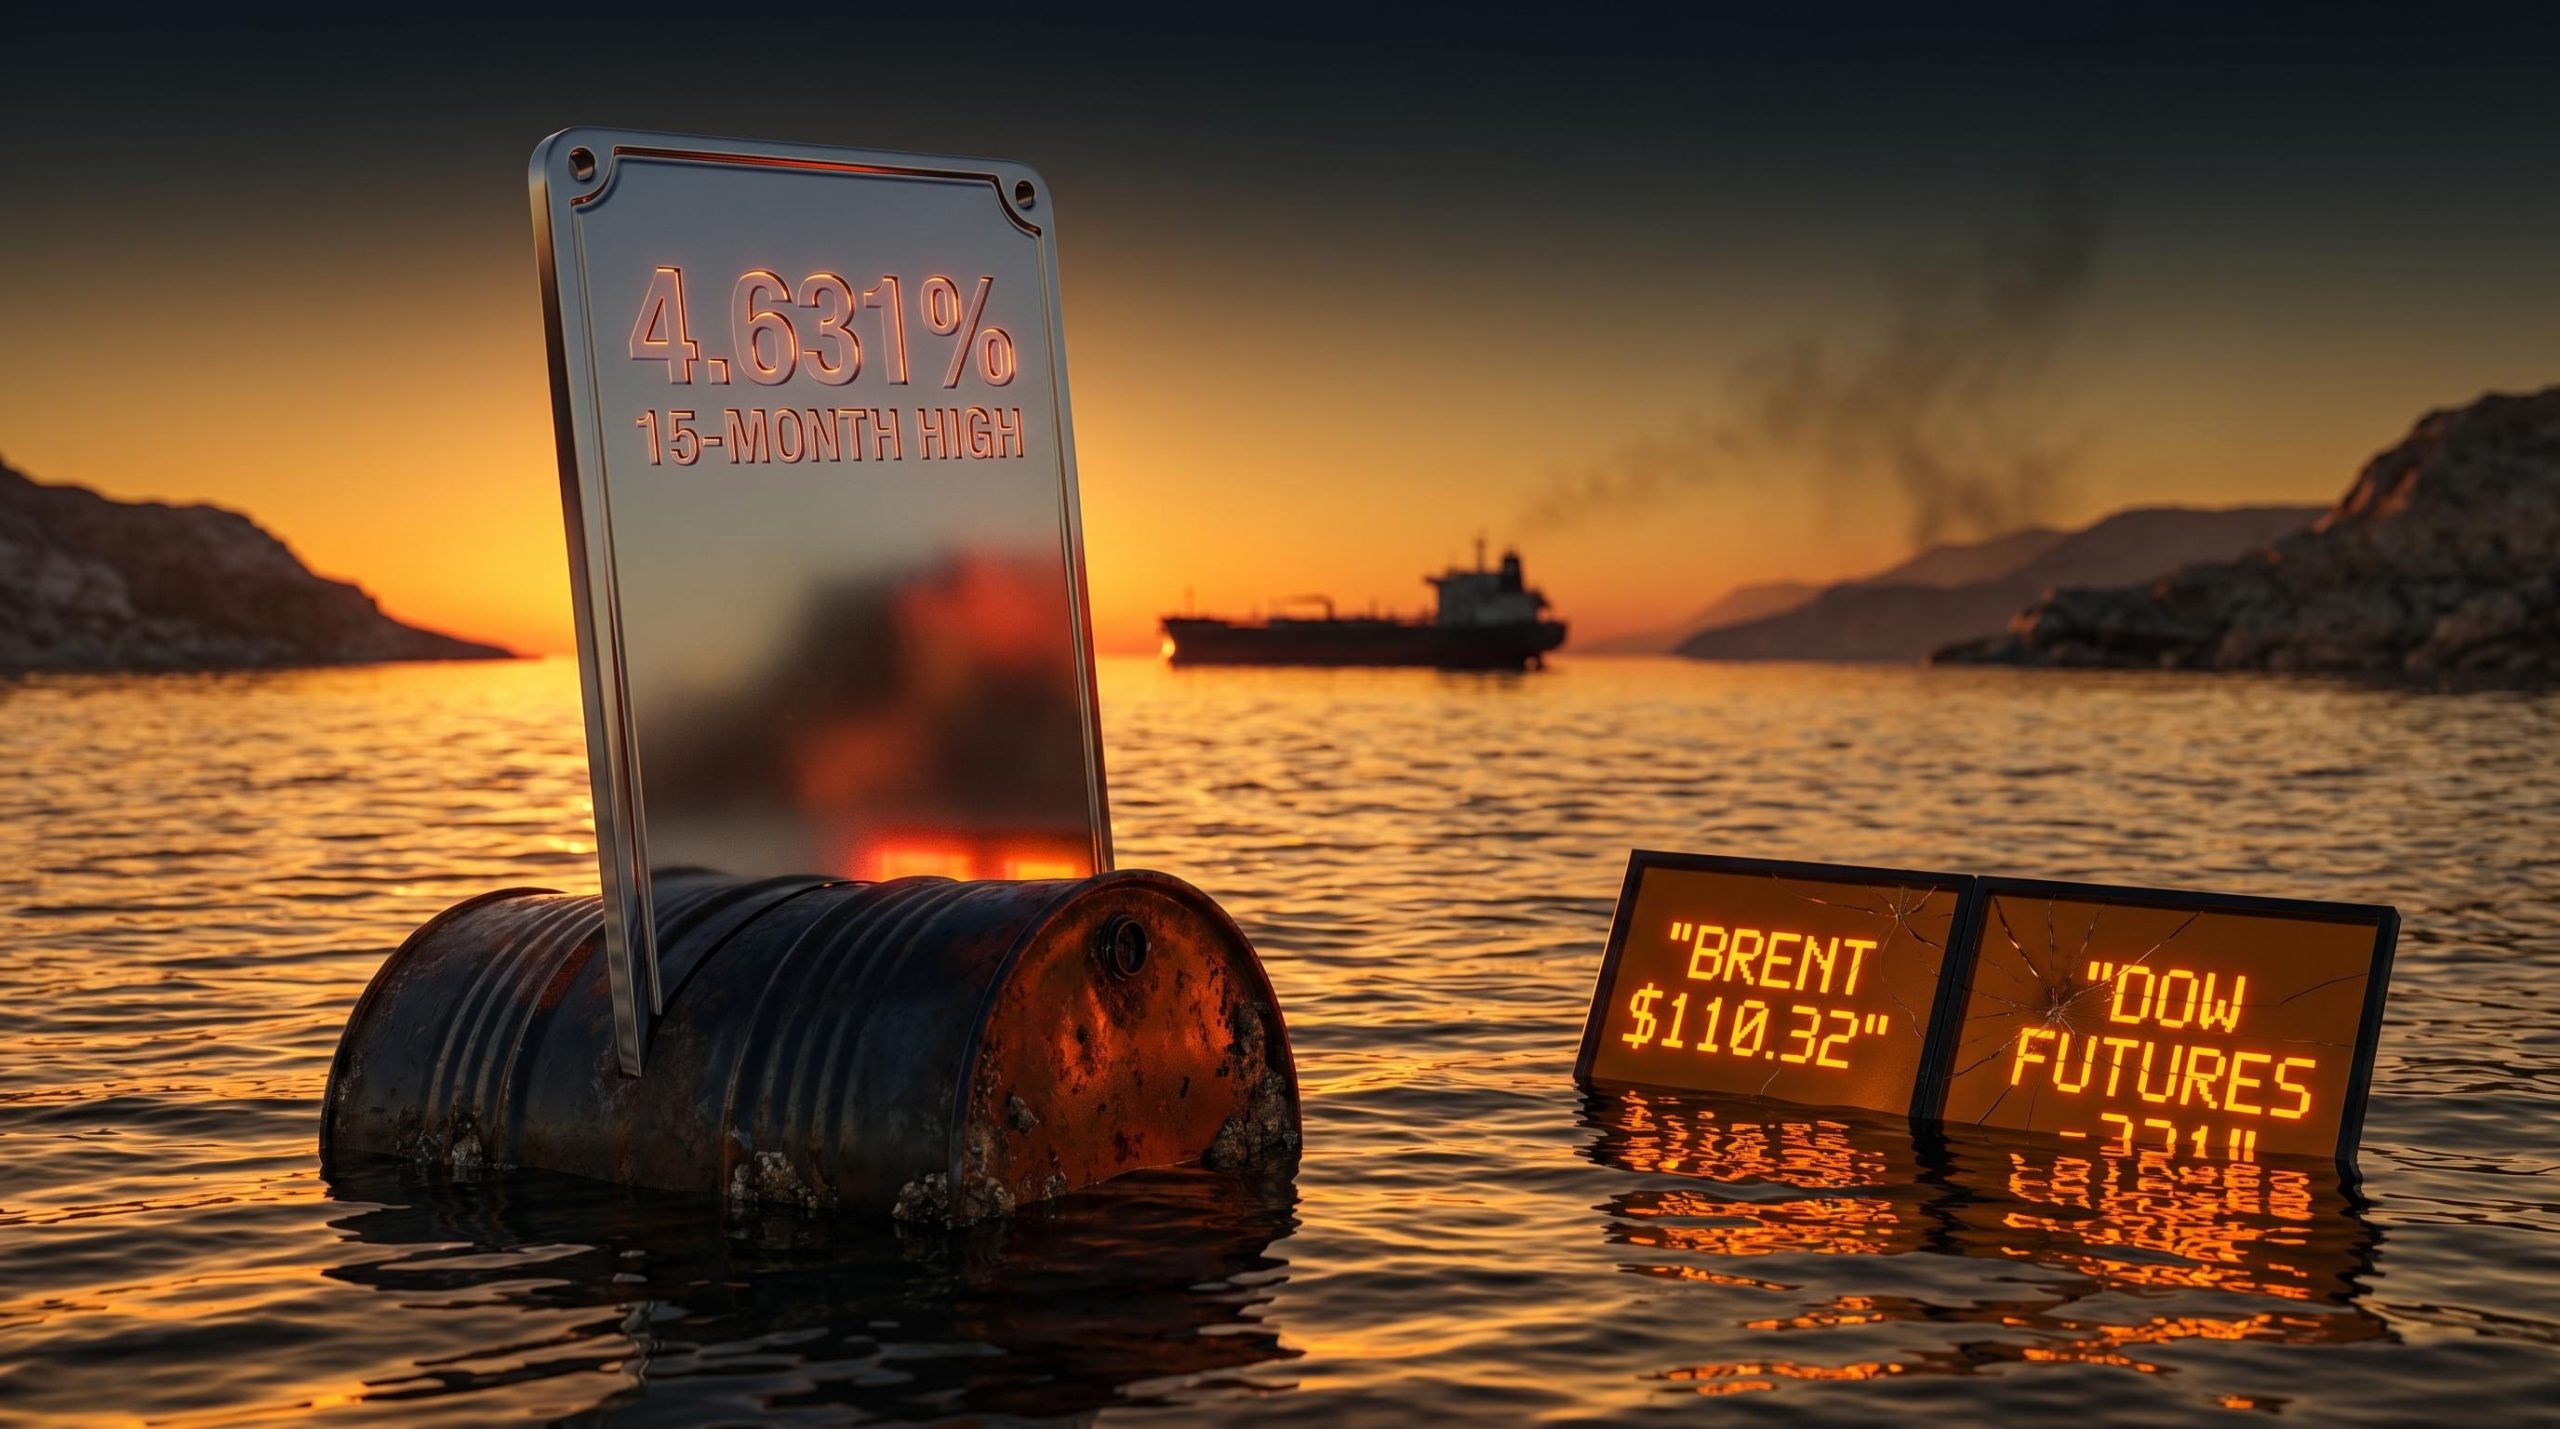
The U.S. 10-year Treasury yield hit a 15-month high on Monday morning as oil crossed $110 a barrel and equity futures pointed to a sharp red open, with Dow futures down 321 points as of 03:28 ET. The proximate cause is not a domestic economic shock or a Federal Reserve meeting surprise. It is a maritime chokepoint roughly 7,000 miles from Wall Street: the Strait of Hormuz, where Iran’s conflict with U.S. and Israeli forces has entered its 80th day with no clear resolution.
A drone strike on a UAE nuclear installation over the weekend, compounded by three intercepted drones in Saudi Arabia, deepened anxiety about a ceasefire already described as fragile. What follows is a step-by-step analysis of how a supply disruption in the Persian Gulf translates into higher borrowing costs for American homeowners, lower valuations for U.S. equities, and an 80% market-implied probability that the Fed will raise rates before 2027. The transmission chain, the portfolio consequences, and the tail risk the market may not yet be pricing are all examined below.
Approximately one-fifth of global oil supply transits a waterway barely 21 miles wide at its narrowest point. When that waterway is functioning, it is an abstraction, a line on a shipping map that most investors never think about. When it is not functioning, every barrel that cannot pass through it reprices the global energy market in real time.
The disruption is more layered than a simple military blockade: what analysts have characterised as the Hormuz triple lock combines active US naval blockade operations, Iranian toll enforcement on non-US and non-Israeli vessels, and the near-total withdrawal of commercial war-risk insurance coverage, meaning a ceasefire announcement alone would not immediately restore commercial transit.
Brent crude traded at $110.32 per barrel as of 03:59 ET on 18 May 2026, up 1.0% intraday. The weekend’s developments made the price move worse. A drone strike hit a UAE nuclear installation, and Saudi air defences intercepted three additional drones, widening the geographic footprint of a conflict now in its 80th day.
Deutsche Bank analysts observed that the ceasefire has now outlasted the initial combat phase of the conflict, a framing that captures the political and military ambiguity precisely: neither war nor peace, just sustained disruption with no definitive endpoint.
President Donald Trump posted on social media that time is running out for Iran but that Tehran appears willing to deal. The market, however, is pricing the physical reality over the diplomatic signal. Oil remains above $110, and tanker routes remain disrupted.
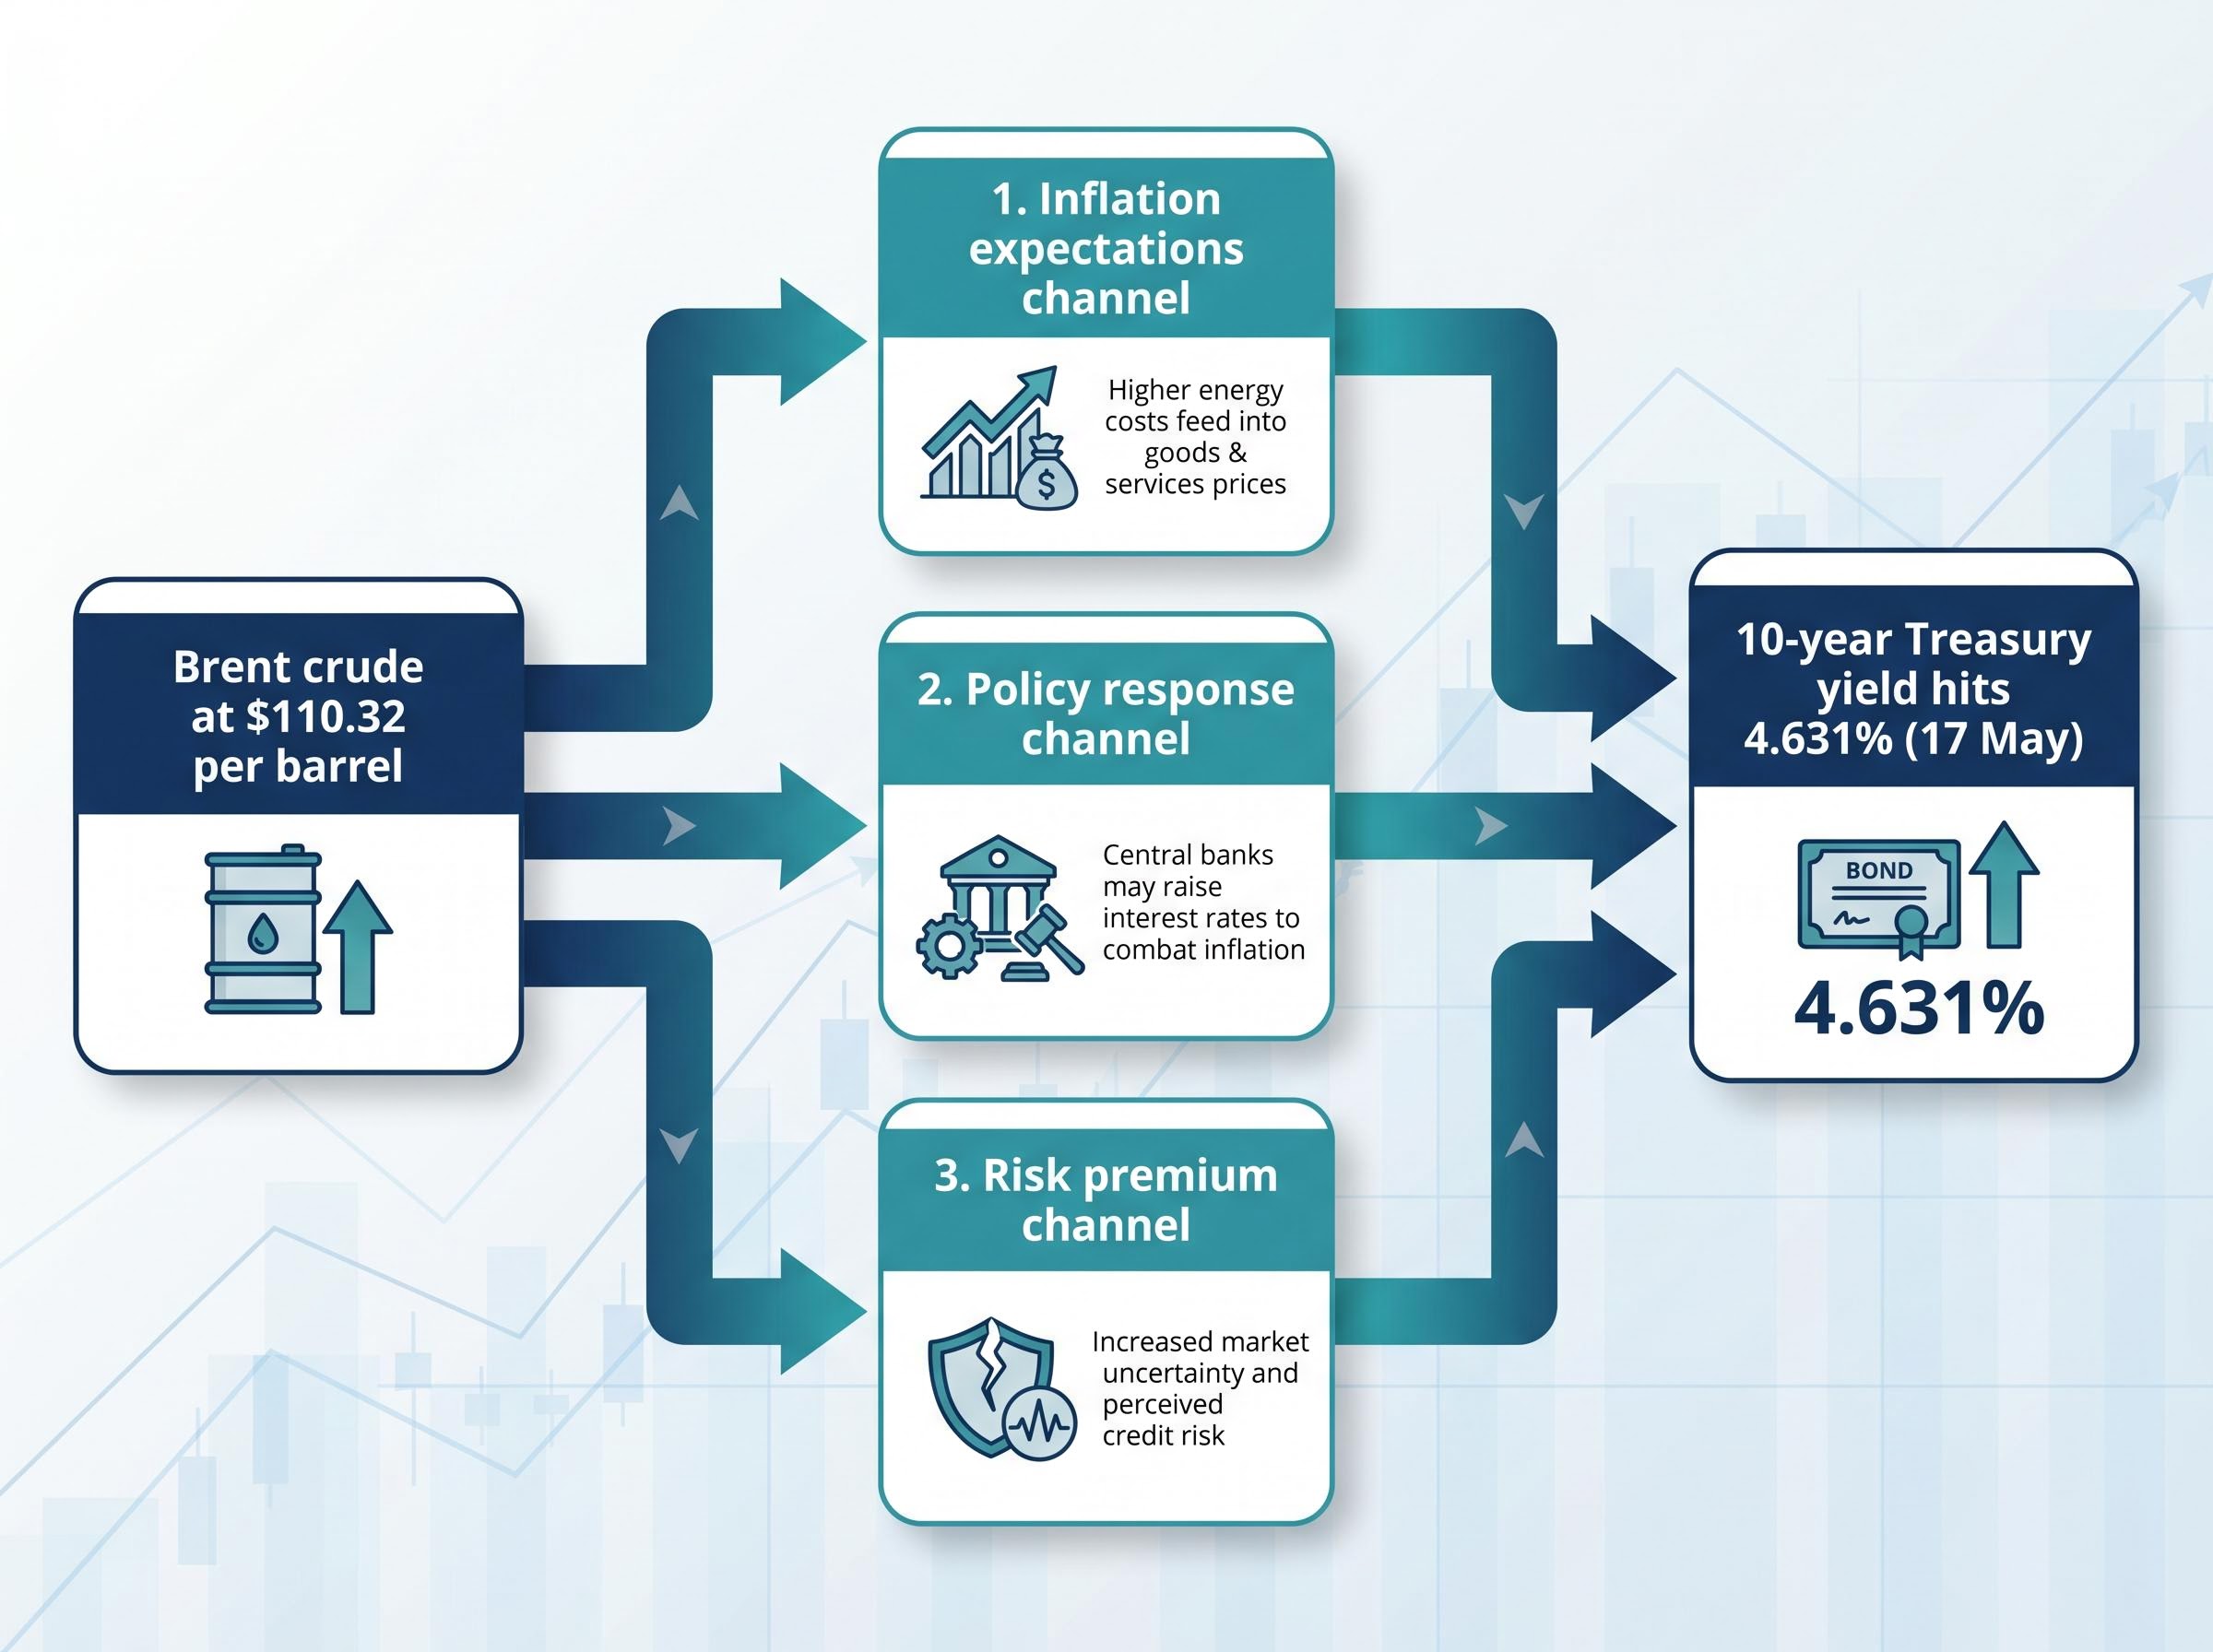
The move from $110 oil to a 15-month high on the 10-year Treasury yield is not arbitrary. It follows a transmission chain with three distinct channels, each reinforcing the others:
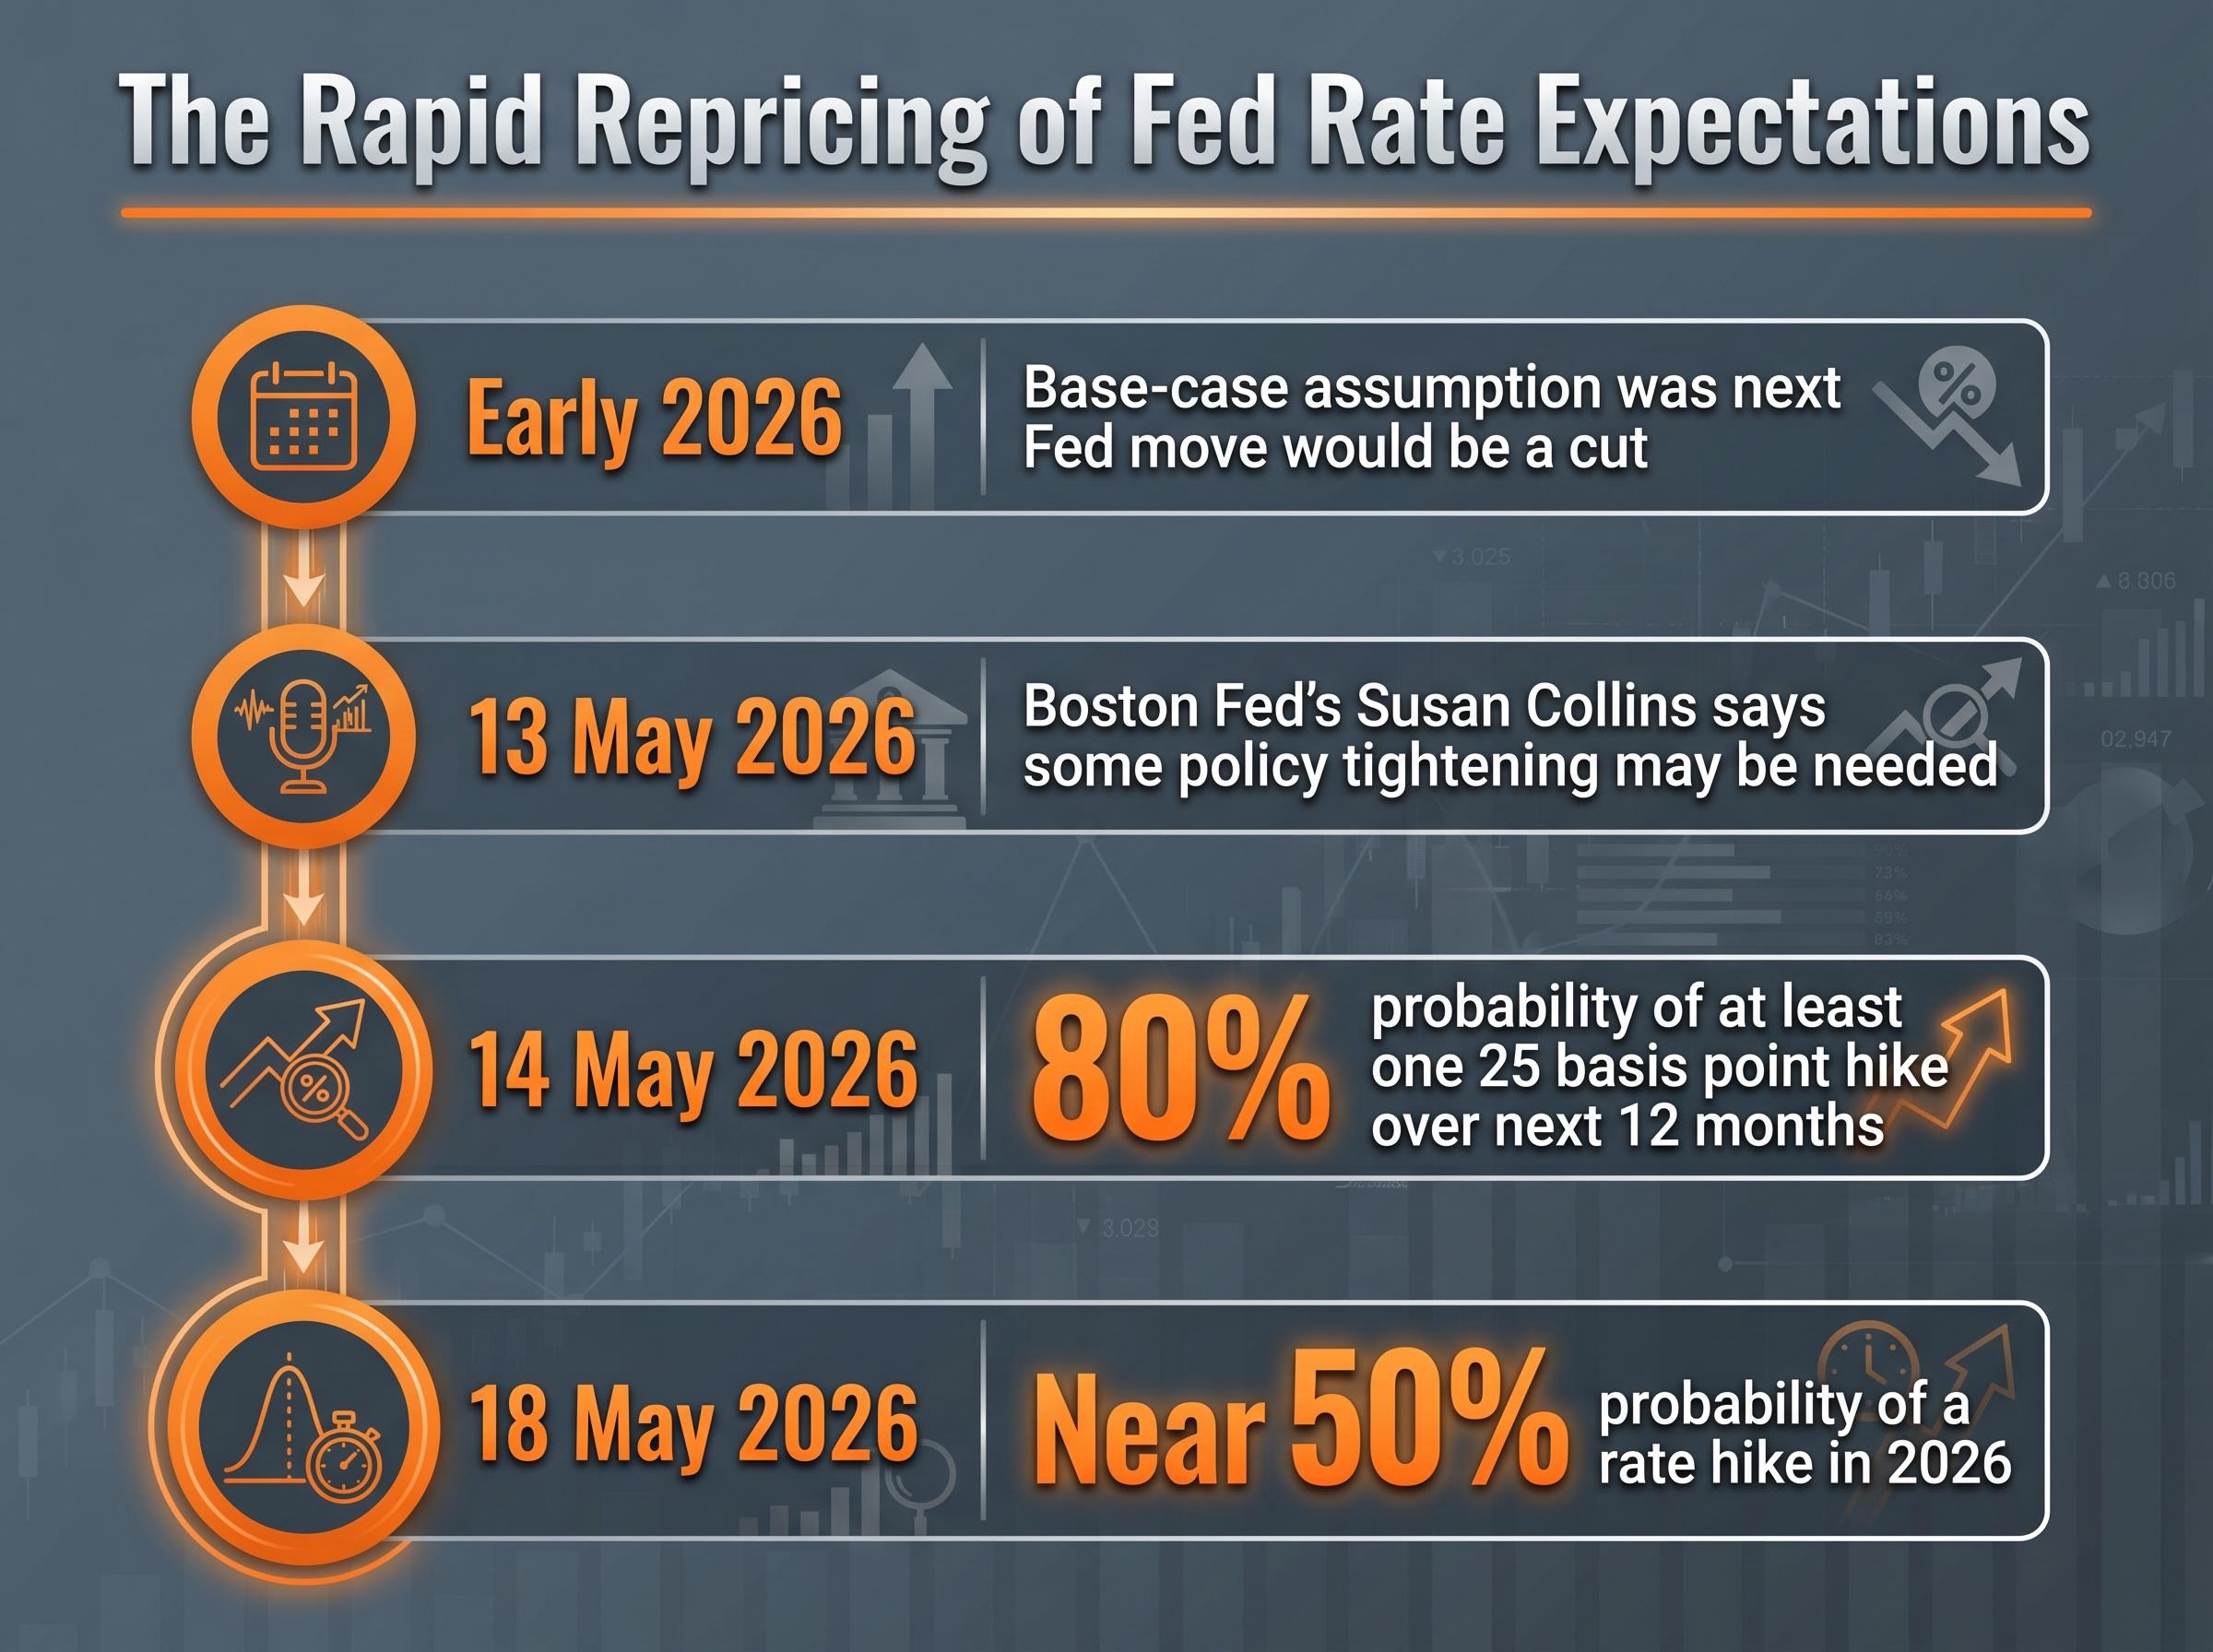
Boston Fed President Susan Collins stated on 13 May 2026 that “some policy tightening may be needed” if energy inflation does not abate, the clearest official confirmation that the policy channel is active.
Analyst estimates on oil price pass-through to core CPI centre on a 40-60% transmission rate over a 3-6 month lag, which means the June and July inflation prints carry considerably more policy weight than the April reading, and the full pressure from $110 crude has not yet appeared in the data the Fed is reacting to.
The speed of the adjustment illustrates all three channels working simultaneously. The 10-year yield moved from 4.47% on 14 May (per FRED data) to an intraday high of 4.631% on 17 May (per CNBC), a meaningful repricing in just three trading days. Reuters reported on 14 May that markets were pricing approximately an 80% probability of at least one 25 basis point Fed hike over the next 12 months.
The transmission mechanism matters because its consequences are concrete, reaching well beyond the bond market itself.
Futures markets on 18 May reflected the pressure clearly:
| Index | Futures Move (Points) | Futures Move (%) | Direction |
|---|---|---|---|
| Dow Jones | -321 | -0.7% | Lower |
| S&P 500 | -32 | -0.4% | Lower |
| Nasdaq 100 | -96 | -0.3% | Lower |
All three major indices had already finished more than 1% lower the preceding Friday. The mechanism is self-reinforcing: higher yields beget lower equity prices, which can trigger further risk-off selling, feeding back into demand for safe-haven assets and complicating the yield picture further.
The repricing has been swift. As recently as early 2026, the base-case assumption was that the next Fed move would be a cut. By 14 May, Reuters reported an 80% probability of at least one 25 basis point hike over the next 12 months. ING-cited market pricing as of 18 May placed the probability of a rate hike in 2026 at near 50%.
That shift is not merely a consequence of the yield move; it is a driver. When markets reprice the Fed’s rate path, the term premium on longer-dated Treasuries rises in anticipation, pushing yields higher before any policy action occurs.
The Fed’s bind is genuine. Energy-driven inflation is cost-push rather than demand-pull. Rate hikes suppress demand, but they do nothing to reopen the Strait of Hormuz or restore disrupted tanker routes. Raising rates into a supply shock risks slowing the economy without addressing the source of inflation.
Allowing inflation expectations to become unanchored, however, carries its own danger.
Reuters reported on 14 May that the Fed may need to hike to defend its inflation-fighting credibility, framing the choice as one where inaction itself becomes a risk to the institution’s mandate.
The FOMC’s April 2026 statement acknowledged that inflation was elevated in part due to rising global energy prices and cited Middle East developments as a source of significant uncertainty, establishing the official policy record against which Collins’s subsequent tightening signal should be read.
Collins’s 13 May statement reinforced that framing. The political dimension adds further pressure: sharply higher petrol prices ahead of November midterm elections increase scrutiny on both the Fed and the White House, narrowing the window for patience.
The uncertainty itself is the destabilising variable. Duration risk in a standard 60/40 portfolio is no longer well-hedged by the historical inverse correlation between equities and Treasuries when both asset classes face simultaneous selling pressure.
Warsh’s approach to the rate path adds a further layer of uncertainty: his expected acceleration of balance sheet runoff to $100 billion per month represents a form of tightening that operates independently of rate decisions, putting additional upward pressure on yields even if the FOMC holds the federal funds rate steady.
The move from 4.47% to 4.631% on the 10-year yield over three trading days illustrates the mark-to-market losses accumulating in long-duration bond portfolios. For investors holding bonds with maturities beyond 10 years, even modest yield increases translate into meaningful principal declines.
| Asset Class | Direction of Pressure | Instrument / Proxy | Key Risk |
|---|---|---|---|
| Duration / Long bonds | Negative (mark-to-market losses) | Long-duration Treasuries | Further yield increases if oil rises or Fed hikes |
| Rate-sensitive equities | Negative (valuation compression) | Utilities, REITs, long-duration growth | Discount-rate sensitivity amplified at current yield levels |
| Energy sector equities | Positive (revenue tailwind) | Energy ETFs, integrated oil majors | Ceasefire or demand destruction reverses the trade |
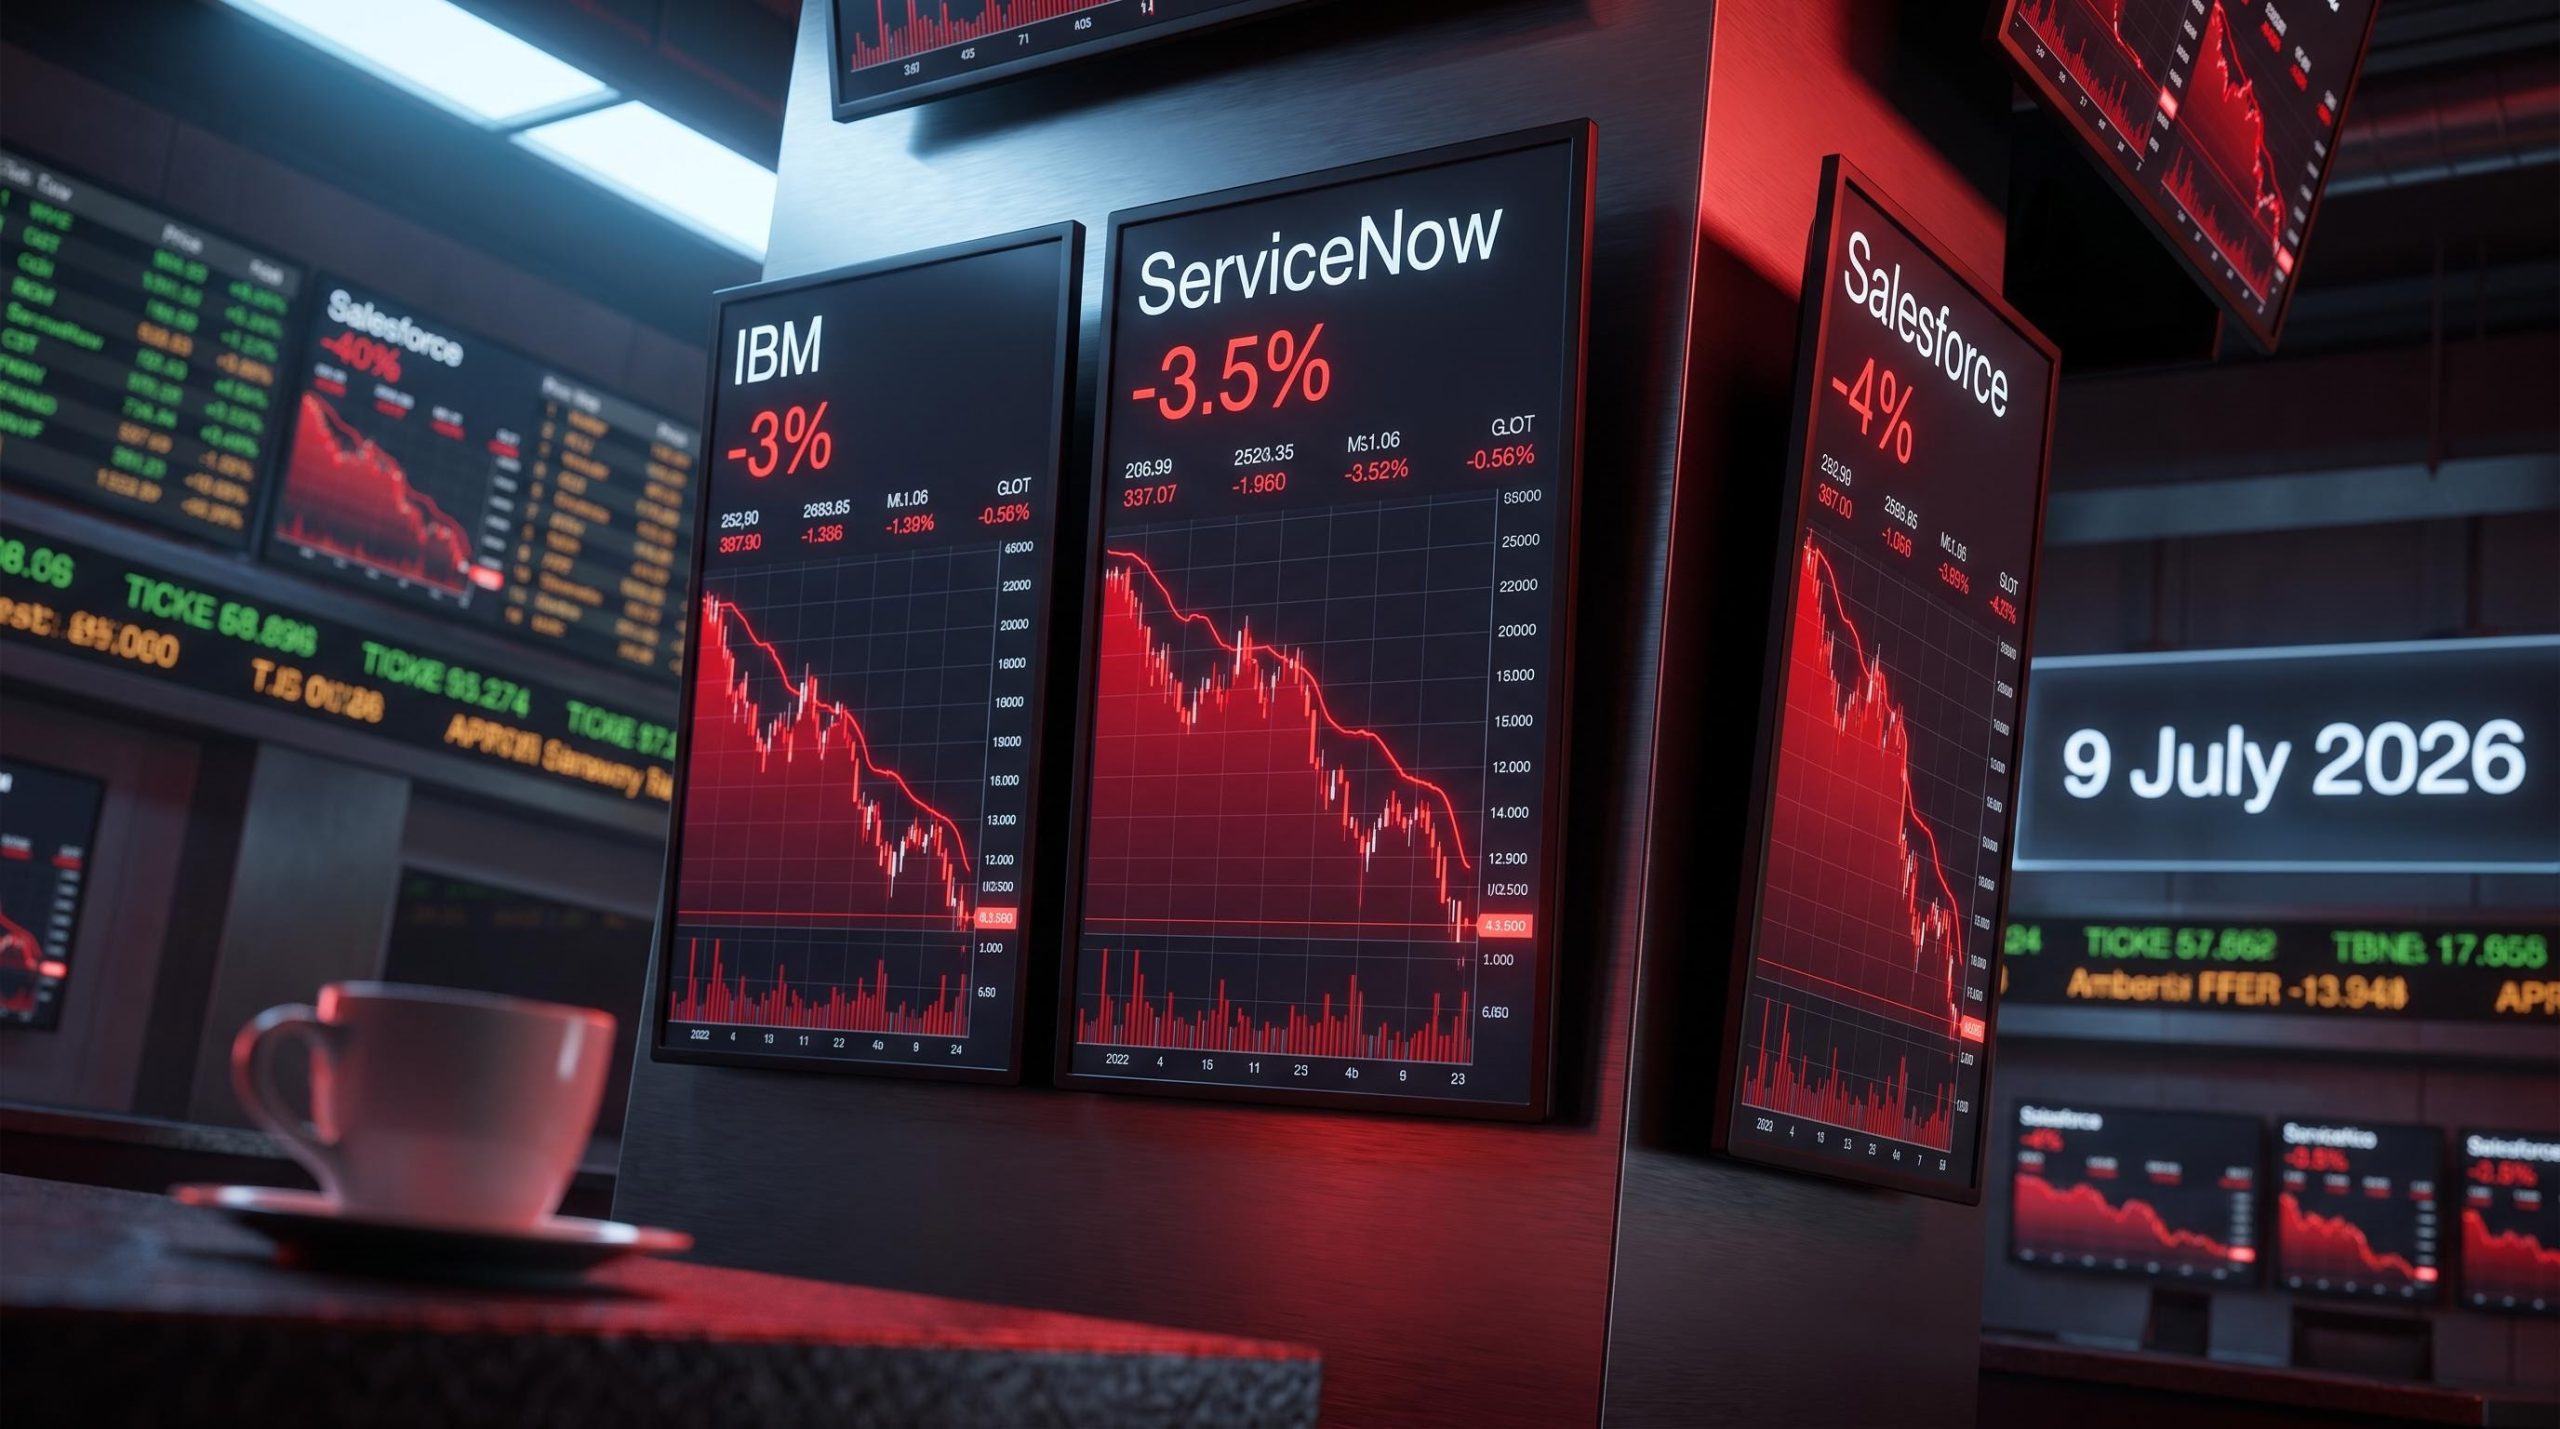
The sector rotation logic is straightforward: energy outperformance versus rate-sensitive sectors is the standard positioning in a rising-yield, elevated-crude environment. Nvidia, down 4.42% to $225.32 on 18 May, illustrates the pressure on AI-heavy, long-duration growth names, even as broader AI investment optimism has partially cushioned the S&P 500, which remains above pre-conflict levels.
Three instrument categories warrant consideration in this environment:
This article is for informational purposes only and should not be considered financial advice. Investors should conduct their own research and consult with financial professionals before making investment decisions. Past performance does not guarantee future results.
Current market pricing reflects a base case of sustained but stable disruption. Oil at $110-$111 per barrel, yields near 4.60%, and equities down but not in freefall all suggest investors have absorbed the initial shock and positioned around it. The base case is priced. The tail risk is not.
A ceasefire breakdown or geographic widening of the conflict would represent an unpriced shock. Brent at $110.85-$111.32 is already elevated; further escalation from this base would compound the inflation channel, accelerate the Fed repricing, and put yields on a trajectory toward 5%, a level that would meaningfully alter the calculus for mortgage markets, corporate issuance, and equity valuations.
The weekend’s events signal that the conflict’s geographic footprint is expanding, not contracting. Drone strikes reached a UAE nuclear installation. Saudi air defences intercepted three separate attacks. These are not signs of a conflict winding down.
ING characterised the bond selloff as “the single most consequential story across global financial markets,” a framing that underscores the breadth of the pressure.
The global yield selloff is not a U.S.-only phenomenon. European and Asian sovereign yields have also risen, meaning a U.S. investor’s foreign bond allocation does not function as a safe haven in this environment.
The synchronised global bond selloff extends well beyond US Treasuries, with the UK 30-year gilt hitting a 28-year high and Japan’s 30-year JGB touching a record, meaning the traditional portfolio logic of offsetting domestic bond losses with foreign fixed income exposure is not functioning in this environment.
The chain is integrated, not sequential. Hormuz disruption sustains elevated oil. Elevated oil feeds inflation expectations. Inflation expectations force a Fed repricing. The Fed repricing lifts yields. Higher yields compress equity valuations. And the equity selloff reinforces the risk-off sentiment that feeds back into geopolitical anxiety. These are not separate stories. They are one feedback loop.
The near-term catalysts that will either accelerate or interrupt the current dynamic are specific and identifiable:
The analytical posture is clear. The Strait of Hormuz is now a leading indicator for bond markets. Until the physical supply disruption resolves, rising Treasury yields remain the financial expression of a geopolitical crisis that has no confirmed end date.
These statements are speculative and subject to change based on market developments and geopolitical conditions.
Rising oil prices push up inflation expectations, which leads bondholders to demand higher yields as compensation for eroded real returns. The Federal Reserve may also respond by tightening policy, further lifting yields across the curve before any actual rate decision is made.
Higher Treasury yields increase the discount rate applied to future corporate earnings, reducing the present value of stocks. The effect is most pronounced in long-duration growth equities, where more expected cash flows sit further in the future, as seen with Nvidia falling 4.42% on 18 May 2026.
The Strait of Hormuz is a waterway barely 21 miles wide at its narrowest point through which approximately one-fifth of global oil supply transits. Disruptions to it directly affect global energy prices, inflation expectations, central bank policy, and ultimately sovereign bond yields and equity valuations worldwide.
Short-duration bonds reduce mark-to-market exposure to further yield increases, Treasury Inflation-Protected Securities (TIPS) adjust their principal based on inflation making them relevant in energy-driven inflation environments, and energy sector equities offer direct exposure to the supply-disruption tailwind.
Investors should monitor ceasefire developments in the Iran conflict as any diplomatic progress could rapidly compress oil prices, upcoming CPI data to gauge how energy costs are flowing through to core inflation, and major corporate earnings such as Nvidia's results as a test of whether AI investment optimism can hold under yield pressure.