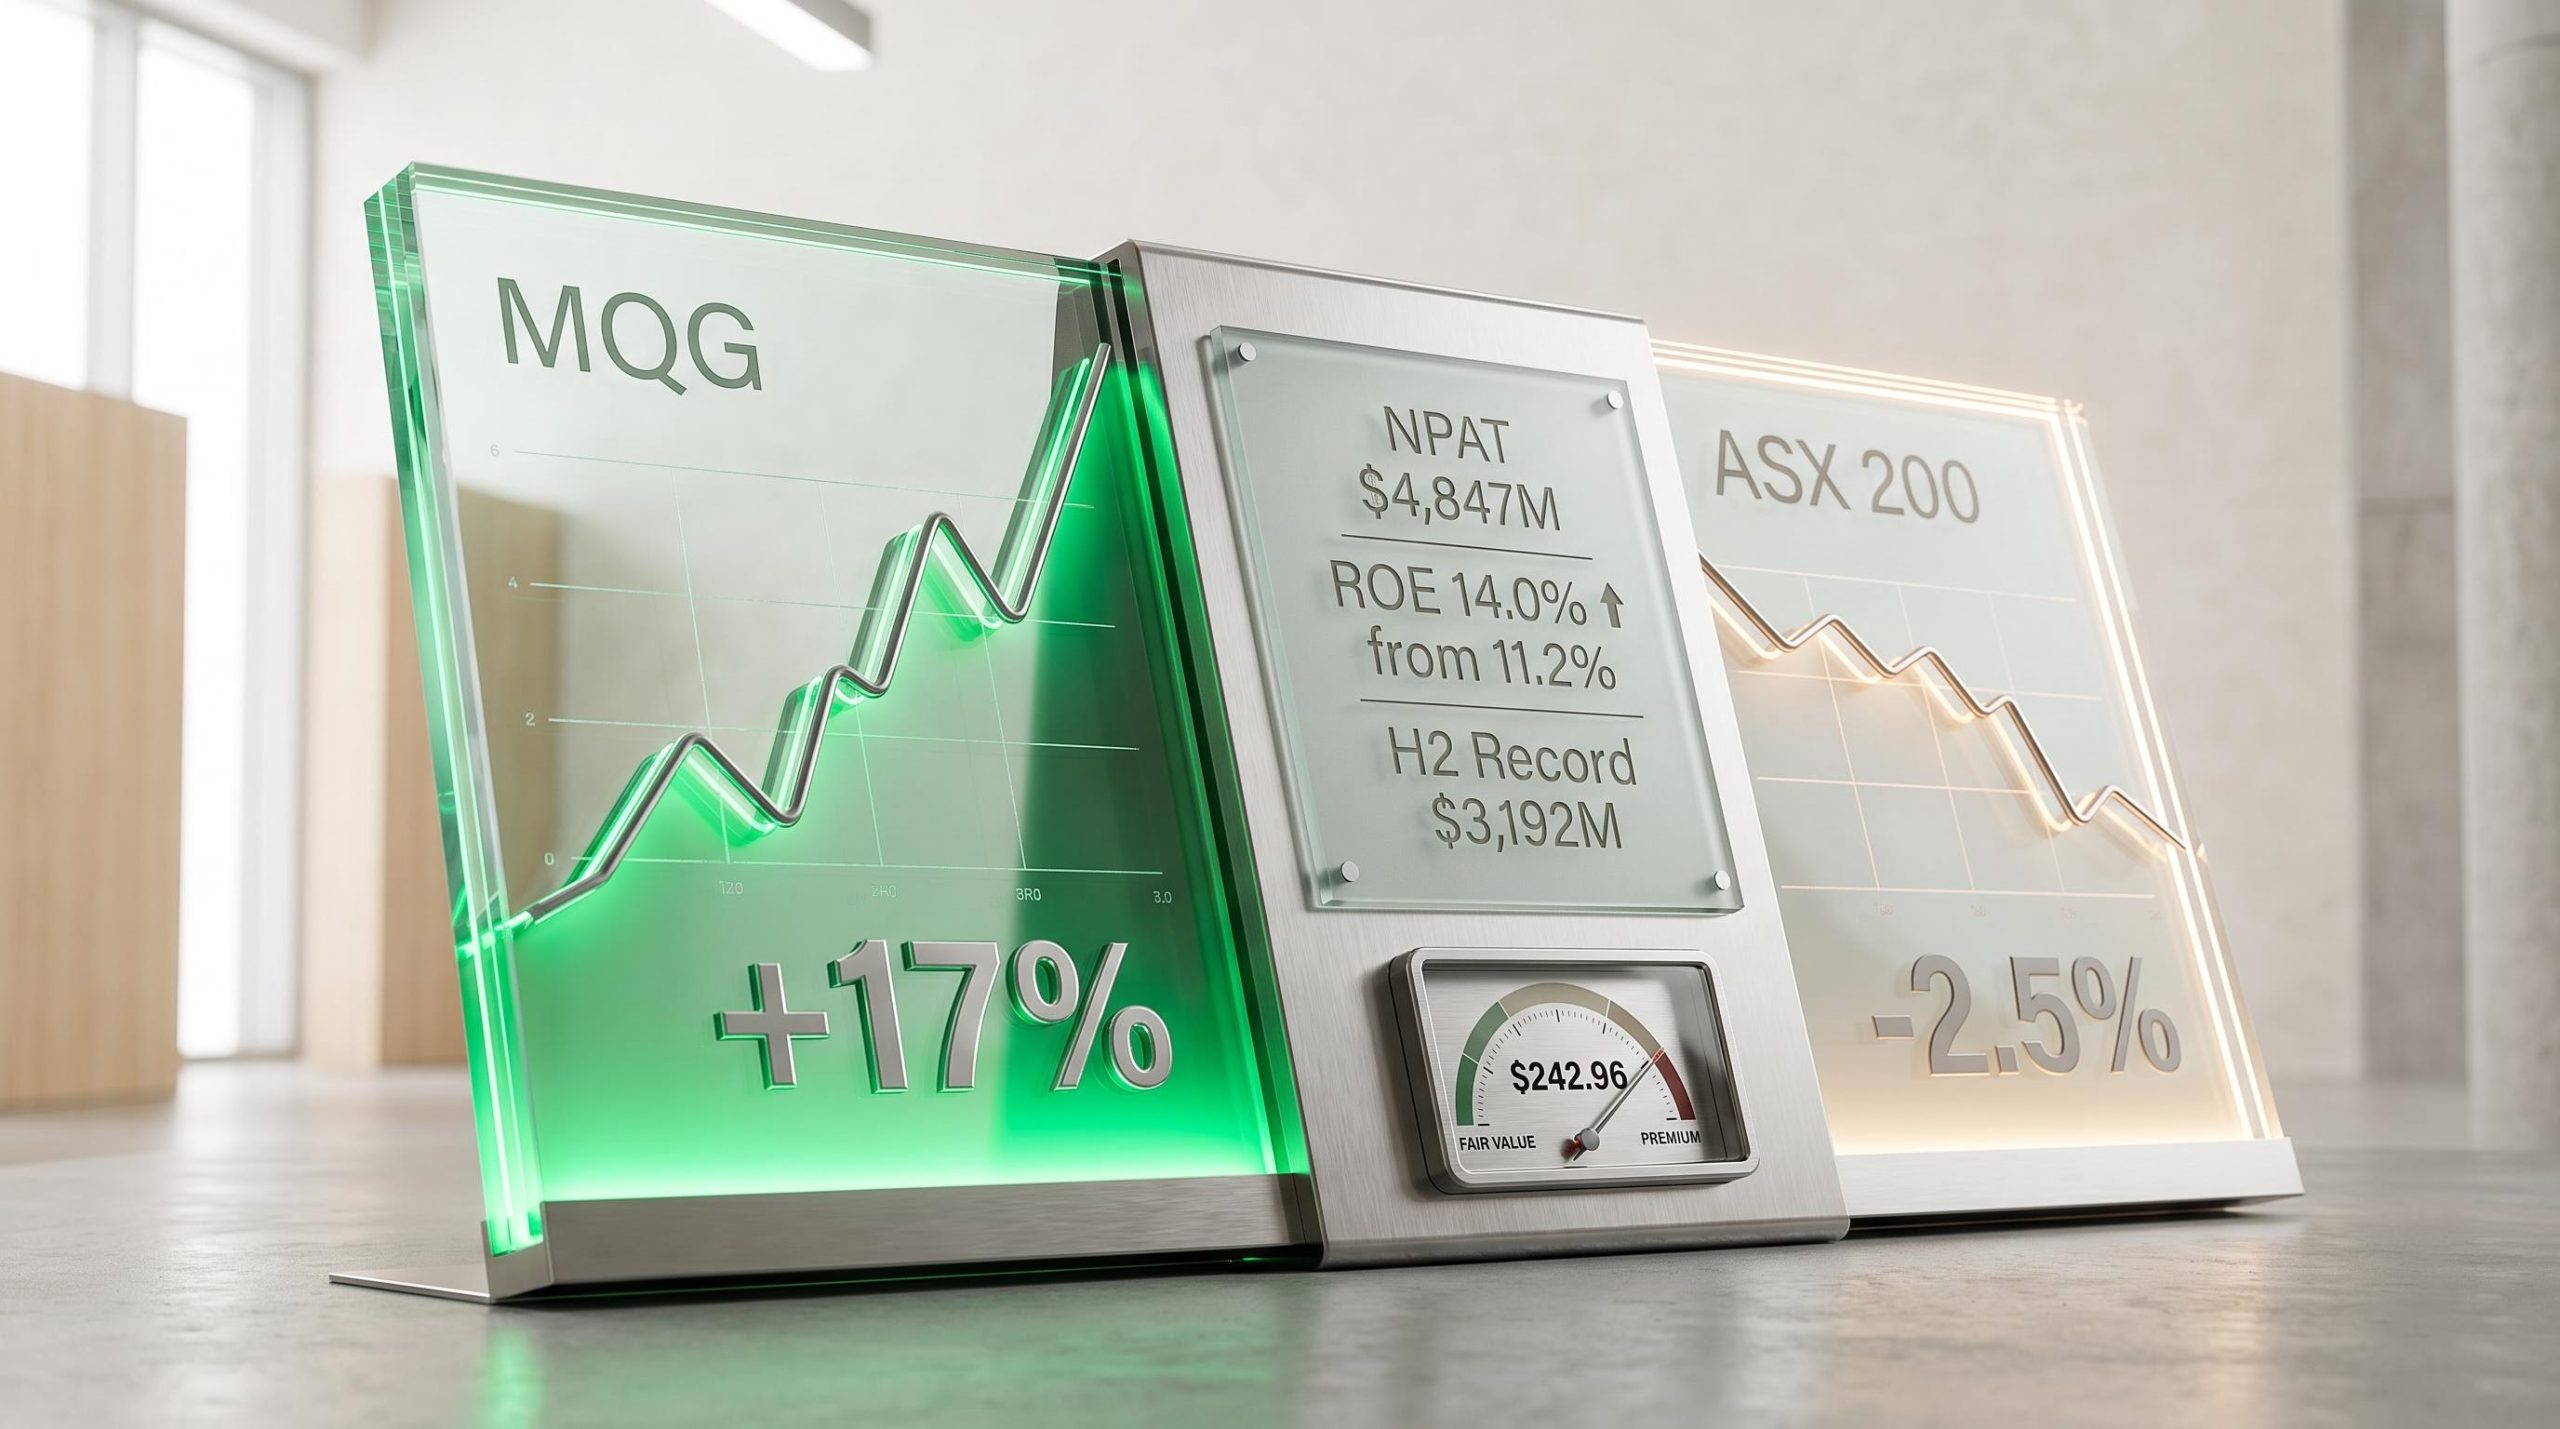
Macquarie Group’s share price has climbed approximately 17% since January 2026, while the ASX 200 has fallen roughly 2.5% over the same period. That divergence demands an explanation, and the FY26 result provides one. On 8 May 2026, Macquarie reported full-year net profit after tax (NPAT) of $4,847 million, a 30% year-on-year increase, with the second half alone generating $3,192 million, a record for any single half-year in the group’s history. The stock went ex-dividend in mid-May, stripping out a $4.20 final dividend, which briefly masked the result’s positive reception in the trading price. What follows is a breakdown of the headline numbers, the dividend mechanics, the business model driving the outperformance, and what the fundamentals signal about MQG’s valuation relative to its current price of $242.96.
ASX 200 index construction concentrates more than 50% of the index by market-cap weight in financials and materials, which means the benchmark’s roughly 2.5% decline since January 2026 reflects sector-specific pressure rather than broad economic deterioration, and MQG’s 17% outperformance is partly a consequence of its earnings profile being structurally different from the domestic lenders and resource companies that anchor the index.
What Macquarie’s 30% profit jump actually reveals about its earnings quality
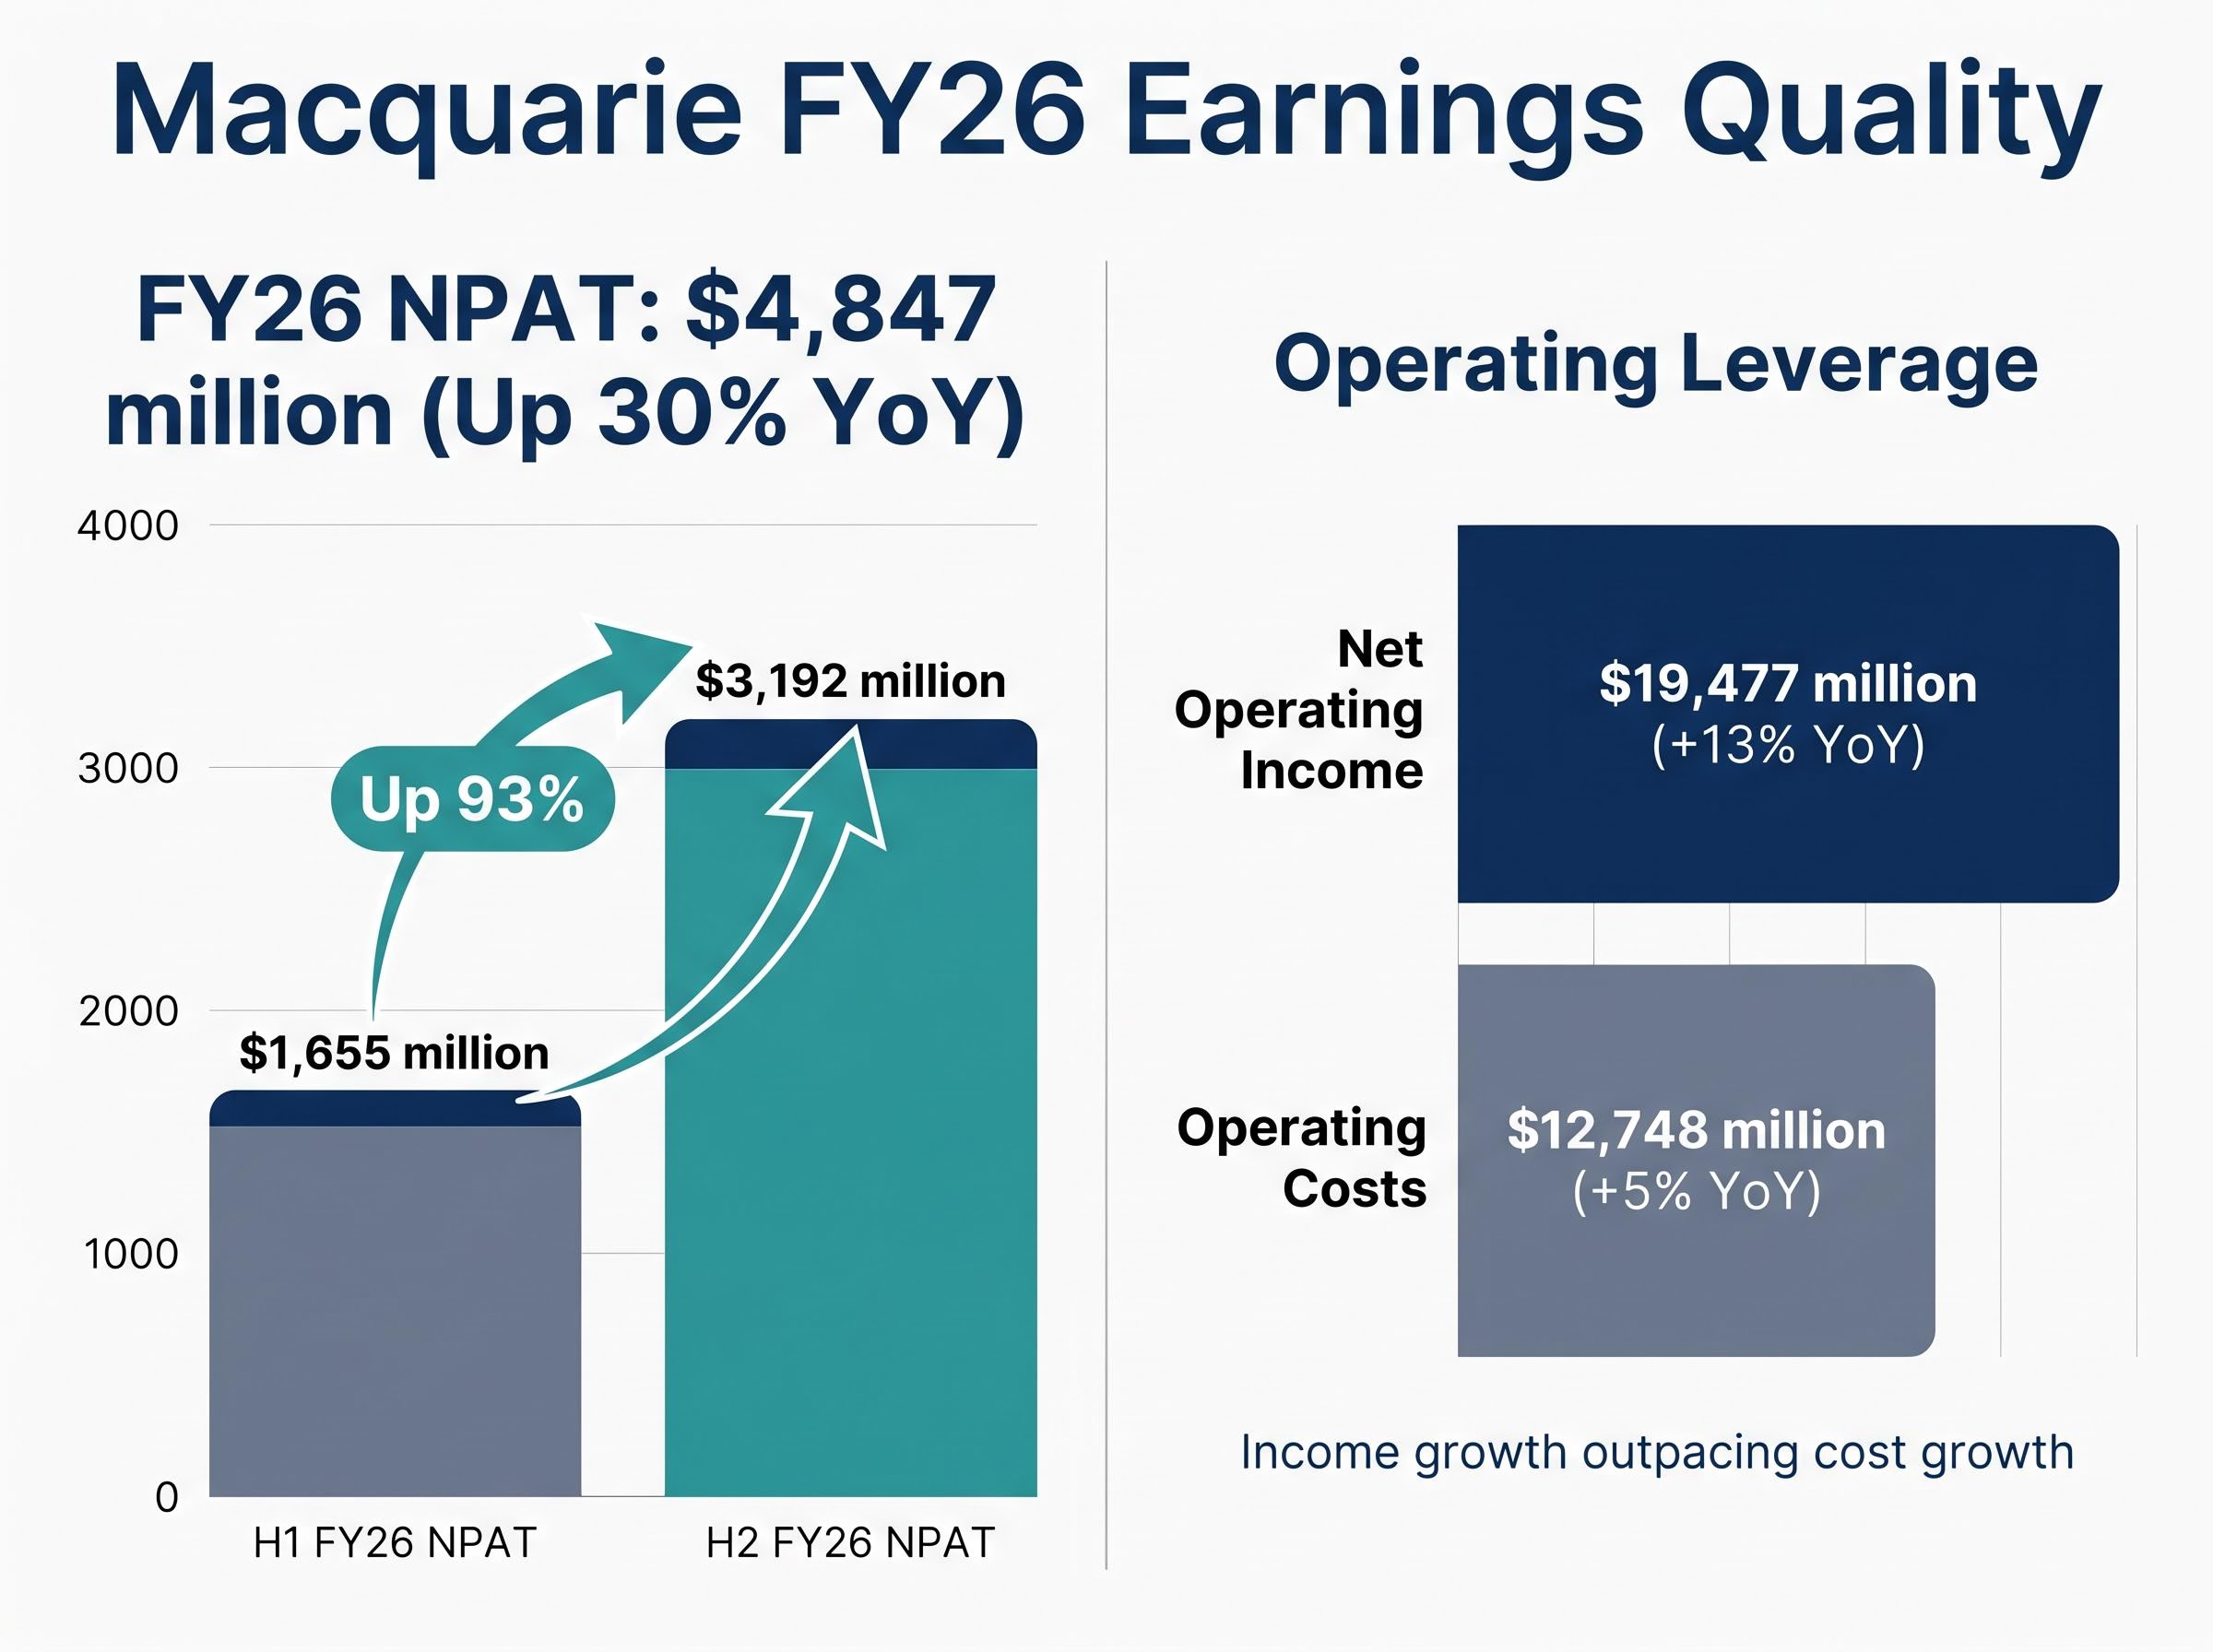
The headline is strong: FY26 NPAT of $4,847 million, up 30% year on year. Earnings per share rose to $12.77, also up 30%. Net operating income reached $19,477 million, a 13% increase. But the number that matters most sits inside the half-year split.
H2 FY26 NPAT of $3,192 million was 93% higher than H1, which produced just $1,655 million. That is not a rounding error or seasonal variation; it represents a pronounced acceleration through the fiscal year.
H2 FY26 NPAT of $3,192 million set a record for any half-year period in Macquarie’s history.
The five core metrics from the result tell a consistent story:
- FY26 NPAT: $4,847 million, up 30% YoY
- H2 FY26 NPAT: $3,192 million, record half-year, up 93% versus H1
- Net operating income: $19,477 million, up 13% YoY
- EPS: $12.77, up 30% YoY
- Operating costs: $12,748 million, up 5% YoY
That final line is where earnings quality becomes visible. Revenue grew at 13% while costs rose only 5%, indicating positive operating leverage rather than profit growth bought through margin compression. For investors assessing whether this result carries momentum into FY27 or represents a peak, the H2 acceleration and cost discipline together suggest the former.
When big ASX news breaks, our subscribers know first
How Macquarie’s business model actually generates these returns
Macquarie is frequently compared to Commonwealth Bank or ANZ, but the comparison obscures more than it clarifies. Where domestic banks generate most of their earnings from lending margins on Australian mortgages and deposits, Macquarie operates four distinct business segments, each with its own earnings characteristics.
| Segment | Primary Earnings Driver | Key FY26 Indicator |
|---|---|---|
| Commodities and Global Markets (CGM) | Trading and risk management revenue, sensitive to market volatility | Not separately disclosed |
| Macquarie Asset Management (MAM) | Base fees from AUM, performance fees, real asset realisations | AUM: $722.1 billion (+8% YoY) |
| Banking and Financial Services (BFS) | Loan growth and deposit momentum | Not separately disclosed |
| Macquarie Capital | Advisory fees and principal realisations, deal-volume dependent | Not separately disclosed |
MAM’s assets under management (AUM), the total value of investments the division manages on behalf of clients, reached $722.1 billion as at 31 March 2026, up 8% year on year. That figure matters because AUM scale translates directly to recurring base fee income, providing a more predictable revenue layer than CGM’s trading-driven earnings.
Why 68% international revenue matters for MQG’s earnings profile
68% of Macquarie’s FY26 total income was generated outside Australia. Global commodity markets, cross-border infrastructure deal flow, and international asset management create earnings diversification that no domestic-focused bank can replicate. That breadth is a structural advantage, but it also introduces foreign exchange sensitivity and geopolitical exposure. Disruptions such as the Strait of Hormuz tensions affecting commodity market activity feed directly into CGM’s earnings, for better or worse.
The ROE re-rating: why 14% changes the valuation conversation
Return on equity (ROE) measures how much profit a company generates relative to shareholder equity, and it is the primary metric sophisticated investors use to assess whether a premium valuation is warranted. A bank compounding equity at 14% supports a materially higher price-to-book multiple than one generating 11%.
ROE across the Big Four provides the benchmark against which Macquarie’s 14.0% figure should be read: CBA leads domestic peers at 13.6%, while NAB sits at 11.4% and ANZ trails at 10.0%, meaning Macquarie’s FY26 return on equity now exceeds every major Australian bank on this metric, a structural shift that carries direct implications for relative valuation multiples.
ROE improved to 14.0% in FY26, up from 11.2% in FY25, a result open-market commentary described as a positive surprise relative to consensus expectations.
That 280 basis point improvement was the single largest fundamental shift in the FY26 result. Open-web commentary characterised it as ahead of expectations, with references to incoming broker target upgrades, though specific numerical targets remain unavailable in publicly accessible sources.
The share price performance reflects the re-rating in real time:
- MQG: up approximately 17% year to date
- ASX 200: down approximately 2.5% year to date
Connecting the two is not a stretch. ROE is the bridge between raw profit and valuation; a business delivering 14% return on equity sustainably commands a higher price than one at 11.2%. The FY26 data point shifted the fundamental case for MQG in a way that earnings per share alone did not.
Dividend mechanics: what the $7.00 full-year payout means for yield-focused investors
For readers who noticed MQG’s share price drop in mid-May and arrived here looking for an explanation: the ex-dividend date is the answer. Once a stock goes ex-dividend, the share price typically adjusts downward by approximately the dividend amount, because new buyers from that date are no longer entitled to the payment.
The ex-dividend price mechanics that briefly obscured MQG’s positive result reception follow a consistent pattern across ASX-listed stocks: the share price adjusts downward by approximately the dividend amount on the ex-dividend date, leaving the total wealth position of existing holders unchanged before tax, while new buyers from that date forward are simply not entitled to the payment.
On ex-dividend day, MQG traded at $237.68, down 0.46%, against the ASX 200’s decline of 1.2%. Macquarie was one of 16 ASX-listed companies going ex-dividend that week.
The full dividend picture:
| Dividend Component | Amount | Franking | Payment Date |
|---|---|---|---|
| Interim Dividend | $2.80 | 45% | Paid |
| Final Dividend | $4.20 | 35% | 2 July 2026 |
| FY26 Total | $7.00 | Blended | — |
The trailing yield calculation works as follows:
- Total annual dividend: $7.00 per share
- Prevailing share price: approximately $237.68 (ex-dividend day)
- Resulting yield: approximately 2.95%
The 35% franking on the final dividend is lower than the 100% franking typical of domestic banks because a significant portion of Macquarie’s income is earned internationally and is not subject to Australian corporate tax. For income-focused investors, the 2.95% yield is modest relative to domestic bank alternatives, but the combination of partial franking, 30% earnings growth, and 17% capital appreciation year to date tells a fuller story than the yield figure alone.
What the buyback’s timing and conclusion reveal about management’s capital priorities
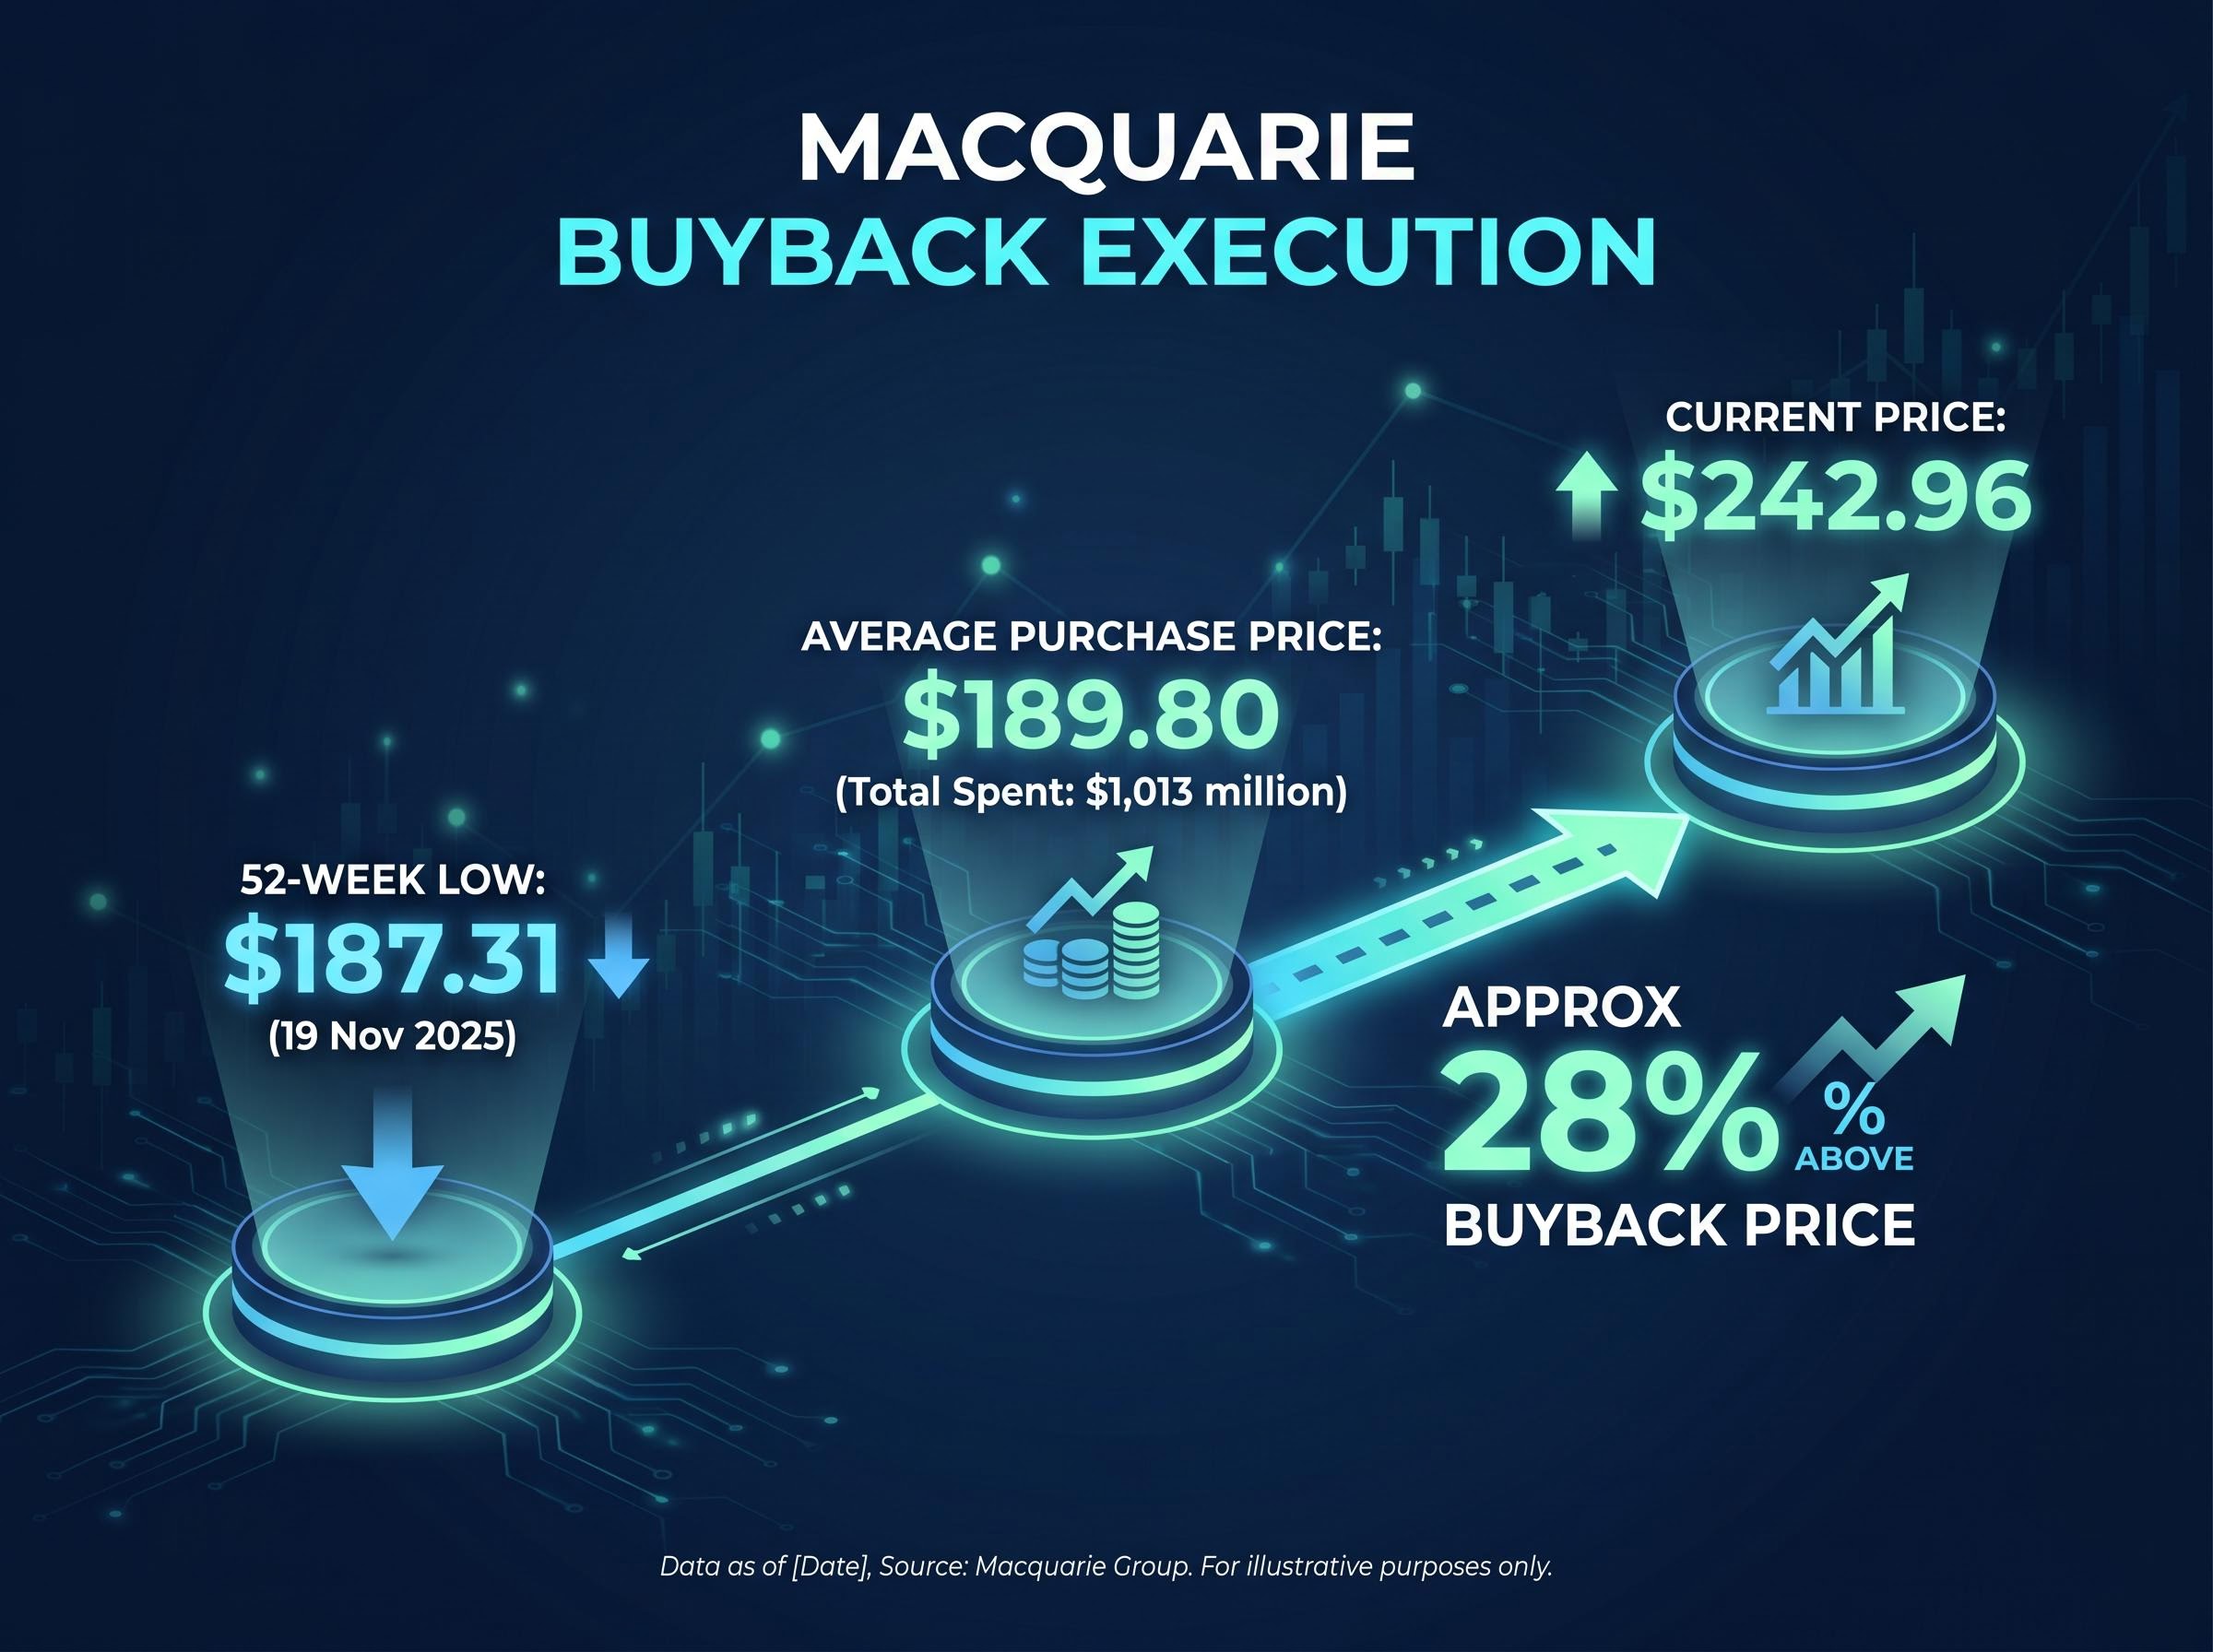
Macquarie completed its on-market buyback programme having repurchased $1,013 million of its own shares at an average price of $189.80. Against the current trading price of $242.96, that represents execution at approximately a 22% discount.
Macquarie repurchased $1,013 million of its own stock at an average price of $189.80, approximately 22% below its mid-May 2026 trading level.
The timing is instructive. MQG hit a 52-week low of $187.31 on 19 November 2025, close to where the bulk of buyback purchases were concentrated. The board approved an extension in November 2025, but management declined to exercise it, citing strong business growth and market conditions.
- Total spent: $1,013 million
- Average purchase price: $189.80 per share
- Current price: $242.96, approximately 28% above the average buyback price
The decision not to extend the buyback as the share price recovered is consistent capital allocation logic: buy at a discount, stop buying at fair-to-full value, redeploy capital into a business generating 14% ROE. It provides a secondary lens on management quality beyond the headline profit figure.
MQG at $243: does the fundamental case still hold at current prices?
The bull case at current prices
- ROE re-rated to 14.0%, up from 11.2%, supporting a premium valuation relative to domestic bank peers
- Record H2 NPAT of $3,192 million creates favourable base momentum entering FY27
- MAM AUM grew 8% to $722.1 billion, supporting recurring fee income growth
- Capital allocation discipline demonstrated through the buyback programme’s timing and completion
Risks and valuation considerations to weigh
- The 17% year-to-date gain means the risk-reward profile is less asymmetric than it was near the November 2025 low of $187.31
- 35% franking on the final dividend limits income appeal for Australian investors compared to fully franked domestic bank alternatives
- Approximately 20% of global oil and gas transits the Strait of Hormuz; any escalation could create both opportunity and risk for CGM’s commodity trading earnings in FY27
- Post-result broker commentary referenced “incoming target upgrades,” but specific numerical targets are not publicly available, leaving the consensus view partially opaque
Neither the bull case nor the risk list is decisive on its own. The FY26 result answered the question investors were asking after FY25’s weaker ROE, but the share price has already moved to reflect much of that answer. The competing evidence leaves investors with sharper questions rather than a simple verdict.
For investors who want to stress-test the bull case with specific modelling, our deep-dive into Macquarie’s valuation against analyst targets examines the full price target range from $207.58 to $280.73, works through the debt/equity sensitivity at 258.5%, and assesses how the Aligned Data Centers sale at approximately US$40 billion is expected to flow through to performance fees in the periods ahead.
Macquarie’s FY26 result in context: a business that outgrew its pessimists
The FY26 result, particularly the H2 acceleration and ROE re-rating to 14%, validated MQG’s year-to-date outperformance and answered the primary concern investors carried forward from FY25. Macquarie returned capital at a discount through the buyback, grew recurring income through MAM’s 8% AUM expansion, and distributed $7.00 per share to holders. The investment case is multidimensional rather than reliant on a single driver.
The record H2 does, however, set a high base for FY27 comparisons. The variables to watch are CGM’s earnings trajectory in a volatile macro environment and whether MAM can sustain AUM growth momentum. Readers seeking to monitor MQG’s progress should track the H1 FY27 result and any formal guidance updates at the next reporting event.
This article is for informational purposes only and should not be considered financial advice. Investors should conduct their own research and consult with financial professionals before making investment decisions. Past performance does not guarantee future results.
—