Most US retail investors who grasp the theory behind factor investing hit the same wall: they cannot describe what they would actually do tomorrow morning to build one. The gap between understanding that value, momentum, and quality have historically explained stock returns and translating that understanding into a live, maintainable portfolio is rarely addressed directly. Factor-tagged ETFs from Fidelity, Schwab, and Vanguard have made access easier than ever, and screener tools now surface factor exposures in seconds. Yet the practical sequencing, from defining a universe to monitoring live exposures, remains opaque in most retail-facing content.
This guide walks through every sequential decision an investor must make to turn factor investing theory into a structured, repeatable portfolio process. It uses a real-world worked example in which a dual-factor ETF overlap method identified 12 stocks across technology, financials, healthcare, and consumer staples, and it addresses the weighting, rebalancing, and monitoring decisions that determine whether the strategy delivers over time.
What factor investing actually means before you touch a single stock
Factor investing is a rules-based method that targets specific stock characteristics historically linked to explaining returns. It sits between passive indexing, which accepts market-cap weighting without tilts, and discretionary stock picking, which relies on individual judgment. The distinction matters because it sets expectations: factor investing is not a search for hidden winners. It is a structured, long-term tilt toward characteristics that academic research has linked to compensated risk, behavioural inefficiencies, and institutional frictions.
Factor investing occupies a distinct position on the spectrum between passive index investing and discretionary stock picking, requiring more active decisions than a simple index fund but imposing a rules-based discipline that removes the subjectivity driving most retail stock selection errors.
The academic lineage is deep. The Capital Asset Pricing Model (CAPM) introduced market risk as the single explanatory factor. The Fama-French three-factor model added value and size. The Carhart four-factor model added momentum. The Fama-French five-factor model added profitability and investment. Decades of peer-reviewed research support a small set of well-tested factors, even as the broader factor universe has grown to hundreds of candidates, most of which are not genuine, practically investable, or reliably consistent.
AQR’s implementation research has found that simple long-only, low-turnover approaches can capture a meaningful share of factor premiums, making ETF-based strategies viable for retail investors even without the long-short structures institutional portfolios use.
The factors worth building around
Five factors are most relevant to retail implementation:
- Value: targets stocks that are relatively cheap compared to fundamentals such as book value or earnings
- Momentum: targets stocks with strong recent price performance over the prior 6-12 months
- Quality: targets financially strong, highly profitable companies with stable earnings
- Low volatility: targets stocks with below-market price fluctuation
- Size: tilts toward smaller companies, which have historically earned a return premium over large caps
The size factor premium is more nuanced than it appears in most textbook treatments: AQR research confirms the premium is real but concentrated in higher-quality small-cap stocks, meaning passive index exposure to small caps systematically dilutes it by including unprofitable and speculative names that drag aggregate returns.
Value, quality, and low volatility have the clearest economic rationale, grounded in risk compensation and behavioural biases. Momentum is more empirically derived, its premium well-documented but its economic explanation less settled.
The Journal of Finance momentum research by Jegadeesh and Titman established the foundational empirical case for price momentum as a persistent return driver, documenting that stocks with strong 6-12 month prior returns continued to outperform over subsequent holding periods across US equity markets.
Why no factor wins every year
No individual factor outperforms the broad market in every calendar year. Quality and momentum led in 2023; value and low volatility lagged in the same growth-led environment. Long-term commitment is not a nice-to-have. It is a structural requirement of the approach. Without it, the most common implementation mistake follows naturally: abandoning the strategy after the first underperformance cycle.
When big ASX news breaks, our subscribers know first
Building your investable universe and choosing which factors to pursue
Every factor portfolio starts with two decisions: which stocks can be considered, and which factors will be used to rank them.
The starting point is a liquid, investable universe. The S&P 500 serves this purpose well for US retail investors, providing a pool of large, actively traded companies from which factor signals can be measured and ranked without encountering the liquidity and data-quality issues that plague smaller-cap screens.
The next decision is which factors to target. The selection process uses long-run return and volatility data, available through S&P Dow Jones Indices factor dashboards or MSCI factor performance reports. The goal is to identify factors that have delivered both higher average returns and lower annualised volatility than the broad index over a meaningful historical period.
The three-step overlap selection process works as follows:
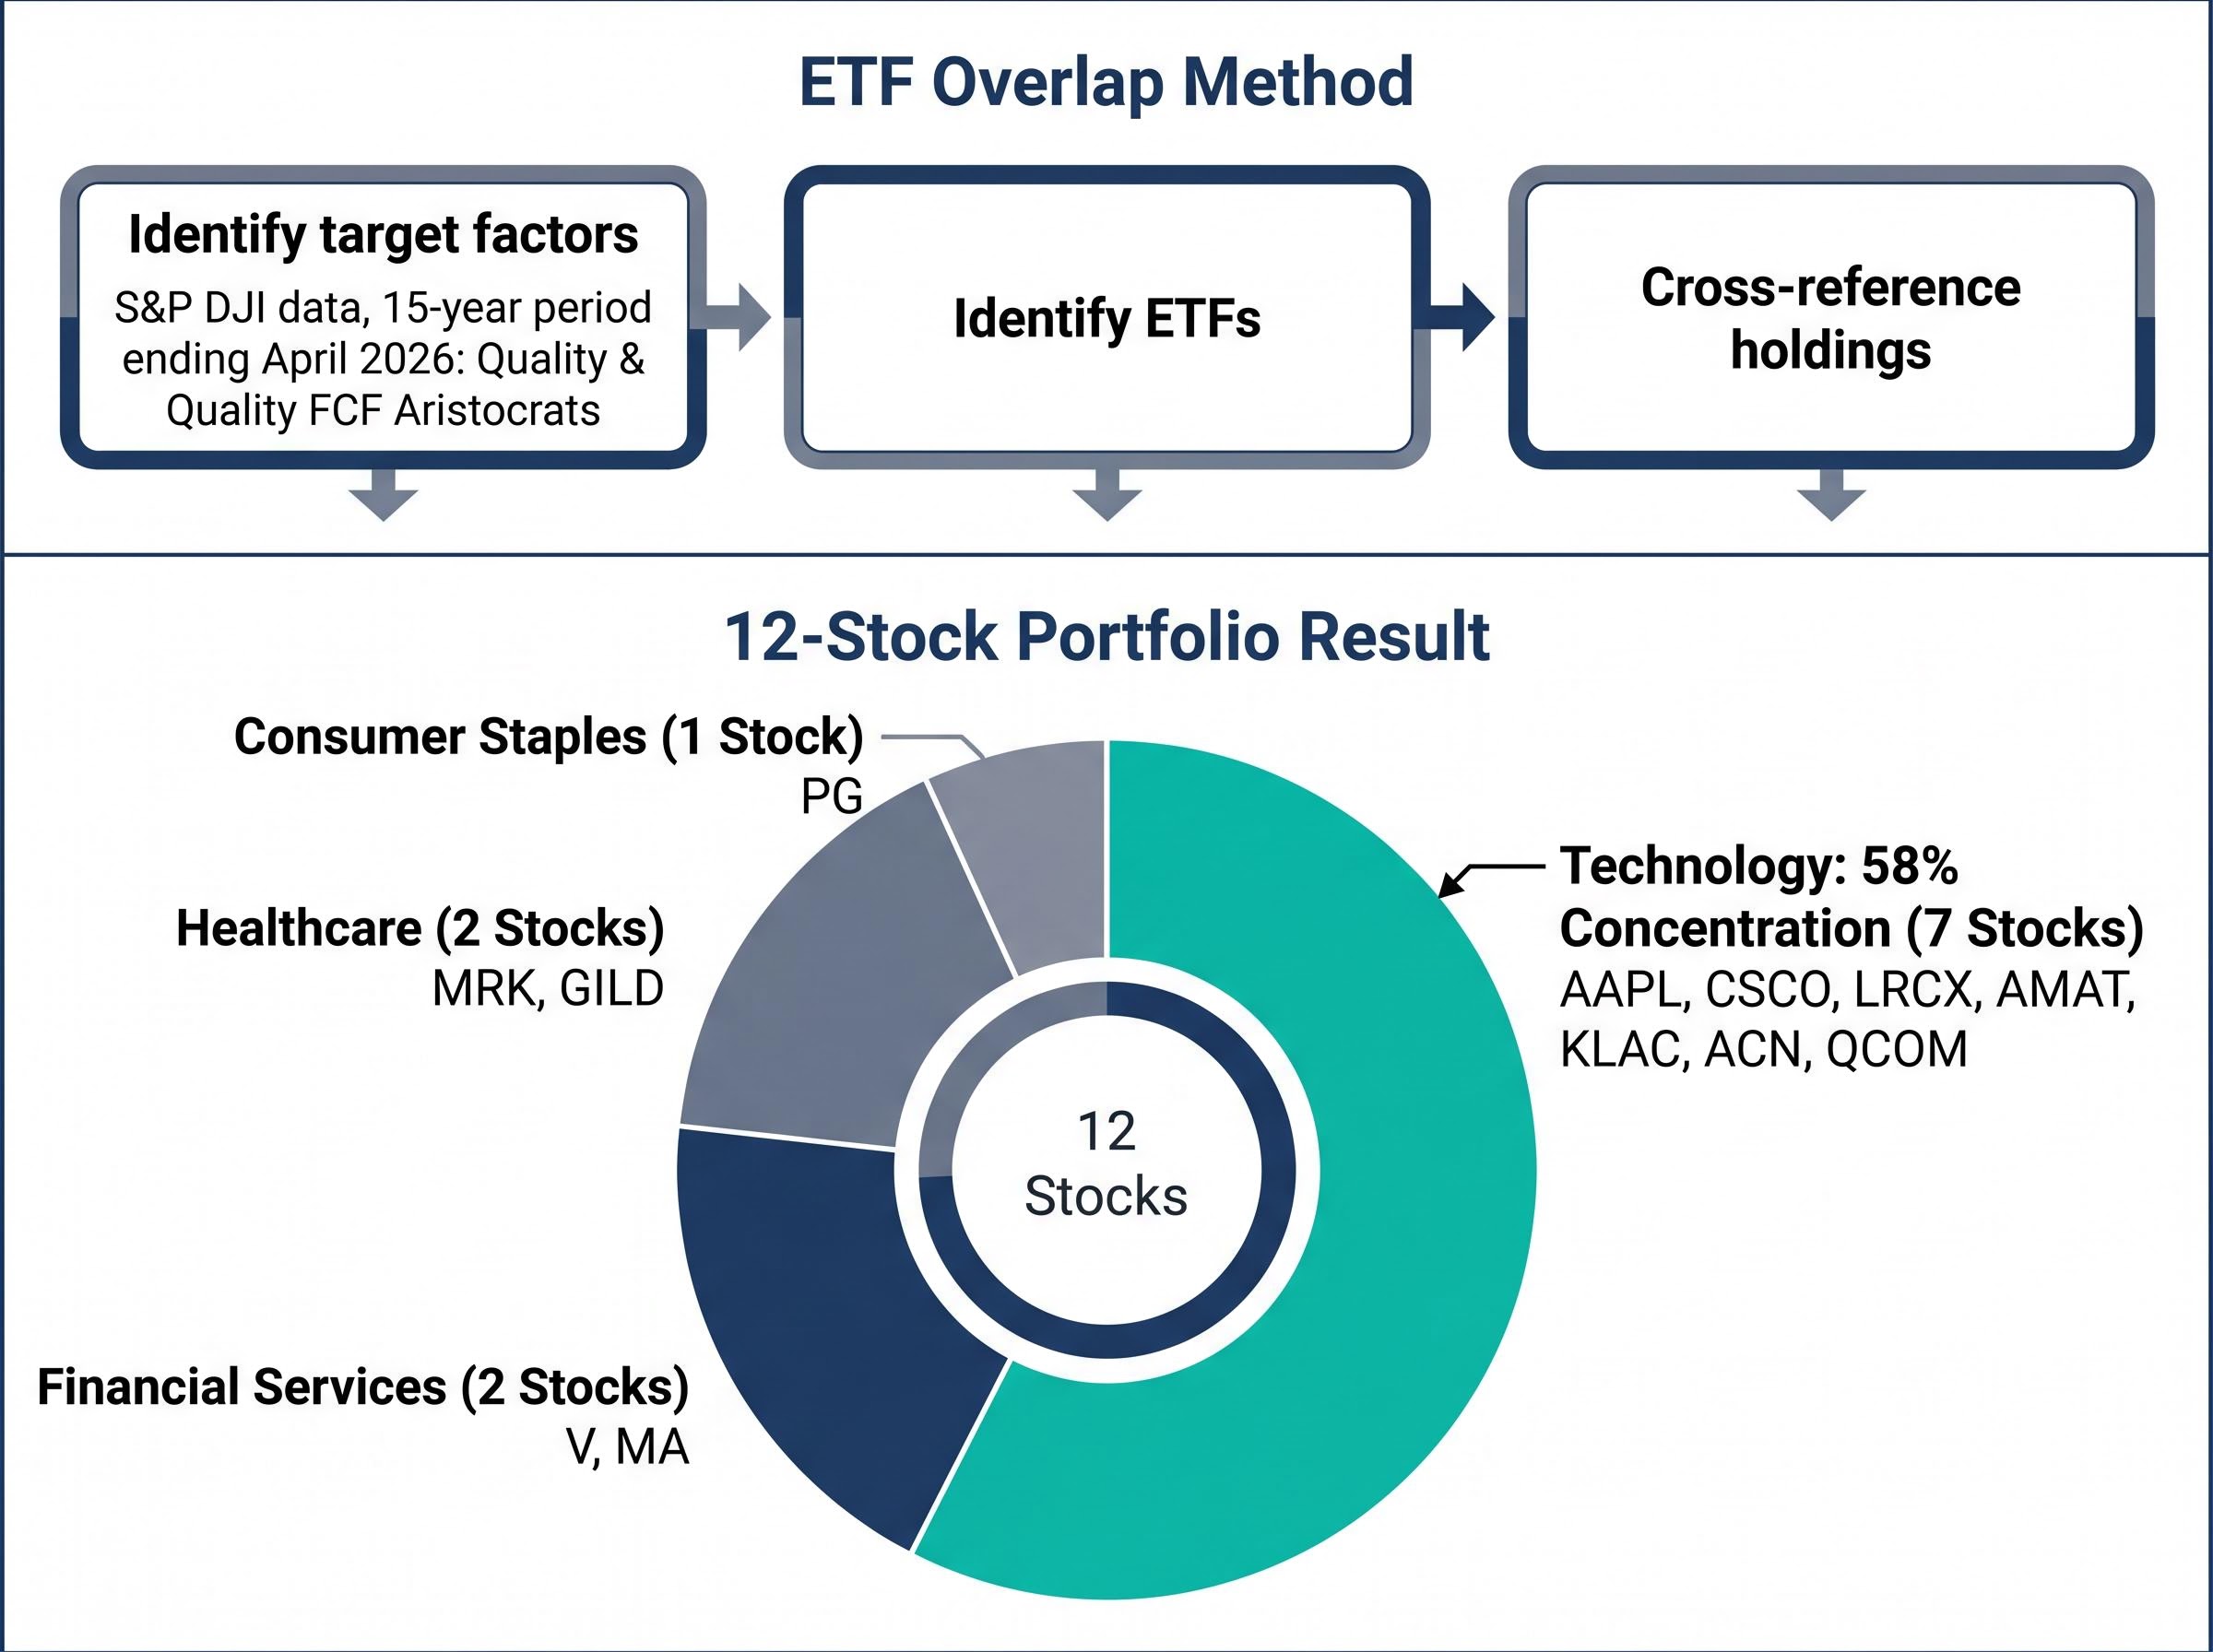
- Identify target factors using historical performance data. In the worked example, S&P DJI data over a 15-year period ending April 2026 identified Quality FCF Aristocrats and Quality as the two factors that exceeded the S&P 500 in average annualised return while producing lower annualised volatility.
- Identify ETFs that track each target factor index.
- Cross-reference holdings between the two ETFs and select stocks appearing in both as the candidate portfolio.
This dual-factor ETF overlap method produced 12 stocks across four sectors:
| Ticker | Company Name | Sector |
|---|---|---|
| AAPL | Apple | Technology |
| CSCO | Cisco Systems | Technology |
| LRCX | Lam Research | Technology |
| AMAT | Applied Materials | Technology |
| KLAC | KLA Corporation | Technology |
| ACN | Accenture | Technology |
| QCOM | Qualcomm | Technology |
| V | Visa | Financial Services |
| MA | Mastercard | Financial Services |
| PG | Procter & Gamble | Consumer Staples |
| MRK | Merck | Healthcare |
| GILD | Gilead Sciences | Healthcare |
Technology represents the largest sector concentration at 7 of 12 stocks. That outcome is a direct input for the constraints step that follows.
Making factor scores comparable: the normalisation process
With a candidate list in hand, the question shifts from what to buy to how to rank. Raw factor metrics, such as price-to-book ratios, return-on-equity figures, and 12-month price returns, are not directly comparable across stocks. They exist on different scales and are distorted by outliers.
A stock with an extreme valuation ratio can dominate a composite score not because it is genuinely cheap but because one raw number is far larger than the others. This is where most retail DIY factor attempts silently break down.
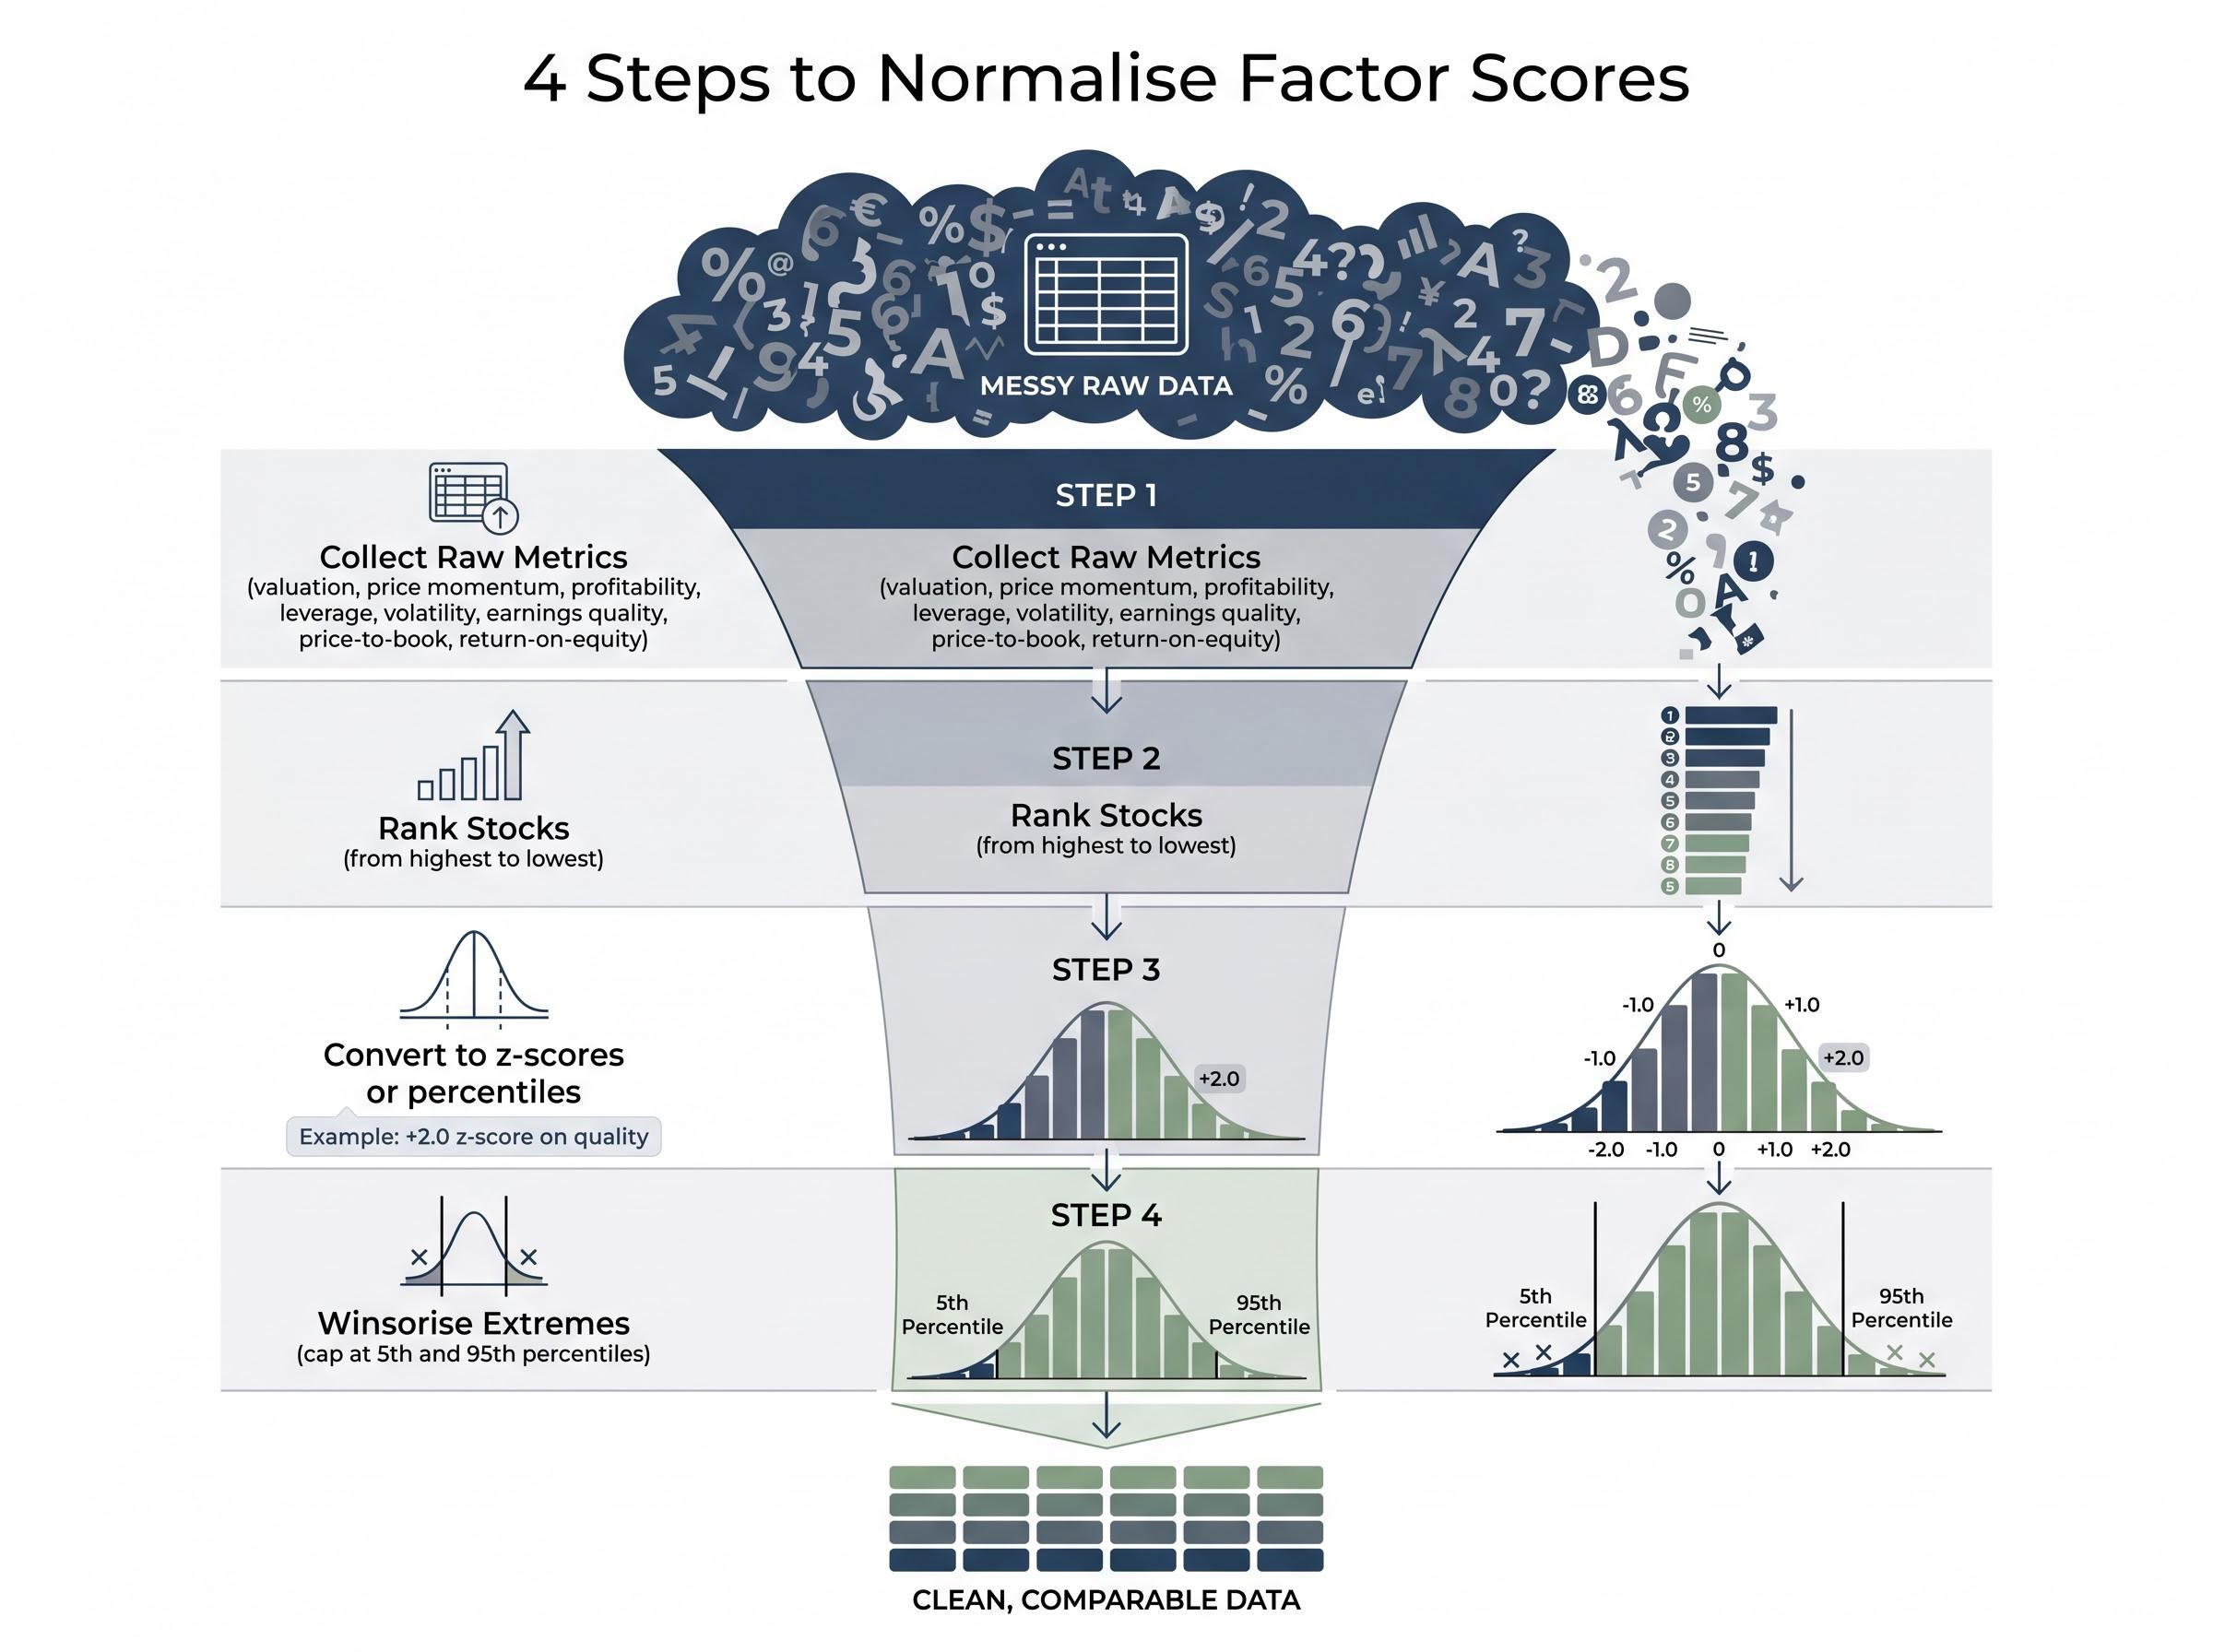
The normalisation process follows four steps:
- Collect raw metrics for each factor across the candidate stocks, including valuation, price momentum, profitability, leverage, volatility, and earnings quality.
- Rank stocks within the universe on each metric from highest to lowest.
- Convert rankings to z-scores or percentile ranks, which place every metric on a common scale regardless of the original unit of measurement.
- Winsorise extremes by capping outlier values at defined thresholds (commonly the 5th and 95th percentiles) to prevent a single anomalous data point from skewing the entire ranking.
For multi-factor approaches, the final step is averaging the normalised scores across chosen factors to produce a single composite ranking. That ranking becomes the basis for inclusion or weighting decisions.
“A z-score of +2.0 on quality means the same thing regardless of whether the underlying metric is return on equity or gross profit margin. Normalisation is what makes cross-stock comparison valid.”
Retail investors who prefer not to calculate raw scores manually can use free tools. Portfolio Visualizer offers Fama-French and Carhart factor regressions. Morningstar Factor Profile surfaces pre-computed factor exposures for US-listed ETFs and individual stocks. Both reduce the computational burden without eliminating the analytical benefit.
Preventing unintended concentration: constraints and capital allocation
A factor portfolio without explicit constraints will often look nothing like what the investor intended. A quality screen can become an inadvertent large-cap bet. A momentum screen can collapse into a concentrated sector position. The worked example illustrates the problem directly: 7 of 12 stocks are technology names, representing approximately 58% of an equal-weighted portfolio before any constraints are applied.
Three core constraint types prevent this kind of unintended drift:
- Sector caps: limit any single sector to a defined maximum (commonly 30-35% of the portfolio)
- Single-stock position limits: cap the weight of any individual holding (commonly 5-10%)
- Factor-tilt minimums: ensure the portfolio maintains a threshold level of factor exposure after constraints are applied, so diversification does not eliminate the tilt entirely
The choice of weighting method determines how capital is allocated among stocks that survive the constraint filters:
| Weighting Approach | Complexity | Diversification Outcome | Best Suited For |
|---|---|---|---|
| Equal weight | Low | Maximum across selected stocks | Investors seeking simplicity and broad factor exposure |
| Inverse-volatility | Moderate | Tilts toward lower-volatility names | Investors prioritising risk reduction within the factor tilt |
| Factor-score-proportional | Higher | Concentrates in strongest factor signals | Investors willing to accept concentration for stronger factor loading |
BlackRock and Vanguard recommend that factor tilts represent 10-30% of total equity allocation rather than the entire equity sleeve, which itself acts as an implicit concentration control. Dimensional Fund Advisors designs its factor funds with embedded diversification constraints, treating turnover and concentration as explicit inputs rather than outputs.
Without this step, the investor holds a list of good stocks. With it, the investor holds a disciplined portfolio with defined risk characteristics.
Designing a rebalancing cadence your process can realistically maintain
Rebalancing is not a mechanical chore. It is the single behavioural commitment that determines whether the factor strategy delivers its long-term return potential or quietly erodes through costs and drift.
The frequency should match the factor’s characteristics. Slower-moving factors like quality and value require only annual or semiannual rebalancing because the underlying signals, profitability metrics and valuation ratios, shift gradually. Faster-moving factors like momentum require more frequent attention but impose higher turnover and tax costs in the process.
“Trading costs can reduce gross factor returns by approximately 0.3 to 1.0 percentage points per year depending on turnover level.” — AQR, “Implementation Costs of Factor Portfolios”
That finding makes the choice of rebalancing trigger a direct return driver. Drift-based bands are the preferred mechanism: rebalance when any position or factor allocation drifts more than a defined threshold, commonly 5 percentage points, rather than on a fixed calendar date. BlackRock’s practical guidance aligns with this approach, recommending a strategic target allocation reviewed annually with bands of approximately plus or minus 5 percentage points to trigger action.
Drift-based rebalancing triggers, which fire when any allocation deviates beyond a set threshold rather than on a fixed calendar date, consistently produce better after-cost outcomes than time-based rules because they concentrate trading activity in periods when drift is large enough to justify transaction friction.
Vanguard recommends annual or semiannual rebalancing for individual long-only factor portfolios rather than monthly or daily. The worked example in this guide uses monthly rebalancing with a proprietary weighting methodology, which is more active than most institutional guidance recommends for retail investors and illustrates the cost-frequency tradeoff clearly.
Four inputs should define the rebalancing decision:
- Factor type: slow-moving (quality, value) versus fast-moving (momentum)
- Account type: taxable accounts face higher cost from frequent rebalancing; tax-advantaged accounts offer more flexibility
- Drift threshold: the percentage-point deviation that triggers action
- Trading cost estimate: the per-trade friction that determines how much each rebalancing event costs in real terms
For taxable US investors, Dimensional Fund Advisors highlights that flexible trading windows and tax-loss harvesting can partially offset rebalancing costs, turning a friction into an opportunity where the portfolio’s losses are strategically realised.
Reading live factor exposures and knowing when to act versus when to wait
Building the portfolio is half the work. Living with it is the other half, and the distinction between two very different situations determines whether the investor holds or acts.
Temporary factor underperformance, where the portfolio trails the S&P 500 because quality or value is out of favour, requires patience. Implementation drift, where the portfolio’s actual factor loadings no longer reflect the original intent, requires rebalancing. Conflating the two is the most expensive mistake in ongoing factor management.
“The right response to factor underperformance is patience. The right response to factor drift is rebalancing. Knowing which situation you are in requires ongoing monitoring.”
Six checkpoints define the monitoring framework:
- Factor exposure versus target: are the intended tilts still present at the defined level?
- Sector concentration: has any sector exceeded the cap set in step three?
- Single-stock weights: have any positions grown disproportionately through price appreciation?
- Portfolio turnover: is the rebalancing frequency producing more trading than intended?
- Tracking error: how far does the portfolio deviate from the benchmark, and is the deviation consistent with the factor tilt?
- Crowding indicators: are the targeted factors showing signs of elevated crowding that may compress near-term returns?
Free tools for tracking factor exposures
Three no-cost options cover the monitoring requirement. MSCI Factor Box, integrated into broker research platforms and select retail dashboards, displays exposure to value, momentum, quality, size, yield, and low volatility at the portfolio level. Morningstar Factor Profile, available for US-listed ETFs and individual stocks via the Morningstar web interface, shows exposures across seven dimensions. Portfolio Visualizer offers free-tier Fama-French and Carhart factor regressions that reveal how factor exposures have evolved over time.
When to act and when to wait
Three threshold conditions warrant action: factor loading drift beyond the defined band, sector concentration exceeding the cap, and single-stock weights that have grown disproportionately through price movement. Temporary underperformance relative to the S&P 500 is not a threshold condition.
MSCI analysis has found that momentum and low volatility strategies periodically exhibit elevated crowding scores. However, MSCI found limited evidence that elevated crowding has permanently impaired long-term factor returns in the factors studied. The recommended mitigation is multi-factor diversification rather than exiting the strategy. BlackRock notes that factor ETFs hold a small share of total US equity market capitalisation, which limits systemic crowding risk for broad investors, though short-term dislocations can occur in narrow or historically popular factors.
The honest case for committing to this approach long enough to see it work
The full framework covers five sequential steps:
- Define universe and select factors using historical performance data and the dual-factor ETF overlap method
- Measure and normalise scores to make stocks comparable across different metrics and scales
- Apply constraints and choose weighting to prevent unintended sector or stock concentration
- Set a rebalancing schedule calibrated to factor speed, account type, and cost tolerance
- Monitor live exposures to distinguish temporary underperformance from structural drift
The limitations are genuine. No factor outperforms every year. Backtested results tend to exceed real-world outcomes once trading costs, taxes, and behavioural errors are included. Crowding and turnover are real frictions, not theoretical ones.
Vanguard has warned that US retail investors frequently use factor ETFs tactically rather than as structured long-term tilts, and the resulting performance-chasing behaviour creates implementation gaps. Morningstar recommends using multi-factor ETFs and model portfolios to avoid the concentrated bets and high turnover produced by DIY stock-picking based on factor signals.
The Morningstar Mind the Gap study documents the return shortfall that US fund investors experience relative to the stated returns of the funds they hold, with performance-chasing and ill-timed switching identified as the primary drivers of the gap, a pattern directly applicable to factor ETF investors who exit strategies during underperformance cycles.
The dual-factor overlap method described in this guide is a repeatable, transparent process that any retail investor can execute with a brokerage account, a factor data source, and a rebalancing calendar. Whether it delivers depends almost entirely on whether the investor maintains the process through the periods when it feels like the wrong approach.
Investors exploring how the size factor is behaving in live markets right now will find our deep-dive into current small-cap factor signals, which examines the Russell 2000 valuation discount relative to the S&P 500, breadth data supporting a potential rotation, and the institutional fund flow shifts that have been building since early 2026.
This article is for informational purposes only and should not be considered financial advice. Investors should conduct their own research and consult with financial professionals before making investment decisions. Past performance does not guarantee future results. Financial projections are subject to market conditions and various risk factors.